This is a sample of what you get after it is processed. The yellow colors in this view come from the Classify Vegetation Height.tif background map.
|
|
|
- Willa Benson
- 5 years ago
- Views:
Transcription

1 This is a sample of what you get after it is processed. The yellow colors in this view come from the Classify Vegetation Height.tif background map. Yellow indicates places where the first and second return are basically the same. For this map, you can see a swamp in the upper right hand corner, the lawns around the buildings (shown green here), playing fields, and a golf course in the upper left with fairways. In this screen, the roads are seen as yellow (but other backgrounds show them well so don t worry). The green areas are generally thickets but may literally be a single bush. It may be a good time to save this file; do it regularly so you don t lose your work.

2 Below is what this map looks like at 2X scale and this area will be looked at in detail in the next few slides. The green, rectangular object is a school building with lawns and a sports field around it. The area to the north has had some lumbering and shows some yellow areas as well as some green areas showing where the lumbered areas have started to grow up as saplings. Remember, as you are field checking you will find differences from what you think is shown -- what appears to be an area of saplings may be something different.
3
4


5 Sometimes features are easier to see with just the shaded relief background. See the difference between the left and the right maps. In the shaded relief map, the arrow points to a rather obvious line, which is a stone wall. When you are field checking, this kind of information is useful to have.
6 Now you are probably thinking about what to do with all these different ways of looking at the data. If you are working with a tablet, you can make the changes back and forth with a click of a mouse. When you need one kind of information, you bring that up. This is a real advantage of mapping with a tablet in the field. If you are working with a map board (which might be advantageous in rocky terrain or bright sunny areas) there is a way to get all this data available. It may not be as easy as with a tablet, but dropping your tablet as you walk in a rocky area might not be a desired result
, then each printout can be moved under your translucent")

7 To see all the data using a map board, put a couple of registration marks on the map. In this case, we'll use two aid station marks. You now can print out all the layers that you think are going to be useful (if printed at the same scale), then each printout can be moved under your translucent drawing surface and be seen. It should all line up. Yes, this isn t as easy as you might like but it may be useful for some purposes. It is also why many mappers prefer tablets for field checking. They also put in the data once and don t have to transfer it later. (That transferring is done by scanning your field notes and then using them as a background map.)
 The map on the left has vegetation, and the one on the right has removed the vegetation and kept the hill shading and contours.")
8 This map has been made with.5 meter contours. It is a bit busier but may show a few more things as you field check. (Remember, you can always hide the form line contours which are the.5 meter ones.) The map on the left has vegetation, and the one on the right has removed the vegetation and kept the hill shading and contours. The next slide has the detail of the right image, enlarged.
9

10 The detail is quite good, and working at this scale with the.5 meter contours may be very helpful when field checking. One other thing that is helpful is to exaggerate the hill shading. To do this, go to DEM at the top of the screen and then look in the menu for Create Hill Shading. Click on this and then look for "exaggerate" and change the value to 10. (Default is 4.) This amount of exaggeration allows you to see a bit more of small knolls but in flat, swampy areas, it will be very bumpy. When asked, save a separate file as hill shading 10 so you can work either with this background or the one produced by the default. To have this exaggerated shading only, go to the Background map menu, then Manage and click to get the visibility eye for only one you want. The eye is in the left hand V column.

11 Below is the exaggerated shading with.5 meter contour of a swampy area. Notice that there is a lot of stuff there and, given that a.5 meter difference will make a new form line contour, it is very busy.

12 At the same time, the exaggerated hill shading can show some very useful things. The stone wall was pointed out earlier; this slide shows what appears to be a long depression. This depression is actually a trail that has had some erosion so it is slightly lower than the area around it. You actually can see where you need to draw the trail. This trail doesn t show up for its entire length but here, this visibility really does help.

13 One very useful background is the LasIntensity. To get this background, go to the Background Map menu and click on Manage. Click on all the eyes on the left hand side of the table to remove them, except for the one for LasIntensity that is probably last on the list. The image seen below is what you now have. This data shows how well the Lidar was reflected. Reflection is very good from hard surfaces or dense leaves, somewhat good from bare dirt or sand, and hardly at all from a field because the waves are basically absorbed by the ground and grasses. For mapping parks and schoolyards, this is very helpful. The left arrow points to the school building, the upper right arrow points to light gray which is a dirt road around the school building, and the bottom arrow points to the paved road and adjoining parking lots.

14 This is the same LasIntensity background which shows a number of things well. The baseball diamond is the most obvious and the fence with the dugouts is also quite easy to see. Of note is with the.5 m contour, you can see that the design of the field had a high point going toward center field so the field would drain. Some other things of note are related to the golf course which is in the left part of the map. The fairways generally show lighter than the rough so these can be delineated. Individual trees show up as black, so they can be placed precisely on the map. In this area, there are three sand traps that also show up as light gray (see arrows). The cart path also looks like a dark gray line.

15 In this segment of the map which is near the school building and parking lot, there are some black dots near the contour line in the lower right part of the image. These show different reflectivity. They look like hard objects similar to the pavement and building. These are actually boulders and reflect radiation well. This image allows a field checker to see exactly where they are.
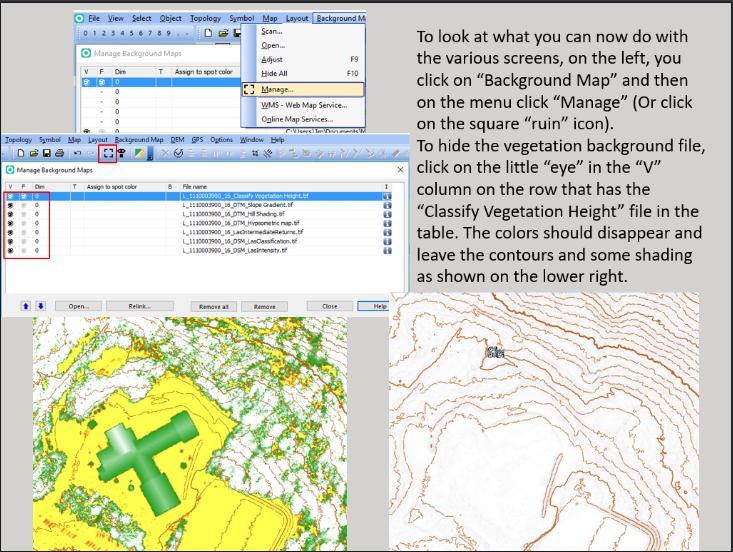
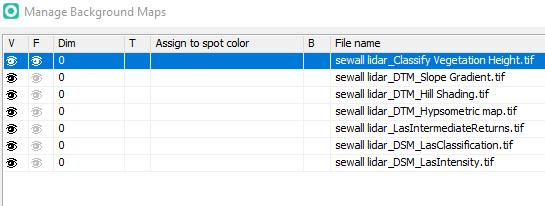
In the Map Background menu, you can go to Manage Background Maps and modify how your background maps look.
 Managing the background information/images In the Map Background menu, you can go to Manage Background Maps and modify how your background maps look. Dim allows you to adjust the brightness of the background
GIS Tools for Hydrology and Hydraulics
 1 OUTLINE GIS Tools for Hydrology and Hydraulics INTRODUCTION Good afternoon! Welcome and thanks for coming. I once heard GIS described as a high-end Swiss Army knife: lots of tools in one little package
Lab 11: Terrain Analyses
 Lab 11: Terrain Analyses What You ll Learn: Basic terrain analysis functions, including watershed, viewshed, and profile processing. There is a mix of old and new functions used in this lab. We ll explain
I CALCULATIONS WITHIN AN ATTRIBUTE TABLE
 Geology & Geophysics REU GPS/GIS 1-day workshop handout #4: Working with data in ArcGIS You will create a raster DEM by interpolating contour data, create a shaded relief image, and pull data out of the
Objectives Learn how GMS uses rasters to support all kinds of digital elevation models and how rasters can be used for interpolation in GMS.
 v. 9.1 GMS 9.1 Tutorial Using rasters for interpolation and visualization in GMS Objectives Learn how GMS uses rasters to support all kinds of digital elevation models and how rasters can be used for interpolation
DIGITAL SURFACE MODELS OF CITY AREAS BY VERY HIGH RESOLUTION SPACE IMAGERY
 DIGITAL SURFACE MODELS OF CITY AREAS BY VERY HIGH RESOLUTION SPACE IMAGERY Jacobsen, K. University of Hannover, Institute of Photogrammetry and Geoinformation, Nienburger Str.1, D30167 Hannover phone +49
Vegetation height maps derived from digital elevation models the next innovation in the production of orienteering maps?
 Vegetation height maps derived from digital elevation models the next innovation in the production of orienteering maps? Development of Orienteering Maps. 1. Revolution 20 years ago: Digital Cartography
Interactive Tourist Map
 Adobe Edge Animate Tutorial Mouse Events Interactive Tourist Map Lesson 2 Make click events In the last lesson you learned how to set up you stage and get your project ready for some interactivity. You
Creating Digital Illustrations for Your Research Workshop III Basic Illustration Demo
 Creating Digital Illustrations for Your Research Workshop III Basic Illustration Demo Final Figure Size exclusion chromatography (SEC) is used primarily for the analysis of large molecules such as proteins
UV Mapping to avoid texture flaws and enable proper shading
 UV Mapping to avoid texture flaws and enable proper shading Foreword: Throughout this tutorial I am going to be using Maya s built in UV Mapping utility, which I am going to base my projections on individual
In this lesson you are going to create a drawing program similar to Windows Paint. 1. Start with a new project and remove the default cat sprite.
 Drawing Program In this lesson you are going to create a drawing program similar to Windows Paint. 1. Start with a new project and remove the default cat sprite. 2. Create a new sprite. 3. The new sprite
Using rasters for interpolation and visualization in GMS
 v. 10.3 GMS 10.3 Tutorial Using rasters for interpolation and visualization in GMS Objectives This tutorial teaches how GMS uses rasters to support all kinds of digital elevation models and how rasters
Building level Rail embankments and correcting heights with XML. (V1.0) (Tangram)
 (Tangram)") Building level Rail embankments and correcting heights with XML. (V1.0) (Tangram) 1 This tutorial has been created to illustrate a few techniques in providing raised level embankments for railway lines
Building level Rail embankments and correcting heights with XML. (V1.0) (Tangram) 1 This tutorial has been created to illustrate a few techniques in providing raised level embankments for railway lines
Lab 11: Terrain Analysis
 Lab 11: Terrain Analysis What You ll Learn: Basic terrain analysis functions, including watershed, viewshed, and profile processing. You should read chapter 11 in the GIS Fundamentals textbook before performing
Earthwork 3D for Dummies Doing a digitized dirt takeoff calculation the swift and easy way
 Introduction Earthwork 3D for Dummies Doing a digitized dirt takeoff calculation the swift and easy way Getting to know you Earthwork has inherited its layout from its ancestors, Sitework 98 and Edge.
Lab 11: Terrain Analyses
 Lab 11: Terrain Analyses What You ll Learn: Basic terrain analysis functions, including watershed, viewshed, and profile processing. There is a mix of old and new functions used in this lab. We ll explain
On the Web sun.com/aboutsun/comm_invest STAROFFICE 8 DRAW
 STAROFFICE 8 DRAW Graphics They say a picture is worth a thousand words. Pictures are often used along with our words for good reason. They help communicate our thoughts. They give extra information that
Microsoft Excel 2007 Lesson 7: Charts and Comments
 Microsoft Excel 2007 Lesson 7: Charts and Comments Open Example.xlsx if it is not already open. Click on the Example 3 tab to see the worksheet for this lesson. This is essentially the same worksheet that
Surveying Prof. Bharat Lohani Indian Institute of Technology, Kanpur. Lecture - 1 Module - 6 Triangulation and Trilateration
 Surveying Prof. Bharat Lohani Indian Institute of Technology, Kanpur Lecture - 1 Module - 6 Triangulation and Trilateration (Refer Slide Time: 00:21) Welcome to this another lecture on basic surveying.
Graphic Design & Digital Photography. Photoshop Basics: Working With Selection.
 1 Graphic Design & Digital Photography Photoshop Basics: Working With Selection. What You ll Learn: Make specific areas of an image active using selection tools, reposition a selection marquee, move and
Touring the Mac S e s s i o n 4 : S A V E, P R I N T, C L O S E & Q U I T
 Touring the Mac S e s s i o n 4 : S A V E, P R I N T, C L O S E & Q U I T Touring_the_Mac_Session-4_Feb-22-2011 1 To store your document for later retrieval, you must save an electronic file in your computer.
SNC2D PHYSICS 4/27/2013. LIGHT & GEOMETRIC OPTICS L Light Rays & Reflection (P ) Light Rays & Reflection. The Ray Model of Light
 Light Rays & Reflection. The Ray Model of Light") SNC2D PHYSICS LIGHT & GEOMETRIC OPTICS L Light Rays & Reflection (P.402-409) Light Rays & Reflection A driver adjusts her rearview mirror. The mirror allows her to see the cars behind her. Mirrors help
SNC2D PHYSICS LIGHT & GEOMETRIC OPTICS L Light Rays & Reflection (P.402-409) Light Rays & Reflection A driver adjusts her rearview mirror. The mirror allows her to see the cars behind her. Mirrors help
Using Flash Animation Basics
 Using Flash Contents Using Flash... 1 Animation Basics... 1 Exercise 1. Creating a Symbol... 2 Exercise 2. Working with Layers... 4 Exercise 3. Using the Timeline... 6 Exercise 4. Previewing an animation...
Software Instructions
 Software Instructions A brief guide to using the software features of ClearTriage Table of Contents Sign In... 2 Navigation, General Notes and Menu... 2 Protocols... 3 Questions... 3 Care Advice... 4 Copy
New in SoundPLANessential 4.1 / 4.0 December 2017
 Installation Page 1 New in SoundPLANessential 4.1 / 4.0 December 2017 Installation SoundPLANessential 4.1 can be installed parallel to earlier SoundPLANessential versions, older versions do not need to
LEARN OPENSTREET MAP FOR TANZANIA PROJECT 2501 FIRST SIGN UP FOR AN ACCOUNT HERE https://www.openstreetmap.org/user/new
 FIRST SIGN UP FOR AN ACCOUNT HERE https://www.openstreetmap.org/user/new Next there is a long-ish but useful tutorial on how to use OpenStreetMap at MapGive http://mapgive.state.gov/learn-to-map/ - the
Lecture 21 - Chapter 8 (Raster Analysis, part2)
") GEOL 452/552 - GIS for Geoscientists I Lecture 21 - Chapter 8 (Raster Analysis, part2) Today: Digital Elevation Models (DEMs), Topographic functions (surface analysis): slope, aspect hillshade, viewshed,
GEOL 452/552 - GIS for Geoscientists I Lecture 21 - Chapter 8 (Raster Analysis, part2) Today: Digital Elevation Models (DEMs), Topographic functions (surface analysis): slope, aspect hillshade, viewshed,
Flowcharts for Picaxe BASIC
 Flowcharts for Picaxe BASIC Tech Studies Page 1 of 11 In the college you will use the PICAXE Programming Environment in order to carry out all of your program writing, simulating and downloading to the
Using Microsoft Word. Getting Started With Word. Exercise 1 Starting the Program
 Using Microsoft Word Getting Started With Word Exercise 1 Starting the Program There are several ways to start a program in Microsoft Windows and they may include the following: Clicking an icon on the
Reflection 16/03/2016 cgrahamphysics.com 2016
 Reflection What happens to light when it hits a mirror? Reflection Starter: We use our eyes to see. Who s eye am I? Starter Use a mirror to draw a mirror image of your name. When something is reflected
Lab 10: Raster Analyses
 Lab 10: Raster Analyses What You ll Learn: Spatial analysis and modeling with raster data. You will estimate the access costs for all points on a landscape, based on slope and distance to roads. You ll
GUIDE TO View3D. Introduction to View3D
 View3D Guide Introduction to View3D... 1 Starting Hampson-Russell Software... 2 Starting View3D... 4 A Brief Summary of the View3D Process... 8 Loading the Seismic and Horizon Data... 8 Viewing the Data...
Lab 5: Georeferencing, Digitization, and Processing
 Lab 5: Georeferencing, Digitization, and Processing Purpose: An introduction to georeferencing images, practice digitizing, and combine lesson up to this point. To Do: Register a scanned image, digitize
FACULTY AND STAFF COMPUTER FOOTHILL-DE ANZA. Office Graphics
 FACULTY AND STAFF COMPUTER TRAINING @ FOOTHILL-DE ANZA Office 2001 Graphics Microsoft Clip Art Introduction Office 2001 wants to be the application that does everything, including Windows! When it comes
Using Mail Merge in Microsoft Word 2003
 Using Mail Merge in Microsoft Word 2003 Mail Merge Created: 12 April 2005 Note: You should be competent in Microsoft Word before you attempt this Tutorial. Open Microsoft Word 2003 Beginning the Merge
Introduction: The Nature of Light
 O1 Introduction: The Nature of Light Introduction Optical elements and systems Basic properties O1.1 Overview Generally Geometrical Optics is considered a less abstract subject than Waves or Physical Optics
Google SketchUp Design Exercise 1
 Google SketchUp Design Exercise 1 The first thing students like to do in SketchUp is make a basic house and try out different colors and materials. They also love making windows and doors, and trying out
Using Mail Merge in Microsoft Word XP/2002
 Using Mail Merge in Microsoft Word XP/2002 Open Microsoft Word XP/2002 Beginning the Merge You may start Mail Merge with a blank document or one that you have already created. We will use a blank document
Camera Deployment Guide
 Camera Deployment Guide Page 1 of 8 Overview of Camera Deployment Procedure You will be deploying your cameras in sets of 3: o On trail one camera that captures picture of traffic on a hiking trail o Near
Basic Concepts 1. Starting Powerpoint 2000 (Windows) For the Basics workshop, select Template. For this workshop, select Artsy
 For the Basics workshop, select Template. For this workshop, select Artsy") 1 Starting Powerpoint 2000 (Windows) When you create a new presentation, you re prompted to choose between: Autocontent wizard Prompts you through a series of questions about the context and content of
1 Starting Powerpoint 2000 (Windows) When you create a new presentation, you re prompted to choose between: Autocontent wizard Prompts you through a series of questions about the context and content of
OCAD and Lidar. What you can do with LIDAR data in OCAD and how to get it.
 OCAD and Lidar What you can do with LIDAR data in OCAD and how to get it. Starting the Process This presentation will show, step by step, how to take Lidar data and put it into OCAD 12 to produce a basemap
Field-Scale Watershed Analysis
 Conservation Applications of LiDAR Field-Scale Watershed Analysis A Supplemental Exercise for the Hydrologic Applications Module Andy Jenks, University of Minnesota Department of Forest Resources 2013
Soft shadows. Steve Marschner Cornell University CS 569 Spring 2008, 21 February
 Soft shadows Steve Marschner Cornell University CS 569 Spring 2008, 21 February Soft shadows are what we normally see in the real world. If you are near a bare halogen bulb, a stage spotlight, or other
Introduction to LiDAR
 Introduction to LiDAR Our goals here are to introduce you to LiDAR data. LiDAR data is becoming common, provides ground, building, and vegetation heights at high accuracy and detail, and is available statewide.
Exercise 1 The Rock Climber
 Exercise 1 The Rock Climber In this exercise, you will start building up your program sequence, a documentary called Rock Climber. You will use Avid Media Composer s basic editing functions to lay down
Select, Move, Rotate and Scale
 Select, Move, Rotate and Scale In this tutorial we will cover the basic tools necessary for navigating, moving, and manipulating objects in 3DS Max. It is less of a how to tutorial and more of a guide
Full Search Map Tab Overview
 FlexMLS Map Server Full Search Map Tab Overview The Full Search Map tab is a need to know module. It is accessible when you use Full Search under Search in the Main Menu tree of FlexMLS. This map can
Customize Your Environment
 26 c h a p t e r 2 Customize Your Environment Every vector drawing program comes with default settings. In general, the defaults are OK, but customizing your preferences will make creating your vector
Final project: Lecture 21 - Chapter 8 (Raster Analysis, part2) GEOL 452/552 - GIS for Geoscientists I
 GEOL 452/552 - GIS for Geoscientists I") GEOL 452/552 - GIS for Geoscientists I Lecture 21 - Chapter 8 (Raster Analysis, part2) Talk about class project (copy follow_along_data\ch8a_class_ex into U:\ArcGIS\ if needed) Catch up with lecture 20
GEOL 452/552 - GIS for Geoscientists I Lecture 21 - Chapter 8 (Raster Analysis, part2) Talk about class project (copy follow_along_data\ch8a_class_ex into U:\ArcGIS\ if needed) Catch up with lecture 20
Department of Physics & Astronomy Lab Manual Undergraduate Labs. A Guide to Logger Pro
 A Guide to Logger Pro Logger Pro is the main program used in our physics labs for data collection and analysis. You are encouraged to download Logger Pro to your personal laptop and bring it with you to
How to Add a Text Watermark to a Digital Image
 How to Add a Text Watermark to a Digital Image Placing a watermark on pictures that you plan to publish to the web will identify them as your own work and discourage people from stealing your works or
Bill Cusworth CREATING ORIENTEERING BASEMAPS USING LIDAR DATA
 Bill Cusworth CREATING ORIENTEERING BASEMAPS USING LIDAR DATA 1 BILL CUSWORTH Started Orienteering in 1992 in Seattle with Cascade Orienteering Club. Started making maps in 1993 and became more serious
Vanishing Flagpole (An Adobe Photo Shop CS5 Project)
") Vanishing Flagpole (An Adobe Photo Shop CS5 Project) Now you see it. Now you don t Getting Started 1) Download the files needed for this project 2) Unzip the flagpole folder then delete the zipped file.
Vanishing Flagpole (An Adobe Photo Shop CS5 Project) Now you see it. Now you don t Getting Started 1) Download the files needed for this project 2) Unzip the flagpole folder then delete the zipped file.
COS 116 The Computational Universe Laboratory 10: Computer Graphics
 COS 116 The Computational Universe Laboratory 10: Computer Graphics As mentioned in lecture, computer graphics has four major parts: imaging, rendering, modeling, and animation. In this lab you will learn
FAQ - Podium v1.4 by Jim Allen
 FAQ - Podium v1.4 by Jim Allen Podium is the only plug-in to run natively within SketchUp, and the only one to have a true 'one click' photorealistic output. Although it is about as simple as you can expect
See page 7 for step-by-step instructions with graphic illustrations
 Welcome to our new Chat! For those of you who have been with us a while, you ll see a lot of new and different features in this Chat. As we had to transition to this new chat on short notice due to our
CREATING A POWERPOINT PRESENTATION BASIC INSTRUCTIONS
 CREATING A POWERPOINT PRESENTATION BASIC INSTRUCTIONS By Carolyn H. Brown This document is created with PowerPoint 2013/15 which includes a number of differences from earlier versions of PowerPoint. GETTING
Introduction to GIS A Journey Through Gale Crater
 Introduction to GIS A Journey Through Gale Crater In this lab you will be learning how to use ArcMap, one of the most common commercial software packages for GIS (Geographic Information System). Throughout
Fruit Snake SECTION 1
 Fruit Snake SECTION 1 For the first full Construct 2 game you're going to create a snake game. In this game, you'll have a snake that will "eat" fruit, and grow longer with each object or piece of fruit
Objectives Import DEMs from an online database. Set the display options of an imported DEM and view and edit the DEM attributes.
 v. 10.0 WMS 10.0 Tutorial Import, view, and edit digital elevation models Objectives Import DEMs from an online database. Set the display options of an imported DEM and view and edit the DEM attributes.
PowerPoint 2010 Introduction
 PowerPoint 2010 Introduction TOOLBAR RIBBON What is the ribbon? The ribbon contains the commands and other menu items that were on menu and toolbars in PowerPoint 2003 and earlier. The ribbon is designed
Lesson 03: We will add water and will set the placing conditions for the material. WorldBuilder 3.5. for. About Digital Element Tutorials:
 Lesson 03: We will add water and will set the placing conditions for the material for WorldBuilder 3.5 About Digital Element Tutorials: This tutorial is available both in.pdf format and in Qarbon format,
Animations that make decisions
 Chapter 17 Animations that make decisions 17.1 String decisions Worked Exercise 17.1.1 Develop an animation of a simple traffic light. It should initially show a green disk; after 5 seconds, it should
So on the survey, someone mentioned they wanted to work on heaps, and someone else mentioned they wanted to work on balanced binary search trees.
 So on the survey, someone mentioned they wanted to work on heaps, and someone else mentioned they wanted to work on balanced binary search trees. According to the 161 schedule, heaps were last week, hashing
Flash offers a way to simplify your work, using symbols. A symbol can be
 Chapter 7 Heavy Symbolism In This Chapter Exploring types of symbols Making symbols Creating instances Flash offers a way to simplify your work, using symbols. A symbol can be any object or combination
MAKING TABLES WITH WORD BASIC INSTRUCTIONS. Setting the Page Orientation. Inserting the Basic Table. Daily Schedule
 MAKING TABLES WITH WORD BASIC INSTRUCTIONS Setting the Page Orientation Once in word, decide if you want your paper to print vertically (the normal way, called portrait) or horizontally (called landscape)
WMS 9.1 Tutorial Watershed Modeling DEM Delineation Learn how to delineate a watershed using the hydrologic modeling wizard
 v. 9.1 WMS 9.1 Tutorial Learn how to delineate a watershed using the hydrologic modeling wizard Objectives Read a digital elevation model, compute flow directions, and delineate a watershed and sub-basins
Making parchments and parchment scrolls
 Making parchments and parchment scrolls I am delighted to accept an invitation from Profantasy to present the methods I use to make parchment and parchment scrolls for use as backgrounds in CC3. I hope
MS Word Basic Word 2007 Concepts
 MS Word Basic Word 2007 Concepts BWD 1 BASIC MS WORD CONCEPTS This section contains some very basic MS Word information that will help you complete the assignments in this book. If you forget how to save,
Reality Check: Processing LiDAR Data. A story of data, more data and some more data
 Reality Check: Processing LiDAR Data A story of data, more data and some more data Red River of the North Red River of the North Red River of the North Red River of the North Introduction and Background
Instructions for designing the HelloWorld circuit board using Autodesk Eagle 8.6.0
 Instructions for designing the HelloWorld circuit board using Autodesk Eagle 8.6.0 FABLAB BRIGHTON 2018 These instructions take you through step-by-step the process of creating the full circuit board design
Back Country Navigator (BCN) Instructions and File Links
 Instructions and File Links") Instructions and File Links for Installing My Maps in Back Country Navigator, Orux Maps, and Garmin GPS s. BobT, updated 6/10/17 This is a lengthy document since I have tried to go into great detail with
Instructions and File Links for Installing My Maps in Back Country Navigator, Orux Maps, and Garmin GPS s. BobT, updated 6/10/17 This is a lengthy document since I have tried to go into great detail with
3DReshaper Help DReshaper Beginner's Guide. Surveying
 3DReshaper Beginner's Guide Surveying 1 of 29 Cross sections Exercise: Tunnel analysis Surface analysis Exercise: Complete analysis of a concrete floor Surveying extraction Exercise: Automatic extraction
v Editing Elevations DEM Basics Import, view, and edit digital elevation models WMS Tutorials Time minutes Prerequisite Tutorials None
 v. 11.0 WMS 11.0 Tutorial Import, view, and edit digital elevation models Objectives Learn to import DEMs from an online database, set the display options for an imported DEM, and view and edit the DEM
-Using Excel- *The columns are marked by letters, the rows by numbers. For example, A1 designates row A, column 1.
 -Using Excel- Note: The version of Excel that you are using might vary slightly from this handout. This is for Office 2004 (Mac). If you are using a different version, while things may look slightly different,
SYMBOLISATION. Generalisation: which / how many features we display.. Symbolisation: how to display them?
 Generalisation: which / how many features we display.. Symbolisation: how to display them? SYMBOLISATION General Goal: easy and effective communication based on design principles and common sense as much
Full Search Map Tab. This map is the result of selecting the Map tab within Full Search.
 Full Search Map Tab This map is the result of selecting the Map tab within Full Search. This map can be used when defining your parameters starting from a Full Search. Once you have entered your desired
Taskbar: Working with Several Windows at Once
 Taskbar: Working with Several Windows at Once Your Best Friend at the Bottom of the Screen How to Make the Most of Your Taskbar The taskbar is the wide bar that stretches across the bottom of your screen,
CS Problem Solving and Object-Oriented Programming
 CS 101 - Problem Solving and Object-Oriented Programming Lab 5 - Draw a Penguin Due: October 28/29 Pre-lab Preparation Before coming to lab, you are expected to have: Read Bruce chapters 1-3 Introduction
Automatically Generated Vegetation Density Maps with LiDAR Survey for Orienteering Purpose
 Automatically Generated Vegetation Density Maps with LiDAR Survey for Orienteering Purpose Dušan Petrovič a a University of Ljubljana, Faculty of Civil and Geodetic Engineering, Ljubljana, Slovenia; dusan.petrovic@fgg.uni-lj.si
Generating 50cm elevation contours from space PhotoSat s s new stereo satellite elevation processing system
 Generating 50cm elevation contours from space PhotoSat s s new stereo satellite elevation processing system Gerry Mitchell PhotoSat November 2009 PhotoSat stereo satellite processing history PhotoSat has
Making ecards Can Be Fun!
 Making ecards Can Be Fun! A Macromedia Flash Tutorial By Mike Travis For ETEC 664 University of Hawaii Graduate Program in Educational Technology April 4, 2005 The Goal The goal of this project is to create
UNIT 11: Revolved and Extruded Shapes
 UNIT 11: Revolved and Extruded Shapes In addition to basic geometric shapes and importing of three-dimensional STL files, SOLIDCast allows you to create three-dimensional shapes that are formed by revolving
TUTORIAL 03: RHINO DRAWING & ORGANIZATIONAL AIDS. By Jeremy L Roh, Professor of Digital Methods I UNC Charlotte s School of Architecture
 TUTORIAL 03: RHINO DRAWING & ORGANIZATIONAL AIDS By Jeremy L Roh, Professor of Digital Methods I UNC Charlotte s School of Architecture Modeling in 3D requires the use of various drawing and organizational
Introduction Panning the View...9 Zooming the View...9 Zooming into the Selection...10 Zooming into a Rectangle...10 Adding Objects...
 Copyright Hengestone Holdings, Inc. All Rights Reserved. Copyright Idea Spectrum, Inc. All Rights Reserved. Idea Spectrum, and the Idea Spectrum logo are all trademarks of Idea Spectrum, Inc. Windows is
Adjusting the Display Contrast (Making the Screen Lighter or Darker)
") Introduction: TI-86 On/Off, Contrast, Mode, and Editing Expressions Turning the Calculator On When you press the ON button, you should see a blinking dark rectangle (called the cursor) in the upper left-hand
Introduction: TI-86 On/Off, Contrast, Mode, and Editing Expressions Turning the Calculator On When you press the ON button, you should see a blinking dark rectangle (called the cursor) in the upper left-hand
1.4 MULTIPLYING WHOLE NUMBER EXPRESSIONS
 1.4 MULTIPLYING WHOLE NUMBER EXPRESSIONS Understanding Multiplication of Whole Numbers Multiplication of whole numbers can be thought of as repeated addition. For example, suppose that a small parking
Test Profiles for Digital Terrain Models
 Test Profiles for Digital Terrain Models 1.1 Overview Jointly developed by the Photogrammetics and GEOPAK Units within the Minnesota Department of Transportation, this procedure details the standard procedure
Module: Rasters. 8.1 Lesson: Working with Raster Data Follow along: Loading Raster Data CHAPTER 8
 CHAPTER 8 Module: Rasters We ve used rasters for digitizing before, but raster data can also be used directly. In this module, you ll see how it s done in QGIS. 8.1 Lesson: Working with Raster Data Raster
What is a Topographic Map?
 Topographic Maps Topography From Greek topos, place and grapho, write the study of surface shape and features of the Earth and other planetary bodies. Depiction in maps. Person whom makes maps is called
Adobe Flash CS3 Reference Flash CS3 Application Window
 Adobe Flash CS3 Reference Flash CS3 Application Window When you load up Flash CS3 and choose to create a new Flash document, the application window should look something like the screenshot below. Layers
USING SMART NOTEBOOK SOFTWARE
 USING SMART NOTEBOOK SOFTWARE THE NOTEBOOK INTERFACE The Notebook interface is easy to use and many functions (such as inserting pictures, saving files etc.) will be famillar as they are simillar to those
Reconnaissance and Surveillance Leader s Course Map Reading self study worksheet (Tenino, Washington Map)
") Reconnaissance and Surveillance Leader s Course Map Reading self study worksheet (Tenino, Washington Map) General Knowledge 1. Name the five Basic Colors on a map and what they represent? 1. 2. 3. 4. 5.
Reconnaissance and Surveillance Leader s Course Map Reading self study worksheet (Tenino, Washington Map) General Knowledge 1. Name the five Basic Colors on a map and what they represent? 1. 2. 3. 4. 5.
_Tutorials. Arcmap. Linking additional files outside from Geodata
 _Tutorials Arcmap Linking additional files outside from Geodata 2017 Sourcing the Data (Option 1): Extracting Data from Auckland Council GIS P1 First you want to get onto the Auckland Council GIS website
OrbBasic Lesson 1 Goto and Variables: Student Guide
 OrbBasic Lesson 1 Goto and Variables: Student Guide Sphero MacroLab is a really cool app to give the Sphero commands, but it s limited in what it can do. You give it a list of commands and it starts at
DIRECTV Message Board
 DIRECTV Message Board DIRECTV Message Board is an exciting new product for commercial customers. It is being shown at DIRECTV Revolution 2012 for the first time, but the Solid Signal team were lucky enough
1.54 Law of Reflection
 1.54 Law of Reflection Define reflection and image. Compare and contrast regular and diffuse reflection. State the law of reflection. 193 1.54. Law of Reflection www.ck12.org This dancer is practicing
Create a unit using United Streaming and PowerPoint. Materials: Microsoft PowerPoint, Internet access, United Streaming account
 Create a unit using United Streaming and PowerPoint Materials: Microsoft PowerPoint, Internet access, United Streaming account Find United Streaming Clips: 1. Decide on a topic for your unit. 2. Search
GSAK (Geocaching Swiss Army Knife) GEOCACHING SOFTWARE ADVANCED KLASS GSAK by C3GPS & Major134
 GEOCACHING SOFTWARE ADVANCED KLASS GSAK by C3GPS & Major134") GSAK (Geocaching Swiss Army Knife) GEOCACHING SOFTWARE ADVANCED KLASS GSAK - 102 by C3GPS & Major134 Table of Contents About this Document... iii Class Materials... iv 1.0 Locations...1 1.1 Adding Locations...
GSAK (Geocaching Swiss Army Knife) GEOCACHING SOFTWARE ADVANCED KLASS GSAK - 102 by C3GPS & Major134 Table of Contents About this Document... iii Class Materials... iv 1.0 Locations...1 1.1 Adding Locations...
How does light energy travel? transparent transmit mediums media medium
 Have you ever observed a solar eclipse like the one in this photograph? During a solar eclipse, it can become very dark in the middle of a sunny day. This may seem amazing to us, but it was terrifying