APPENDIX E TRANSPORTATION
|
|
|
- Alan Bates
- 5 years ago
- Views:
Transcription
1 APPENDIX E TRANSPORTATION
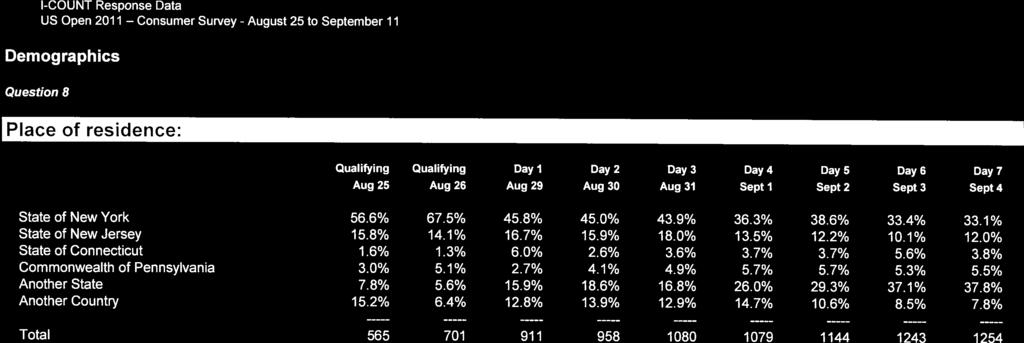
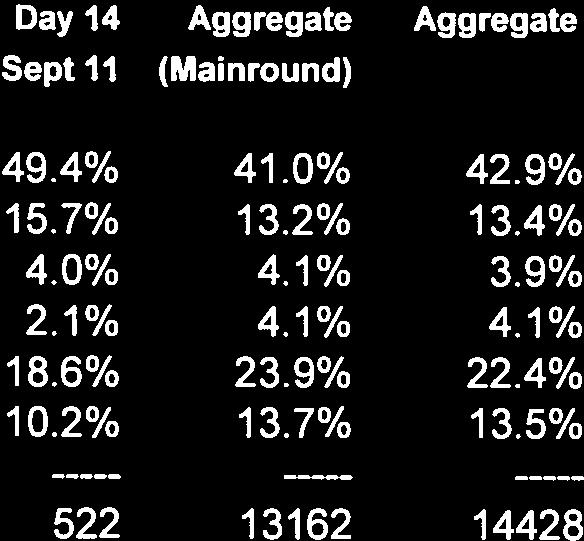
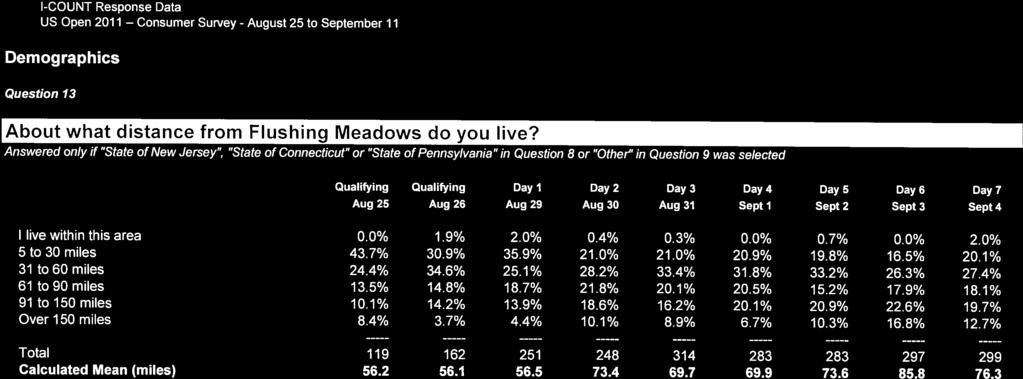
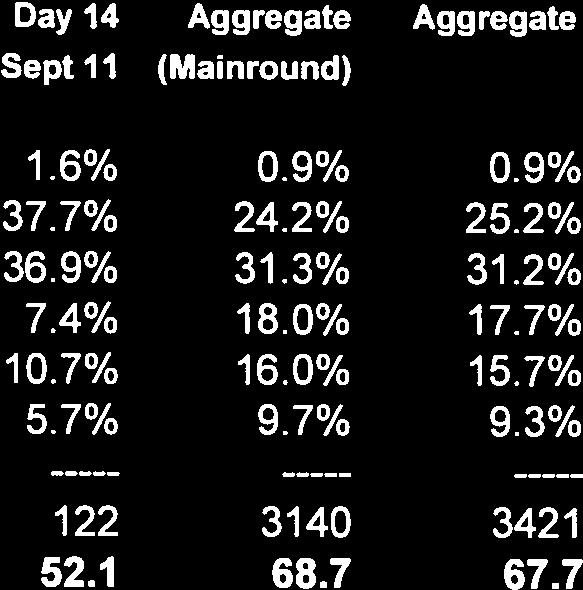
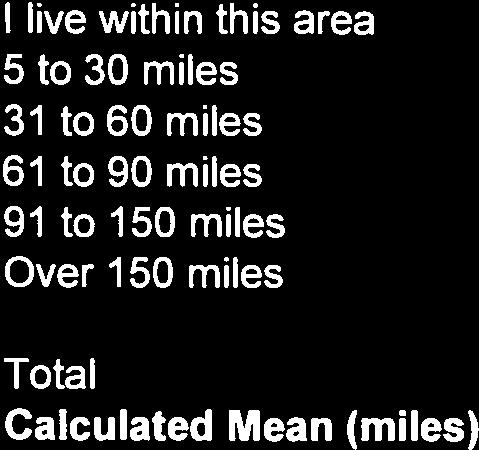
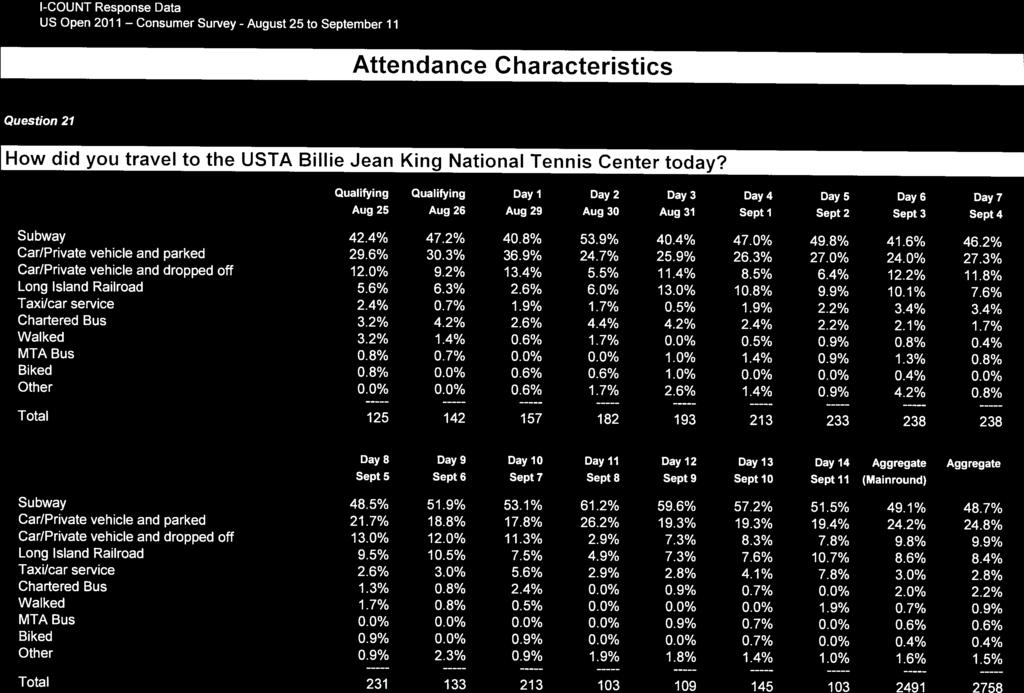
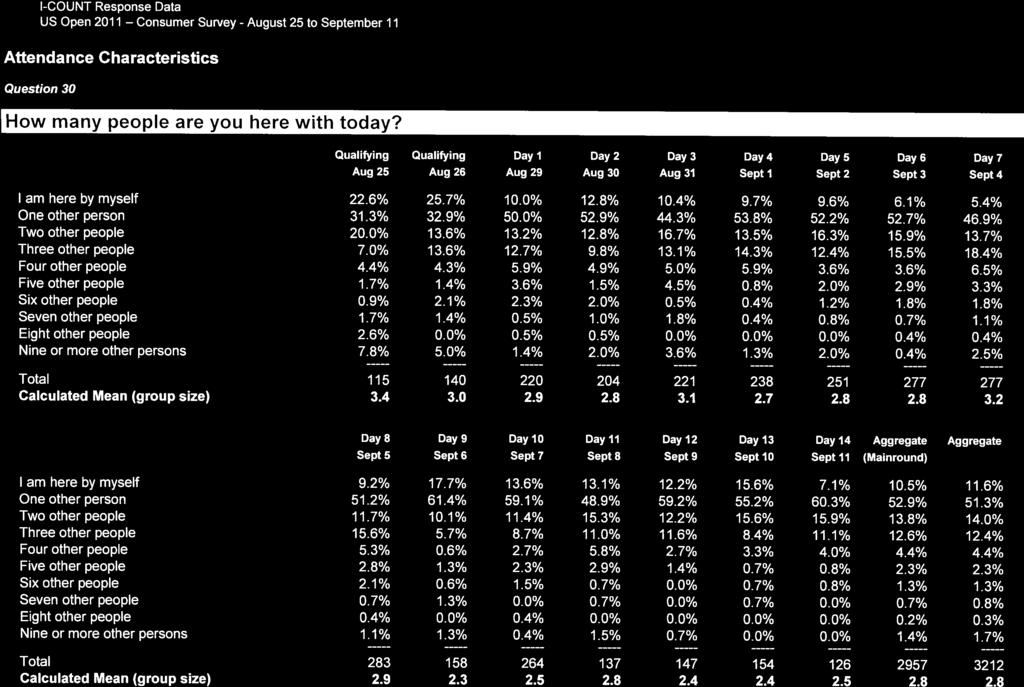
2 2011 PATRON SURVEYS


3


4
5
6
7 VISSIM MODEL CALIBRATION AND VALIDATION

8 Environmental and Planning Consultants 440 Park Avenue South 7th Floor New York, NY tel: fax: Memorandum To: Project Files From: Michael Beattie Date: August 9, 2012 Re: USTA Existing VISSIM Model Calibration and Validation cc: The New York City Department of Parks and Recreation with the United States Tennis Association (USTA) will be proposing a number of improvements and modifications to the National Tennis Center (NTC) as part of their NTC Strategic Vision. The NTC is primarily a public recreational facility, except for a two-week period at the end of August and early September, when it hosts the US Open. As part of the study to identify potential impacts due to the increase in day-time visitation, an analysis of the adjacent freeway system was conducted to determine if vehicles would spill back from the freeway to local surface streets. Due to existing congestion on the adjacent freeways and the existing queues created from downstream bottlenecks, traditional analysis of freeway operations are beyond the capabilities of standard traffic operations software (i.e. Highway Capacity Software). Therefore, a VISSIM model representing a weekday PM peak hour (6:00-7:00 PM) was developed to quantify the potential impacts generated by an increase in the volume of patrons departing the day-time session at the US Open. Figure 1 presents the extents of the VISSIM model. VISSIM micro-simulation software provides the capability to model complex interchange configurations and merge/diverge areas that operate at capacity that other traditional software packages are not able to analyze. Output from the VISSIM model provides the ability to quantify the operational impacts of queuing from downstream bottlenecks. The VISSIM micro-simulation model can also provide a three dimensional representation of these interactions within the study area. For this application, the VISSIM model was used to determine the back of queue length within the study area for a one-hour peak condition. EXISTING CONDITIONS DEVELOPMENT AND CALIBRATION The main objective of model calibration is to ensure that the model accurately reflects special event traffic conditions experienced on the date of the survey. This includes reasonably replicating traffic flow to match observed operating conditions, volume data and queue observations. AKRF, Inc. New York City Hudson Valley Region Long Island Baltimore / Washington Area New Jersey Connecticut
9 Project Files 2 August 9, 2012 Lane geometries (lane widths, interchange designs, etc.) were coded into the model based on field observations and existing aerials. Existing counts collected during the opening week of the US Open were also coded into the model in 15-minute intervals. During calibration of a VISSIM model, individual components are adjusted to match field-observed data. Calibration involves setting background traffic operation and driver behavior characteristics including yielding right-of-way, gap acceptance, driver aggressiveness, and vehicle characteristics. The default values were adjusted during this process so that the model would accurately reflect observed conditions. Adjusted default values and other refinements made to calibrate/validate the VISSIM model are described below: At Long Island Expressway (LIE) off-ramp and College Point on-ramp merge, while stripped as a three lane to two lane merge, based on field observations this section acts as a three lane section. Adjusted CC1 (Headway Time) factor on LIE/College Point merge from default 0.9 seconds to 0.65 seconds to replicate field conditions Adjusted CC1 (Headway Time) factor on between LIE/College Point collector-distributor road between Grand Central Parkway loop ramps from default 0.9 seconds to 0.65 seconds to replicate field conditions Adjusted CC1 (Headway Time) factor on Grand Central Parkway collector-distributor road from default 0.9 seconds to 0.65 seconds to replicate field conditions Since the VISSIM model output is based on the random arrival of vehicles, multiple runs were required to provide a reasonable level of statistical accuracy and validity. Ten separate model runs utilizing random seeds were averaged to determine the final performance measures. The VISSIM model was calibrated and validated to 6:00-7:00 PM existing conditions based on traffic volumes and observed vehicle queues. During this process, the model was visually inspected to ensure that it reflected observed conditions. FREE FLOW TRAVEL SPEEDS Table 1 presents the free-flow travel speed ranges for passenger vehicles and trucks coded into the VISSIM model. Location Free Flow Speed (MPH) Passenger Cars Trucks Grand Central Parkway Collector-Distributor Roads Loop Ramps Direct Ramps Perimeter Road Table 1 Free Flow Speeds MODEL VALIDATION During validation, the VISSIM model output is compared against field data to determine if the output is within acceptable levels. The following criteria, based on the Guidelines for Applying Traffic Microsimulation Modeling Software Volume III (Federal Highway Administration, 2003) were used for the model calibration:
10 Project Files 3 August 9, 2012 Hourly Flows, VISSIM Model vs. Field Counts Individual Link Flows Within 15% for 700 vph < Flow < 2,700 vph >85% of Cases Within 100 vph, for Flow < 700 vph >85% of Cases Within 400 vph, for Flow > 2,700 vph >85% of Cases GEH Statistic GEH < 5 > 85% of Cases The GEH statistic is computed as follows: GEH = 2 ( V C) ( V + C) / 2 where: GEH = The statistic V = model estimated directional hourly volume at a location. C = directional hourly count at a location. The results from the VISSIM analysis are summarized Table 2. This table presents the field counts and the resulting VISSIM simulated volumes. This table shows that the VISSIM model is successfully meeting the calibration criteria for the model area. Table 2 Volume Comparison Location Field Counts VISSIM Difference 1 Percent Served 2 GEH Meets Criteria? College Point on-ramp to Horace Harding Expressway 1, % 0.0 YES LIE off-ramp to Horace Harding Expressway 1, % 0.5 YES Horace Harding Expressway to Grand Central Parkway (GCP) westbound direct ramp % 0.7 YES GCP westbound to loop ramp service road 1, % 0.3 YES Horace Harding Expressway to GCP east loop ramp % 0.3 YES GCP service road westbound at loop ramp % 0.1 YES GCP mainline westbound at loop ramps 3, % 0.0 YES GCP westbound on-ramp from Horace Harding Expressway 1, % 0.9 YES GCP westbound off-ramp to Exit 9P USTA % 1.9 YES GCP westbound mainline at off-ramp to Exit 9P USTA 4, % 0.1 YES GCP westbound mainline (after split) 2, % 0.3 YES GCP westbound service road (after split) 1, % 0.0 YES GCP westbound on-ramp from Exit 9P % 0.6 YES Notes: Average of ten simulation runs. 1. Difference = Field Counts VISSIM 2. Percent Served = (Field Counts VISSIM) / Field Counts In addition to validating the model to field counts, the simulation was checked to demonstrate queuing that is consistent with the field observations. During the 6:00 PM to 7:00 PM peak period, the Grand
11 Project Files 4 August 9, 2012 Central Parkway westbound off-ramp to Exit 9P was observed to queue back to the GCP mainline, growing throughout the peak hour. By the end of the peak hour (around 7:00 PM), the queue from the Exit 9P exit ramp extended to the Horace Harding Expressway. The VISSIM model replicated this queue length during the simulation, with queues from the Exit 9P offramp extending through the peak hour, spilling back onto the Horace Harding Expressway and back to the College Point Boulevard and LIE approaches at the end of the simulation peak hour.
OR 217,I-5 Experience Portland, OR
 OR 217,I-5 Experience Portland, OR By: Abby Caringula Parsons Brinckerhoff July 8th, 2011 Presentation Outline Background VISUM Network Adjustment Model Origin-Destination(O-D) Demand Development ANM Export
ENHANCED PARKWAY STUDY: PHASE 3 REFINED MLT INTERSECTION ANALYSIS
 ENHANCED PARKWAY STUDY: PHASE 3 REFINED MLT INTERSECTION ANALYSIS Final Report Prepared for Maricopa County Department of Transportation Prepared by TABLE OF CONTENTS Page EXECUTIVE SUMMARY ES-1 STUDY
The negative effects of homogeneous traffic on merging sections
 The negative effects of homogeneous traffic on merging sections J.A.C.M. Elbers a,1 and E.C. van Berkum a a Centre for Transport Studies University of Twente, Department of Civil Engineering Tel: +31 534893821,
National Roundabout Conference 2005 DRAFT High-Capacity Roundabout Intersection Analysis: Going Around in Circles David Stanek, PE & Ronald T. Milam,
 High-Capacity Roundabout Intersection Analysis: Going Around in Circles David Stanek, PE & Ronald T. Milam, AICP TRB National Roundabout Conference May 24, 2005 Vail, CO Presentation Overview What is a
Final Report. Interstate-680 Bus-on-Shoulder Feasibility Assessment. prepared for
 Final Report Interstate-680 Bus-on-Shoulder Feasibility Assessment prepared for Metropolitan Transportation Commission & Contra Costa Transportation Authority prepared by HDR in association with Fehr &
Traffic Impact Analysis Shotwell Road Residential Clayton, NC
 Shotwell Road Residential Clayton, NC TABLE O CONTENTS 1. INTROUCTION...1 1.1. Site Location and Study Area...1 1.2. Proposed Land Use and Site Access...2 1.3. Adjacent Land Uses...2 1.4. Existing Roadways...2
ESTIMATING PARAMETERS FOR MODIFIED GREENSHIELD S MODEL AT FREEWAY SECTIONS FROM FIELD OBSERVATIONS
 0 ESTIMATING PARAMETERS FOR MODIFIED GREENSHIELD S MODEL AT FREEWAY SECTIONS FROM FIELD OBSERVATIONS Omor Sharif University of South Carolina Department of Civil and Environmental Engineering 00 Main Street
SIMULATION AND ANALYSIS OF ARTERIAL TRAFFIC OPERATIONS ALONG THE US 61 CORRIDOR IN BURLINGTON, IOWA FINAL REPORT
 SIMULATION AND ANALYSIS OF ARTERIAL TRAFFIC OPERATIONS ALONG THE US 61 CORRIDOR IN BURLINGTON, IOWA FINAL REPORT Principal Investigator Tom Maze Principal Contributor Ali Kamyab Sponsored by the Engineering
VARIATIONS IN CAPACITY AND DELAY ESTIMATES FROM MICROSCOPIC TRAFFIC SIMULATION MODELS
 VARIATIONS IN CAPACITY AND DELAY ESTIMATES FROM MICROSCOPIC TRAFFIC SIMULATION MODELS (Transportation Research Record 1802, pp. 23-31, 2002) Zong Z. Tian Associate Transportation Researcher Texas Transportation
ROADWAY LIGHTING CURFEW
 STATE OF RHODE ISLAND AND PROVIDENCE PLANTATIONS Rhode Island Department of Transportation ROADWAY LIGHTING CURFEW IMPLEMENTATION PLAN March 25, 21 TABLE OF CONTENTS INTRUDUCTION/OVERVIEW... 1 1.1. ANTICIPATED
Rutgers Interactive Lane Closure Application (RILCA) for Work Zone Planning User Manual. New Jersey Highway Authority. Garden State Parkway
 for Work Zone Planning User Manual. New Jersey Highway Authority. Garden State Parkway") Rutgers Interactive Lane Closure Application (RILCA) for Work Zone Planning User Manual Prepared for Garden State Parkway New Jersey Highway Authority April 2007 Developed by: Rutgers University Intelligent
Rutgers Interactive Lane Closure Application (RILCA) for Work Zone Planning User Manual Prepared for Garden State Parkway New Jersey Highway Authority April 2007 Developed by: Rutgers University Intelligent
ITS Canada Annual Conference and General Meeting. May 2013
 Evaluation of Travel Time Data Collection Technologies: An Innovative Approach for a Large- Scale Network ITS Canada Annual Conference and General Meeting May 2013 Study Steps Obtain the traffic data from
Bellevue s Traffic Adaptive Signals
 What we ll cover Bellevue s Traffic Adaptive Signals SCATS Phase 1 Implementation SCATS Operations Responsiveness New Features Some Initial Results 2011 Program and Beyond Final Thoughts ITE Quad Mtg April
APPENDIX D. Traffic Impact Analysis
 APPENDIX D Traffic Impact Analysis TRAFFIC IMPACT ANALYSIS CALEXICO SOLAR FARM I County of Imperial, California July 8, 2011 LLG Ref. 3-11-2034 Prepared by: Cara Leone Transportation Planner II Under the
2/4/2008 S:\TRAFFIC\Modeling\01 Support Materials\Documents\CORSIMcal.doc CORSIM Calibration Parameters
 Last Revision: July 8, 00 The CORSIM model is a microscopic simulation model that uses car following theory based on vehicle headways. Thus the calibration parameters are related to both vehicle and driver
An Analysis of TDM Impacts on a Corridor Segment Research Findings
 An Analysis of TDM Impacts on a Corridor Segment Research Findings Phil Winters, CUTR TDM Program Director Liren Zhou, Graduate Research Assistant Sachin Rai, ITS Research Associate Nevine Georggi, TDM
PERFORMANCE EVALUATION OF MOHAKHALI FLYOVER BY USING VISSIM SIMULATION SOFTWARE
 PERFORMANCE EVALUATION OF MOHAKHALI FLYOVER BY USING VISSIM SIMULATION SOFTWARE M. S. Mamun *, S. Mohammad, M. A. Haque & M. Y. A. Riyad Department of Civil Engineering, Ahsanullah University of Science
CORSIM User's Guide. Version 6.0
 CORSIM User's Guide Version 6.0 Prepared by: ITT Industries, Inc., Systems Division ATMS R&D and Systems Engineering Program Team P O Box 15012 Colorado Springs, CO 80935-5012 Prepared for: FHWA Office
An Analysis of TDM Impacts on a Corridor Segment
 An Analysis of TDM Impacts on a Corridor Segment Phil Winters, CUTR TDM Program Director Liren Zhou, Graduate Research Assistant Sachin Rai, ITS Research Associate Nevine Georggi, TDM Research Associate
An Integrated Model for Planning and Traffic Engineering
 Ninth TRB Planning Methods Applications Conference Baton Rouge, Louisiana, April 2003 An Integrated Model for Planning and Traffic Engineering Wolfgang Scherr, Innovative Transportation Concepts, Inc.,
Application of Reinforcement Learning with Continuous State Space to Ramp Metering in Real-world Conditions
 Application of Reinforcement Learning with Continuous State Space to Ramp Metering in Real-world Conditions Kasra Rezaee, Member, IEEE, Baher Abdulhai, Member, IEEE, and Hossam Abdelgawad Abstract In this
OPTIMAL MERGE LAYOUT ARRANGEMENTS FOR THE M50: A MICROSIMULATION MODELLING APPROACH
 Proceedings O BRIEN and DUNNY: Optimal Merge Layouts OPTIMAL MERGE LAYOUT ARRANGEMENTS FOR THE M50: A MICROSIMULATION MODELLING APPROACH Dr Liam O Brien Senior Consultant, Transportation AECOM Mr Shane
Ioannis Psarros Department of Civil Engineering and Intermodal Freight Transportation Institute, Memphis, TN
 Ioannis Psarros Department of Civil Engineering and Intermodal Freight Transportation Institute, Memphis, TN CIVL 7904/8904: Traffic Flow Theory (Spring 2014) April 5, 2014 Transportation Research Increased
CIE4801 Transportation and spatial modelling Beyond the 4-step model
 CIE4801 Transportation and spatial modelling Beyond the 4-step model Erik de Romph, Transport & Planning 31-08-18 Delft University of Technology Challenge the future Multi disciplinary 2 Contents Input
Calipatria Solar Farm TIA
 Calipatria Solar Farm TIA Prepared for: 7SM 8ME, LLC 71SM 8ME, LLC c/o 8minutenergy Renewables LLC Prepared by: Fehr & Peers March 25, 211 IE1-37 TABLE OF CONTENTS Executive Summary... i Project Trip Estimates...
STUDY REPORT #1 ADDENDUM
 STUDY REPORT #1 ADDENDUM 1.0 PURPOSE OF ADDENDUM This document is an addendum to Study Report #1: Sub-System Planning Alternatives. The purpose of this addendum is to bridge the gap between the initial
Bluetooth Travel Time Technology Evaluation Using the BlueTOAD TM
 Bluetooth Travel Time Technology Evaluation Using the BlueTOAD TM E01271 PennDOT District 6-0 ITS & Support Open End Contract Work Order #1 Submitted To: Pennsylvania Department of Transportation Engineering
Addendum: Final Design Noise Analysis Study Noise Sensitive Area (NSA) 11 Post March 15, 2016 Open House Response to Comments
 11 Post March 15, 2016 Open House Response to Comments") Final Design Township of Lower Makefield, Bucks County, Pennsylvania Township of Ewing, Mercer County, New Jersey Addendum: Final Design Noise Analysis Study Noise Sensitive Area (NSA) 11 Post March 15,
Final Design Township of Lower Makefield, Bucks County, Pennsylvania Township of Ewing, Mercer County, New Jersey Addendum: Final Design Noise Analysis Study Noise Sensitive Area (NSA) 11 Post March 15,
research report Evaluation of Driver Reactions for Effective Use of Dynamic Message Signs in Richmond, Virginia
 Final Report VTRC 10-R16 Virginia Transportation Research Council research report Evaluation of Driver Reactions for Effective Use of Dynamic Message Signs in Richmond, Virginia http:/www.virginiadot.org/vtrc/main/online_reports/pdf/10-r16.pdf
An Assessment of Congestion in the Kansas City Region using the MARC Travel Demand Model
 An Assessment of Congestion in the Kansas City Region using the MARC Travel Demand Model The Congestion Management Process Federal Regulations state that all metropolitan planning organizations must carry
Validation of Simulation Models Using Vehicle Trajectories. TRB Annual Meeting January 11, 2015
 Validation of Simulation Models Using Vehicle Trajectories TRB Annual Meeting January 11, 2015 1 Overview Project Objectives and the Project Team State of Practice for Aggregate Calibration Trajectory
Traffic Impact Study for the TAVA Homes Project at 1584 East Santa Clara Avenue in the City of Santa Ana
 Traffic Impact Study for the TAVA Homes Project at 1584 East Santa Clara Avenue in the City of Santa Ana March 2011 Prepared for: URS Corporation 2020 E. First Street, Suite #400 Santa Ana, CA 92705 Tel:
Study Area and Location District PSA Ward ANC Phase Description A Proposed I-395 Southwest after Exit 4, Eastbound
 Speed Limit and Safety Nexus Studies for Automated Enforcement Locations in the District of Columbia I-395 SW after Exit 4 E/B Study Area and Location District PSA Ward ANC Phase Description 1 71 8 8A
Speed Limit and Safety Nexus Studies for Automated Enforcement Locations in the District of Columbia Inside Southern part of 3rd Street Tunnel
 Speed Limit and Safety Nexus Studies for Automated Enforcement Locations in the District of Columbia Inside Southern part of 3rd Street Tunnel Study Area and Location District PSA Ward ANC Phase Description
Speed Limit and Safety Nexus Studies for Automated Enforcement Locations in the District of Columbia DC Miles South of Pennsylvania Avenue SE
 Speed Limit and Safety Nexus Studies for Automated Enforcement Locations in the District of Columbia DC 295.4 Miles South of Pennsylvania Avenue SE Study Area and Location District PSA Ward ANC Phase Description
Optimization of the ALINEA Ramp-metering Control Using Genetic Algorithm with Micro-simulation
 Paper # 03-4400 Optimization of the ALINEA Ramp-metering Control Using Genetic Algorithm with Micro-simulation Lianyu Chu California PATH, ATMS Center Institute of Transportation Studies University of
Appendix D. Transportation Study
 Appendix D Transportation Study Draft KUNZLER TERRACE MINE PROJECT Transportation Study Prepared for May 29 County of Mendocino Draft KUNZLER TERRACE MINE PROJECT Transportation Study Prepared for May
Creating transportation system intelligence using PeMS. Pravin Varaiya PeMS Development Group
 Creating transportation system intelligence using PeMS Pravin Varaiya PeMS Development Group Summary Conclusion System overview Routine reports: Congestion monitoring, LOS Finding bottlenecks Max flow
Traffic Safety Facts Research Note
 Traffic Safety Facts Research Note DOT HS 80 963 June 2008 Driver Electronic Device Use in 2007 Hand-held cell phone use by drivers was up again to 6 percent in 2007 compared to 5 percent in 2006, and
195 Hegenberger Road Hotel: Traffic Circulation Analysis in Response to Comments on the Final EIR
 350 Frank H. Ogawa Plaza Suite 300 Oakland, CA 94612 510.839.5066 phone 510.839.5825 fax www.esassoc.com Technical Memorandum date November 12, 2014 to from subject Colleen Liang, Port Associate Environmental
Travel Demand Modeling and Project Coding Procedures
 Travel Demand Modeling and Project Coding Procedures Revised July 2008 As described in the Final Transportation Conformity Rule (section 93.122), travel demand models used to generate emission estimates
vision42
 vision42 www.vision42.org vision4 auto-free light rail 2 boulevard for 42nd Street Roxanne Warren, AIA, Chair George Haikalis, ASCE, Co-Chair Institute for Rational Urban Mobility,Inc. www.vision42.org
Speed Limit and Safety Nexus Studies for Automated Enforcement Locations in the District of Columbia East Capitol Street at Southern Avenue NE
 Speed Limit and Safety Nexus Studies for Automated Enforcement Locations in the District of Columbia East Capitol Street at Southern Avenue NE Study Area and Location District PSA Ward ANC Phase Description
Using GPS Based Origin-Destination Data to Improve Traffic Studies. Michael R. Wahlstedt, PE, PTOE OTEC October 11, 2017
 Using GPS Based Origin-Destination Data to Improve Traffic Studies Michael R. Wahlstedt, PE, PTOE OTEC October 11, 2017 Overview Benefits of using O-D data for traffic analysis, particularly for operational
Arterial data quality and traffic estimation
 Arterial data quality and traffic estimation Qijian Gan Postdoctoral Researcher PATH University of California, Berkeley qgan@berkeley.edu 10th SF Bay Area ITE Annual Workshop May 2nd, 2018 Outline Introduction
Treating Potential Back- of-queue Safety. Developed By:
 Treating Potential Back- of-queue Safety Hazards Developed By: 1 Module Objectives Discuss the hazards associated with queuing caused by work zones Describe steps to quantify work zone impacts, determine
Traffic Impact Analysis
 LA PALMA VILLAGE INITIAL STUDY CITY OF ANAHEIM Appendices Appendix I Traffic Impact Analysis September 2015 LA PALMA VILLAGE INITIAL STUDY CITY OF ANAHEIM Appendices This page intentionally left blank.
M50 Demand Management Study
 Study Briefing paper to the Strategic Policy Committees (Transport) of : Dun Laoghaire Rathdown County Council, Dublin City Council Fingal County Council South Dublin Co Council 5 th June 2013 December
McTrans. McByte FLORIDA UNIVERSITY OF. TSIS-CORSIM 6.0 Release is Imminent. Analyzing Congested Signalized Intersections. McTrans
 McTrans M o v i n g T e c h n o l o g y Volume 34 January 2006 Newsletter Analyzing Congested Signalized Intersections TSIS-CORSIM 6.0 Release is Imminent In the typical signalized intersection capacity
Verification Plan: Mitchell Hammock Road. Adaptive Traffic Signal Control System. Prepared by: City of Oviedo. Draft 1: June 2015
 Verification Plan: Mitchell Hammock Road Adaptive Traffic Signal Control System Red Bug Lake Road from Slavia Road to SR 426 Mitchell Hammock Road from SR 426 to Lockwood Boulevard Lockwood Boulevard from
Crystal Springs Upland School Transportation Demand Management Plan. March 2016
 Crystal Springs Upland School Transportation Demand Management Plan March 06 CONTENTS Introduction... Transportation Demand Management (TDM) Program.... Background/Survey of Existing Student Commuting
Travel Time Estimation Using Bluetooth
 Travel Time Estimation Using Bluetooth Ravindra Gudishala Chester Wilmot Aditya Mokkapatti Louisiana State University/Louisiana Transportation Research Center Objectives Estimate Travel Time in order to
SIMULATION OF FREEWAY MERGING AND DIVERGING BEHAVIOR
 Proceedings of the 23 Winter Simulation Conference S. Chick, P. J. Sánchez, D. Ferrin, and D. J. Morrice, eds. SIMULATION OF FREEWAY MERGING AND DIVERGING BEHAVIOR Daiheng Ni School of Civil and Environmental
Study Area and Location District PSA Ward ANC Phase Description D Proposed 1900 Block Foxhall Road Northwest Southbound
 Speed Limit and Safety Nexus Studies for Automated Enforcement Locations in the District of Columbia 19 Block Foxhall Road NW S/B Study Area and Location District PSA Ward ANC Phase Description 2 25 3
Study Area and Location District PSA Ward ANC Phase Description G Proposed 2900 Block Military Road Northwest Eastbound
 Speed Limit and Safety Nexus Studies for Automated Enforcement Locations in the District of Columbia 29 Block Military Road NW E/B Study Area and Location District PSA Ward ANC Phase Description 2 21 3
Using Empirical (real-world) Transportation Data to Extend Travel Demand Model Capabilities
 Transportation Data to Extend Travel Demand Model Capabilities") Portland State University PDXScholar TREC Friday Seminar Series Transportation Research and Education Center (TREC) 10-4-2013 Using Empirical (real-world) Transportation Data to Extend Travel Demand Model
Portland State University PDXScholar TREC Friday Seminar Series Transportation Research and Education Center (TREC) 10-4-2013 Using Empirical (real-world) Transportation Data to Extend Travel Demand Model
Performance Evaluation of Non-Intrusive Methods for Traffic Data Collection. Kamal Banger, Ministry of Transportation of Ontario
 Abstract Performance Evaluation of Non-Intrusive Methods for Traffic Data Collection Kamal Banger, Ministry of Transportation of Ontario Nancy Adriano, P.Eng., Ministry of Transportation of Ontario For
MESO & HYBRID MODELING IN
 MESO & HYBRID MODELING IN www.ptvgroup.com JONGSUN WON, P.E. www.ptvgroup.com I Slide 1 SOMETHING NEW WITH PTV NORTH AMERICA Portland, OR Arlington, VA www.ptvgroup.com I Slide 2 MULTIRESOLUTION MODELING
Operation of Closed Loop Signal Systems
 Operation of Closed Loop Signal Systems Darcy Bullock Associate Professor School of Civil Engineering Purdue University Pre-Conference Proceedings - Page 205 Quantifying the Impact of Traffic Responsive
PARAMICS Plugin Document BOTTLENECK ramp metering control
 PARAMICS Plugin Document BOTTLENECK ramp metering control Lianyu Chu PATH ATMS Center University of California, Irvine Plugin Compatibility: V4 Release date: 3/20/2003 522 Social Science Tower Irvine,
The Practical Side of Cell Phones as Traffic Probes
 The Practical Side of Cell Phones as Traffic Probes The information contained in this document is considered proprietary, and may not be reproduced or redistributed without the consent of Delcan Inc. Cell
TRAFFIC IMPACT ANALYSIS. MIDWAY SOLAR FARM II County of Imperial, California January 11, 2011
 TRAFFIC IMPACT ANALYSIS MIDWAY SOLAR FARM II County of Imperial, California January 11, 2011 LLG Ref. 3-10-2013 Prepared by: Cara Leone Transportation Planner II Under the Supervision of: Chris Mendiara
TRAFFIC FLOW SIMULATION USING CORSIM
 Proceedings of the 2000 Winter Simulation Conference J. A. Joines, R. R. Barton, K. Kang, and P. A. Fishwick, eds. TRAFFIC FLOW SIMULATION USING CORSIM Larry E. Owen Yunlong Zhang Lei Rao Intelligent Transportation
Managing DC Work Zones: DDOT s Citywide Transportation Management Plan
 Managing DC Work Zones: DDOT s Citywide Transportation Management Plan ARTBA National Work Zone Management Conference September 20, 2016 1 Outline Citywide Transportation Management Plan (TMP) Citywide
Site 17 W3-160 KEY: District Department of Transportation 55 M Street, SE, Suite 400 Washington, DC 20003
 Speed Limit and Safety Nexus Studies for Automated Enforcement Locations in the District of Columbia Connecticut Avenue at Calvert Street NW Study Area and Location District PSA Ward ANC Phase Description
Geometric Layout for Roadway Design with CAiCE Visual Roads
 December 2-5, 2003 MGM Grand Hotel Las Vegas Geometric Layout for Roadway Design with CAiCE Visual Roads Mathews Mathai CV32-3 This course describes and demonstrates various tools for defining horizontal
ROARING BROOK COMMUNITY INFORMATIONAL MEETING TACONIC STATE PARKWAY (TSP) AT PUDDING STREET INTERCHANGE
 AT PUDDING STREET INTERCHANGE") ROARING BROOK COMMUNITY INFORMATIONAL MEETING TACONIC STATE PARKWAY (TSP) AT PUDDING STREET INTERCHANGE Town of Putnam Valley, Putnam County February 7, 2018 1 2 MEETING AGENDA Introductions (5 minutes)
ROARING BROOK COMMUNITY INFORMATIONAL MEETING TACONIC STATE PARKWAY (TSP) AT PUDDING STREET INTERCHANGE Town of Putnam Valley, Putnam County February 7, 2018 1 2 MEETING AGENDA Introductions (5 minutes)
Prepared for NEVADA DEPARTMENT OF TRANSPORTATION AND UNIVERSITY TRANSPORTATION RESEARCH CENTER
 Calibration of CORSIM Models under Saturated Traffic Flow Conditions Final Report September 2013 UNLV TRC/UTC Prepared for NEVADA DEPARTMENT OF TRANSPORTATION AND UNIVERSITY TRANSPORTATION RESEARCH CENTER
Dynamic Message Sign Message Design and Display Manual
 Product 0-4023-P1 October 2004 Dynamic Message Sign Message Design and Display Manual Project performed in Cooperation with the Texas Department of Transportation and the Federal Highway Administration
Veirs Mill Road Metrobus Improvements Request to Conduct Public Hearing
 Customer Services, Operations, and Safety Committee Board Information Item III-B September 24, 2009 Veirs Mill Road Metrobus Improvements Request to Conduct Public Hearing Washington Metropolitan Area
Microscopic Simulation Model Calibration and Validation: A Case Study of VISSIM for a Coordinated Actuated Signal System
 Park and Schneeberger 1 Microscopic Simulation Model Calibration and Validation: A Case Study of VISSIM for a Coordinated Actuated Signal System by Byungkyu "Brian" Park, Ph.D.* Research Assistant Professor
Microscopic Traffic Simulation Model Calibration & Validation
 Tutorial: Microscopic Traffic Simulation Model Calibration & Validation June 27, 2006 Instructors: Byungkyu (Brian) Park, Ph.D. Jongsun Won AGENDA Time 9:30 ~ 10:00 10:10 ~ 11:45 11:45 ~ 1:00 1:00 ~ 2:20
FIELD EXPERIMENT TO IDENTIFY POTENTIALS OF APPLYING BLUETOOTH TECHNOLOGY TO COLLECT PASSENGER VEHICLE CROSSING TIMES AT T H E U. S.
 FIELD EXPERIMENT TO IDENTIFY POTENTIALS OF APPLYING BLUETOOTH TECHNOLOGY TO COLLECT PASSENGER VEHICLE CROSSING TIMES AT T H E U. S. -MEXICO BORDER by Rajat Rajbhandari Texas Transportation Institute Project
Fixed Time v Single Stream MOVA Control on a signalled roundabout Helen Simmonite - JCT Consultancy Ltd.
 Does MOVA know best? 391 Fixed Time v Single Stream MOVA Control on a signalled roundabout Helen Simmonite - JCT Consultancy Ltd. In this case study of the Hobby Horse roundabout in Leicester a comparison,
TRACY HILLS SPECIFIC PLAN RECIRCULATED DRAFT SUBSEQUENT ENVIRONMENTAL IMPACT REPORT VOLUME III OCTOBER 2015
 TRACY HILLS SPECIFIC PLAN RECIRCULATED DRAFT SUBSEQUENT ENVIRONMENTAL IMPACT REPORT VOLUME III OCTOBER 2015 APPENDIX H-6B CORRESPONDENCE DOCUMENTS LIVERMORE, DATED FALL 2014 Chau, Elizabeth From: Sent:
Rural Expressway Intersection Characteristics that Contribute to Reduced Safety Performance
 Rural Expressway Intersection Characteristics that Contribute to Reduced Safety Performance Garrett D. Burchett Center for Transportation Research and Education Iowa State University 2901 South Loop Drive,
North Metro Corridor Draft Environmental Impact Statement (DEIS) Public Hearings. December 9 & 10, 2009
 Public Hearings. December 9 & 10, 2009") North Metro Corridor Draft Environmental Impact Statement (DEIS) Public Hearings December 9 & 10, 2009 1 Welcome & Introductions 2 3 What Are We Doing Here Tonight? Public Hearing for RTD North Metro Corridor
North Metro Corridor Draft Environmental Impact Statement (DEIS) Public Hearings December 9 & 10, 2009 1 Welcome & Introductions 2 3 What Are We Doing Here Tonight? Public Hearing for RTD North Metro Corridor
Reinforcement Learning for Adaptive Routing of Autonomous Vehicles in Congested Networks
 Reinforcement Learning for Adaptive Routing of Autonomous Vehicles in Congested Networks Jonathan Cox Aeronautics & Astronautics Brandon Jennings Mechanical Engineering Steven Krukowski Aeronautics & Astronautics
Title: Increasing the stability and robustness of simulation-based network assignment models for largescale
 Title: Increasing the stability and robustness of simulation-based network assignment models for largescale applications Author: Michael Mahut, INRO Consultants Inc. Larger-scale dynamic network models
Prepared for: Rocklin. Prepared by:
 APPENDIX L Sierra Gateway Apartments Transportation Impact Analysis Report Prepared for: Rocklin Sierra Apartments II, LLC Prepared by: SIERRA GATEWAY APARTMENTS TRANSPORTATION IMPACT ANALYSIS REPORT PREPARED
CITY OF KIRKLAND TRAFFIC IMPACT ANALYSIS GUIDELINES
 CITY OF KIRKLAND TRAFFIC IMPACT ANALYSIS GUIDELINES SEPA TRANSPORTATION CONCURRENCY - ROAD IMPACT FEES Introduction Revised February 2004 These guidelines describe how to prepare a traffic study, or Traffic
A. INTRODUCTION B. PRINCIPAL CONCLUSIONS AND IMPACTS C. METHODOLOGY
 Chapter 15: Safety and Security A. INTRODUCTION This chapter discusses safety and security as they relate to the Proposed Project and summarizes how potential safety and security issues are identified
LAWRENCE-DOUGLAS COUNTY INTELLIGENT JOURNEY
 LAWRENCE-DOUGLAS COUNTY INTELLIGENT JOURNEY L-DC REGIONAL ITS ARCHITECTURE AND STRATEGIC DEPLOYMENT PLAN EXECUTIVE SUMMARY The Lawrence-Douglas County Metropolitan Planning Organization (L- DC MPO) has
Speed Limit and Safety Nexus Studies for Automated Enforcement Locations in the District of Columbia 1100 Block 4th Street NE
 Speed Limit and Safety Nexus Studies for Automated Enforcement Locations in the District of Columbia 11 Block 4th Street NE Study Area and Location District PSA Ward ANC Phase Description 1 14 6 6C Proposed
EVALUATION OF THE EFFECT OF VMS IN REDUCING CONGESTION USING AIMSUN TOOL: A CASE STUDY OF ARTERIAL ROAD NETWORKS WITHIN THE CBD OF KADUNA
 DOI: http://dx.doi.org/10.7708/ijtte.2016.6(2).09 UDC: 656.1:519.872(669) EVALUATION OF THE EFFECT OF VMS IN REDUCING CONGESTION USING AIMSUN TOOL: A CASE STUDY OF ARTERIAL ROAD NETWORKS WITHIN THE CBD
November 28, 2012 ALTERNATIVES ANALYSIS PUBLIC MEETING
 November 28, 2012 ALTERNATIVES ANALYSIS PUBLIC MEETING Project Background Description of the Project Alternatives Analysis Process Project Progress Activity Stations Comments Adjourn 2 VIA spent 2 years
Understanding the Potential for Video Analytics to Support Traffic Management Functions
 Understanding the Potential for Video Analytics to Support Traffic Management Functions Project Summary Slides November 2014 ENTERPRISE Program Program Goals Facilitate rapid progress in the development
PROJECT TIMELINE. Next steps. Plan. Start of Service
 PROJECT TIMELINE 2018 2019 2020 2021 2022 2023 WE ARE HERE Plan Develop Build Develop design options for termini, station locations, and transit operations Conduct environmental research Assess funding
Opening the New Woodrow Wilson Memorial Bridge: Planning & Implementing a Major Traffic Switch
 Opening the New Memorial : Planning & Implementing a Major Traffic Switch Scott C. Crumley, P.E., P.T.O.E. Manager March 26, 2009 1 Agenda Background The Major Milestone: Opening the New to Traffic Challenges
CASE 1 TWO LANE TO FOUR LANE DIVIDED TRANSITION GEO-610-C NOT TO SCALE GEOMETRIC DESIGN GUIDE FOR MATCH LINE LINE MATCH. 2 (0.6m) shoulder transition
 shoulder transition") CASE 1 2 (0.6m) Joint Line See sheet #5 for description of variables 4 (1.2m) Transition taper is tangent to Edge of Pavement curve at this point. 1:25 Paved shoulder transition 16 (4.m) Median width 16
CASE 1 2 (0.6m) Joint Line See sheet #5 for description of variables 4 (1.2m) Transition taper is tangent to Edge of Pavement curve at this point. 1:25 Paved shoulder transition 16 (4.m) Median width 16
STRATHCONA AREA TRANSMISSION UPGRADE PROJECT
 STRATHCONA AREA TRANSMISSION UPGRADE PROJECT September 2017 ProjeCt InFormation You are receiving this information because you are a landowner, resident, business owner, or occupant of property near a
Comparison study of the prevalence of cell phone use while driving in the City of Victoria, British Columbia
 Final Report Comparison study of the prevalence of cell phone use while driving in the City of Victoria, British Columbia A final report on the research project surveying the number of drivers using a
Deployment of ITS Projects in Pasadena A Local Agency Perspective
 Deployment of ITS Projects in Pasadena A Local Agency Perspective ITS California Annual Meeting October 2, 2013 Norman Baculinao, PE Pasadena and the Region Source: Census Transportation Planning Package,
SH 288 Express Lanes Stated Preference Survey Report. Appendix A: Survey Questionnaire
 SH 288 Express Lanes Stated Preference Survey Report Appendix A: Survey Questionnaire DATA ANALYSIS SOLUTIONS TABLE OF CONTENTS 1.0 INSTRUCTIONS... 1 2.0 SCREENER AND TRIP CHARACTERISTIC QUESTIONS... 2
Study Area and Location District PSA Ward ANC Phase Description C Existing 3500 Block Massachusetts Avenue Northwest Eastbound
 Speed Limit and Safety Nexus Studies for Automated Enforcement Locations in the District of Columbia 35 Block Massachusetts Avenue NW Study Area and Location District PSA Ward ANC Phase Description 2 24
Recipients of C-TRAN Solicitation # Farebox System Enhancement
 TO: Recipients of C-TRAN Solicitation #2013-10 Farebox System Enhancement DATE: SUBJECT: Addendum #3 C-TRAN is extending the proposal due date to August 15, 2013 by 11:00 a.m. Proposers must refer to Addendum
Executive Summary. City of Goodyear. Prepared for: Prepared by: November, 2008 Copyright 2008, Kimley-Horn and Associates, Inc.
 Goodyear Intelligent Transportation Systems Strategic Plan Executive Summary Prepared for: City of Goodyear Prepared by: 191376000 Copyright 2008, Kimley-Horn and Associates, Inc. I. INTRODUCTION The City
PART 2. SIGNS Chapter 2L. Changeable Message Signs
 PART 2. SIGNS Chapter 2L. Changeable Message Signs TABLE OF CONTENTS Chapter 2L. CHANGEABLE MESSAGE SIGNS Page Section 2L. Description of Changeable Message Signs.................................... 2L-
ANALYZING AND COMPARING TRAFFIC NETWORK CONDITIONS WITH A QUALITY TOOL BASED ON FLOATING CAR AND STATIONARY DATA
 15th World Congress on Intelligent Transport Systems ITS Connections: Saving Time, Saving Lives New York, November 16-20, 2008 ANALYZING AND COMPARING TRAFFIC NETWORK CONDITIONS WITH A QUALITY TOOL BASED
Anatomy of tunnel congestion: causes and implications for tunnel traffic management. SE Stockholm, Sweden. Boston, MA 02115
 1 2 3 4 5 6 7 8 9 10 11 12 13 14 15 16 17 18 19 20 21 22 23 24 25 26 27 28 29 30 31 32 33 34 35 36 37 Anatomy of tunnel congestion: causes and implications for tunnel traffic management Athina Tympakianaki