TRACE32 Training... Training Hexagon-ETM... Hexagon-ETM Training... 1
|
|
|
- Bethany Horn
- 5 years ago
- Views:
Transcription
1 Hexagon-ETM Training TRACE32 Online Help TRACE32 Directory TRACE32 Index TRACE32 Training... Training Hexagon-ETM... Hexagon-ETM Training... 1 Introduction Hexagon ETM... 4 Off-chip Trace Port 4 TRACE32 Hardware Configuration 5 Trace Display/Evaluation for All Hardware Threads in Common 7 Trace Display/Evaluation for a Single Hardware Thread 8 Basic Start-Up Sequence 9 Cycle-Accurate Tracing 13 On-chip Trace 16 TRACE32 Hardware Configuration 17 Trace Display/Evaluation for All Hardware Threads in Common 18 Trace Display/Evaluation for a Single Hardware Thread 19 Basic Start-up Sequence 20 Cycle-Accurate Tracing 22 Specifying the Trace Method 23 Trace Method Analyzer 24 Trace Method Onchip 26 FLOW ERROR 28 Description 28 Diagnosis 29 TARGET FIFO OVERFLOW 31 Description 31 Diagnosis 32 ETM Based Real-Time Breakpoints Introduction 34 TRACE32 Hardware Configuration 34 Requirements 35 Hint 35 Breakpoint Usage 36 Complex Program Breakpoints 36 Complex Data Breakpoints 42 Combining Program and Data Breakpoints 48 Hexagon-ETM Training 1
2 Saving the Breakpoint Settings as a PRACTICE Script 53 Displaying the Trace Contents Fundamentals 54 Display Commands 56 Correlating Different Trace Displays 59 Correlating the Trace Display and the Source Code 60 Default Display Items 61 Additional Display Items 74 ASID and TID 74 TIme.Zero 75 ETM Packets 76 Formatting the Trace Display 77 Changing the DEFault Display 79 The AutoInit Option 80 Searching in the Trace 81 Belated Trace Analysis 83 ASCII File 84 TRACE32 Instruction Set Simulator 85 Export the Trace Information as ETMv3 Byte Stream 88 Function Run-Times Analysis Flat vs. Nesting Analysis 90 Basic Knowledge about the Flat Analysis 90 Basic Knowledge about the Nesting Analysis 91 Summary 92 Flat Analysis 93 Dynamic Program Behavior (no OS and OS) 93 Function Timing Diagram (no OS or OS) 99 Hot-spot Analysis (no OS or OS) 106 Nesting Analysis 112 Fundamentals 112 Analysis Details (no OS) 117 Cycle Statistic Filtering via the ETM Configuration Window Hardware Thread Filter 131 Software Thread Filter 132 ASID Filter 132 Filtering/Triggering with Break.Set TraceEnable Filter 135 Standard Usage 135 Statistical Evaluations 141 TraceON/OFF Filter 143 TraceTrigger 147 Hexagon-ETM Training 2
3 Filtering/Triggering via the ETM.Set The ETM Registers 156 Actions Based on Sequencer Level 158 Actions Based on Sequencer Level and Condition 162 Benchmark Counters Introduction 166 Standard Examples 168 Function Run-time Analysis - Cache Misses/Stalls 179 Summary: Trigger and Filter Appendix A The Calibration of the Recording Tool 183 Calibration Problems 185 Hexagon-ETM Training 3
4 Hexagon-ETM Training Version 22-Mar-2018 Introduction Hexagon ETM The Hexagon ETM can export trace information Off-chip via dedicated pins for recording by TRACE32 PowerTrace. To the on-chip trace memory called ETB (Embedded Trace Buffer). The ETB has a size of 2 KB and can store 512 entries, each 32-bits wide. The Hexagon is using the ETMv3 protocol. Off-chip Trace Port The trace information exported by the Hexagon ETM is captured by TRACE32 and recorded into the trace memory of the PowerTrace hardware. The trace memory within the PowerTrace is maintained by the TRACE32 command group Analyzer.<subcommand>. Hexagon Hexagon execution core ETM triggering and filtering compression and packetization TRACEDATA[0..n-1] JTAG ETM configuration TRACECTL TRACECLK Hexagon-ETM Training 4

5 TRACE32 Hardware Configuration The following TRACE32 hardware is required to record and analyze trace information exported off-chip: POWER TRACE / ETHERNET DEBUG CABLE PREPROCESSOR PREPROCESSOR DEBUG CABLE POWER TRACE / ETHERNET Hexagon-ETM Training 5

6 POWER DEBUG II and POWER TRACE II DEBUG CABLE PREPROCESSOR POWER DEBUG II DEBUG CABLE PREPROCESSOR POWER TRACE II Hexagon-ETM Training 6
7 Trace Display/Evaluation for All Hardware Threads in Common The trace memory within the PowerTrace contains trace information for all hardware threads Trace packet from hardware thread 1 Trace packet from hardware thread 1 Trace packet from hardware thread 2 Trace packet from hardware thread 3 Trace packet from hardware thread 5 Trace packet from hardware thread 5 Trace packet from hardware thread 4 Trace packet from hardware thread 2 Trace packet from hardware thread 2 Trace packet from hardware thread 0 Trace packet from hardware thread 0 Trace packet from hardware thread 0 The Analyzer.List command displays the trace information for all hardware threads. Analyzer.List ; Display a trace listing for ; all hardware threads Hexagon-ETM Training 7
8 Trace Display/Evaluation for a Single Hardware Thread Alternatively TRACE32 provides the possibility to display/evaluate the trace information for a single hardware thread via the option /CORE <number>. Analyzer.<subcommand> /CORE 0 Analyzer.<subcommand> /CORE 1 etc. Analyzer.List /CORE 0 ; Display a trace listing for ; hardware thread 0 Hexagon-ETM Training 8

9 Basic Start-Up Sequence The aim of the following start-up sequence is: To set up the ETM to export a maximum of trace information (full trace port width, maximum trace speed) To configure the TRACE32 recording tool for an error-free recording TRACE32 provides the following commands for enabling the ETM: PER.Set.simple <address> [<format>] <value> Data.Set <address> [<format>] <value> Starting-up the ETM requires the following steps: 1. Enable the ETM. Enabling the ETM is done by writing to memory-mapped configuration registers. For details, refer to your Hexagon manual. ; Write the 32-bit value 0x in little endian mode to the ; configuration register at address 0xA PER.Set.simple 0xA %LE %Long 0x2 ; Write the 32-bit value 0x in little endian mode to the ; address 0xA Data.Set 0xA %LE %Long 0x1 2. Enable the trace port pins for your target hardware. Enabling the trace port pins for the ETM is done by likewise writing to memory-mapped configuration registers. Refer to your Hexagon manual for details. 3. Select Analyzer as TRACE32 trace method. Select trace method Analyzer Trace.METHOD Analyzer ; Default if a TRACE32 pre- ; processor hardware is ; connected (see page 4) Hexagon-ETM Training 9
10 This setting informs TRACE32 that you want to use off-chip tracing. 4. Define the ETM port size for the off-chip tracing. By defining the ETM port size you inform TRACE32 how many TRACEDATA pins are used on your target hardware to export the trace packets. Please refer to your target hardware s schematics to get the number of TRACEDATA pins. 5. Define the ETM port mode for the off-chip tracing. By defining the ETM port mode you inform TRACE32 about the TRACECLK (trace clock). Please refer to your target hardware description for the trace clock information. For the Hexagon ETM the trace clock is always a divided core clock. Hexagon-ETM Training 10
11 6. Calibrate the TRACE32 recording hardware. Push the AutoFocus button to set up the recording tool. If the calibration is performed successfully, the following message will be displayed: (f=148.mhz) displays the <trace_port_frequency>. The <core_clock> can be calculated out of the <trace_port_frequency> as follows: <core_clock>= 2 * <trace_port_frequency> * (1/<port_mode>) e.g. <core_clock> = 2 * 148MHz *(1 / 1/2) = 148MHz * 4 = 592MHz For details on the calibration of the TRACE32 recording tool, refer to Appendix A. Hexagon-ETM Training 11
12 Example for a start-up script: PER.Set.simple Trace.METHOD Analyzer Analyzer.RESet ETM.RESet ETM.CLEAR ETM.PortSize 16. ETM.PortMode 1/2 Analyzer.AutoFocus ; Setup for the Hexagon debugger ; Enable the ETM and the trace port ; Select "Analyzer" as trace method ; Reset the "Analyzer" ; Reset ETM ; Reset ETM registers ; Target system provides 16 pins ; for TRACEDATA ; Target system is using ; 1/2 <core_clock> as trace clock ; Calibrate the TRACE32 recording ; tool Hexagon-ETM Training 12
13 Cycle-Accurate Tracing If ETM.CycleAccurate is OFF, trace recording and time stamping is done as follows: ETM is exporting the addresses of the executed instructions in form of trace packets trace packets trace packets trace packets trace packets trace packets trace packets trace packets trace packets time stamp time stamp time stamp time stamp time stamp time stamp time stamp time stamp The TRACE32 recording tool - collects the trace packets - stores the trace packets into the trace memory - time stamps the trace packets Hexagon-ETM Training 13
14 ETM.CycleAccurate OFF ETM.FillPort OFF ; Trace packets are organized in ; bytes ; As soon as a trace packet is ; available, it is exported The resolution of the time stamp is: 10 ns if a POWER TRACE / ETHERNET is used 5 ns if a POWER TRACE II is used Hexagon-ETM Training 14

15 If ETM.CycleAccurate is ON trace recording and time stamping is done as follows: ETM is exporting the addresses of the executed instructions and the number of stalls between the instructions in form of trace packets trace packets trace packets trace packets trace packets trace packets trace packets trace packets trace packets The TRACE32 recording tool - collects the trace packets - stores the trace packets TRACE32 is generating the time information for the trace display out of the exported trace information and the <core_clock> provided by the command Analyzer.CLOCK. Cycle accurate tracing provides a more detailed timing and allows a higher density of trace packets in the trace memory, but generates a higher load on the trace port. Analyzer.CLOCK 600.MHz ; Inform TRACE32 about the ; core clock ETM.CycleAccurate ON (ETM.FillPort ON) ; Automatically switched to ON if ; cycle accurate tracing is ON ; The ETM collects the trace ; packets and exports them as ; soon as TRACEDATA/8 packets are ; available Hexagon-ETM Training 15
16 On-chip Trace Hexagon JTAG ETM Hexagon execution core triggering and filtering ETB compression and packetization The trace information exported by the Hexagon ETM is stored in the on-chip trace memory (ETB). The ETB is maintained by the TRACE32 command group Onchip.<subcommand>. Hexagon-ETM Training 16
17 TRACE32 Hardware Configuration The following TRACE32 hardware is sufficient to analyze the trace information piped into the ETB: POWER DEBUG / ETHERNET DEBUG CABLE DEBUG CABLE POWER DEBUG / ETHERNET Hexagon-ETM Training 17
18 Trace Display/Evaluation for All Hardware Threads in Common The ETB contains trace information for all hardware threads Trace packet from hardware thread 1 Trace packet from hardware thread 1 Trace packet from hardware thread 2 Trace packet from hardware thread 3 Trace packet from hardware thread 5 Trace packet from hardware thread 5 Trace packet from hardware thread 4 Trace packet from hardware thread 2 Trace packet from hardware thread 2 Trace packet from hardware thread 0 Trace packet from hardware thread 0 Trace packet from hardware thread 0 The command Onchip.List displays the trace information for all hardware threads: Onchip.List ; Display a trace listing for ; all hardware threads Hexagon-ETM Training 18
19 Trace Display/Evaluation for a Single Hardware Thread Alternatively TRACE32 provides the possibility to display/evaluate the trace information for a single hardware thread via the option /CORE <number>. Onchip.<subcommand> /CORE 0 Onchip.<subcommand> /CORE 1 etc. Onchip.List /CORE 0 ; Display a trace listing for ; hardware thread 0 Hexagon-ETM Training 19
![Basic Start-up Sequence TRACE32 provides the following commands for enabling the ETM: PER.Set.simple <address> [<format>] <value> Data.](/docs-images/89/100150276/images/20-1.jpg "Set <address> [<format>] <value> Starting-up the ETM requires the following steps: 1. Enable the ETM. Enabling the ETM is done by writing to memory-mapped configuration registers.")
20 Basic Start-up Sequence TRACE32 provides the following commands for enabling the ETM: PER.Set.simple <address> [<format>] <value> Data.Set <address> [<format>] <value> Starting-up the ETM requires the following steps: 1. Enable the ETM. Enabling the ETM is done by writing to memory-mapped configuration registers. Refer to your Hexagon manual for details. ; Write the 32-bit value 0x in little endian mode to the ; configuration register at address 0xA PER.Set.simple 0xA %LE %Long 0x2 ; Write the 32-bit value 0x in little endian mode to the ; address 0xA Data.Set 0xA %LE %Long 0x1 2. As soon as the trace method Onchip is selected, all settings for the ETB are automatically done by TRACE32. Select trace method Onchip Trace.METHOD Onchip ; Default if no TRACE32 pre- ; processor hardware is ; connected (see page 16) Hexagon-ETM Training 20
21 automated setup Example for a start-up script: PER.Set.simple Trace.METHOD Onchip Onchip.RESet ETM.RESet ETM.CLEAR ; Setup for the Hexagon debugger ; Enable the ETM and the ETB ; Select "Onchip" as trace method ; Reset the Onchip trace ; Reset ETM ; Reset ETM registers Hexagon-ETM Training 21
22 Cycle-Accurate Tracing ETM is exporting trace packets trace packet trace packet trace packet trace packet trace packet trace packet trace packet trace packet Trace information within the ETB is never time-stamped. FillPort is automatically enabled for the ETB. In order to get timing information, CycleAccurate tracing needs to be enabled (not fully supported yet). Onchip.CLOCK 600.MHz ; Inform TRACE32 about the core ; clock ETM.CycleAccurate ON Hexagon-ETM Training 22
23 Specifying the Trace Method Specifying the trace method has three effect: 1. Selection of the trace repository. 2. Admit the command group Trace.<subcommand> as an alias. 3. Program TRACE32 to use the trace information from the specified trace repository as source for various trace evaluation commands. Hexagon-ETM Training 23

24 Trace Method Analyzer Trace.METHOD Analyzer ; Trace repository is the trace ; memory of the TRACE32 PowerTrace ; Trace is used as an alias for ; Analyzer Trace.List ; Means Analyzer.List All commands in the Trace menu apply to Analyzer All Function Runtime commands apply to Analyzer Hexagon-ETM Training 24
25 The following commands analyze trace information stored into the PowerTrace hardware: CTS.List COVerage.List ISTAT.List MIPS.PROfileChart.sYmbol BMC.List ; Read the trace information from ; Analyzer and provide a high-level ; language trace display ; Read the trace information from ; Analyzer and list which code ; ranges were executed. ; Read the trace information from ; Analyzer and provide an detailed ; instruction statistic ; Read the trace information from ; Analyzer and provide a MIPS ; analysis for all executed ; functions ; Read the trace information from ; Analyzer, display the instruction ; flow including the benchmark ; counters Hexagon-ETM Training 25

26 Trace Method Onchip Trace.METHOD Onchip ; Trace repository is the ETB ; Trace is used as an alias for ; Onchip Trace.List ; Means Onchip.List All commands in the Trace menu apply to Onchip. All Function Runtime commands apply to Onchip. Hexagon-ETM Training 26
27 The following commands analyze trace information stored into the ETB: CTS.List COVerage.List ISTAT.List MIPS.PROfileChart.sYmbol BMC.List ; Read the trace information from ; Onchip and provide a high-level ; language trace display ; Read the trace information from ; Onchip and list which code ; ranges were executed. ; Read the trace information from ; Onchip and provide an detailed ; instruction statistic ; Read the trace information from ; Onchip and provide a MIPS ; analysis for all executed ; functions ; Read the trace information from ; Onchip, display the instruction ; flow including the benchmark ; counters Hexagon-ETM Training 27
28 FLOW ERROR Description In order to provide an intuitive trace display the following sources of information are merged: The trace packets stored in the trace memory of the PowerTrace or the ETB. The trace packets provide only the addresses of the executed instruction packets (instruction flow). The program code from the target memory read via JTAG. The symbol and debug information already loaded to TRACE32. Trace packets from the PowerTrace Program code from the target system memory JTAG Symbol and debug information in TRACE32 Hexagon-ETM Training 28
29 If the program code does not match the captured instruction flow, FLOW ERROR is displayed: Such an error can have the following reasons: The program code in the target memory has changed (e.g. by a faulty pointer) The off-chip trace recording is not working correctly (e.g. a single trace pin is permanently 0) FLOW ERROR indicates that the trace information is not reasonable. Please solve problems first and then continue to analyze/evaluate your trace information. Diagnosis In order to provide the user information quickly, TRACE32 uploads only a specific number of trace records (currently ). Thus FLOW ERRORs are not always detected immediately. For a FLOW ERROR detection for off-chip tracing proceed as follows: Analyzer.FLOWPROCESS PRINT %Decimal A.FLOW.ERRORS() ; Upload the complete trace ; contents from the PowerTrace to ; the host and merge it with the ; program code/debug information ; Print the number of FLOW ERRORs ; as a decimal number Hexagon-ETM Training 29


30 To inspect single FLOW ERRORs proceed as follows: Push the Find... button Type FLOWERROR into the Expert window and push the appropriate Find button Hexagon-ETM Training 30
31 TARGET FIFO OVERFLOW Description If more trace packets are generated than the ETM can export, the FIFO buffer within the ETM can overflow and some trace packets can be lost. If this is the case TARGET FIFO OVERFLOW, PROGRAM FLOW LOST is displayed: TARGET FIFO OVERFLOWs indicate that trace packets are lost. TARGET FIFO OVERFLOWs are likely to happen if cycle accurate tracing is used. All commands that analyze the function nesting are sensitive with regards to TARGET FIFO OVERFLOWs! Hexagon-ETM Training 31
32 Diagnosis In order to provide the user information quickly, TRACE32 uploads only a specific number of trace records (currently ). Thus TARGET FIFO OVERFLOWs are not always detected immediately. For a TARGET FIFO OVERFLOW detection for off-chip tracing proceed as follows: Analyzer.FLOWPROCESS PRINT %Decimal A.FLOW.FIFOFULL() ; Upload the complete trace ; contents from the PowerTrace to ; the host and merge it with the ; program code/debug information ; Print the number of TARGET FIFO ; OVERFLOWs as a decimal number Hexagon-ETM Training 32

33 To inspect single TARGET FIFO OVERFLOWs proceed as follows: Push the Find... button Type FIFOFULL into the Expert window and push the appropriate Find button Hexagon-ETM Training 33
34 ETM Based Real-Time Breakpoints Introduction TRACE32 Hardware Configuration The following TRACE32 hardware is sufficient to use ETM based real-time breakpoints: POWER DEBUG / ETHERNET DEBUG CABLE DEBUG CABLE POWER DEBUG / ETHERNET Hexagon-ETM Training 34
35 Requirements In order to use ETM based real-time breakpoints, the ETM has to be enabled. For details refer to: Basic Start-Up Sequence (training_hexagon_etm.pdf) on page 9 or Basic Start-up Sequence (training_hexagon_etm.pdf) on page 20. The examples in this section are given on the assumption, that you are familiar with the breakpoint handling in TRACE32. If your aren t, please refer to the chapters Breakpoints and Breakpoint Handling in Debugger Basics - Training (training_debugger.pdf). Hint ETM based real-time breakpoints can be set while the program execution is running. Hexagon-ETM Training 35
36 Breakpoint Usage Complex Program Breakpoints Complex breakpoint: Stop the program execution after n hits of a program breakpoint. To illustrate the handling of complex program breakpoints, the following examples are provided: Example 1: Stop the program execution at the nth call of a particular function. Example 2: Stop the program execution at the nth call of a particular function in a particular hardware thread. Example 1 Stop the program execution at the 20th call of the function BLASTK_mutex_lock (etm_break1.cmm). 1. Choose Break menu > Set. Push the advanced button for the specification of a complex breakpoint Hexagon-ETM Training 36

37 2. Specify the breakpoint. - Specify the program address in the address / expression field. - Specify the implementation Onchip. - Specify the COUNTer value. 3. Display a breakpoint listing. 4. Start the program execution. Hexagon-ETM Training 37


38 5. ETM-based breakpoints are not cycle-exact, some logic needs to be passed in order to stop the program execution. As a result the program execution stops shortly after the specified event. 6. Delete the breakpoint when you are done with your test. ; Display a source listing List ; Display a break listing Break.List ; Set breakpoint, select symbol via symbol browser ; Break.Set * /Program /Onchip /COUNT 20. ; Set the breakpoint Break.Set BLASTK_mutex_lock /Program /Onchip /COUNT 20. ; Start the program execution Go ; Delete breakpoint Break.Delete BLASTK_mutex_lock Hexagon-ETM Training 38

39 Example 2 Stop the program execution at the 10th call of the function BLASTK_writec in hardware thread 0x0 (etm_break2.cmm). 1. Specify the breakpoint. - Specify the program address in the address / expression field. - Specify the implementation Onchip - Specify the COUNTer value. 2. Specify the hardware thread in the ETM.state window. Hexagon-ETM Training 39


40 3. Start the program execution. 4. Delete the breakpoint and remove the hardware thread selection when you are done with your test. Hexagon-ETM Training 40
41 ; Set the breakpoint Break.Set BLASTK_writec /Program /Onchip /COUNT 10. ; Display the ETM settings ETM.state ; Specify hardware thread 0x0 for the breakpoint and the trace ; exporting ETM.TraceTNUM 0x0 Go ; Delete breakpoint Break.Delete BLASTK_writec ; Remove hardware thread setting ETM.TraceTNUM Summary Use the following command to stop the program execution after the specified instruction was executed a specified number of times. You can specify up to 4 to single instruction addresses and up to 4 instruction address ranges. Break.Set <address> <range> /Program /Onchip /COUNT <number> Hexagon-ETM Training 41
42 Complex Data Breakpoints Complex data breakpoint: Stop the program execution after the specified address was read/written, specification of data value possible. To illustrate the handling of complex data breakpoints, the following examples are provided: Example 1: Stop the program execution after a write access to a specific integer variable. Example 2: Stop the program execution after a specific value was written to a specific integer variable. Example 3: Stop the program execution after a specific data value was written to a specified address n-times. Example 1 - Complex Data Breakpoints Stop the program execution after a write access to the integer variable BLASTK_wait_mask (etm_break3.cmm). 1. Specify the breakpoint. - Specify the variable in the address / expression field and enable the HLL check box. - Specify Write as breakpoint type. 2. Start the program execution. Hexagon-ETM Training 42

43 NOTE: The instruction that performed the write access and so caused the program stop, cannot be detected automatically since ETM-based breakpoints are not cycle-exact register indirect addressing is used Var.View %Hex %Decimal BLASTK_wait_mask Var.Break.Set BLASTK_wait_mask /Write Go ; Display contents of variable ; BLASTK_wait_mask ; Set the breakpoint ; Start the program execution Hexagon-ETM Training 43

44 Example 2 - Complex Data Breakpoints Stop the program execution after the value 0x24 was written to the integer variable BLASTK_wait_mask (etm_break4.cmm). 1. Specify the breakpoint. - Specify the variable in the address / expression field and enable the HLL check box. - Specify Write as breakpoint type. - Specify the DATA value. 2. Start the program execution. Var.Break.Set BLASTK_wait_mask /Write /DATA.auto 0x24 Go Hexagon-ETM Training 44
45 Summary ; Set memory access breakpoint, data value possible ; (up to 4 accesses to single addresses, up to 2 accesses to address ranges) Break.Set <address> <range> /ReadWrite /Read /Write Var.Break.Set <hll_expression> /ReadWrite /Read /Write Break.Set <address> <range> /<access> /DATA.auto <data> /DATA.Byte <data> Break.Set <address> <range> /<access> /DATA.Word <data> /DATA.Long <data> Var.Break.Set <hll_expression> /<access> /DATA.auto <data> Hexagon-ETM Training 45
. 1. Specify the breakpoint.")
46 Example 3 - Complex data breakpoint Complex data breakpoint: Stop the program execution after a specific data value was read/written from/to a specified address n-times. Stop the program execution after the value 0x36 was written 3. times to the integer variable BLASTK_wait_mask (etm_break5.cmm). 1. Specify the breakpoint. - Specify the variable in the address / expression field and enable the HLL check box. - Specify Write as breakpoint type. - Specify DATA value. - Specify the COUNTer value. 2. Start the program execution. Hexagon-ETM Training 46
 Break.")
47 Var.View %Hex %Decimal BLASTK_wait_mask Var.Break.Set BLASTK_wait_mask /Write /DATA.auto 0x36 /COUNT 3. Go Summary ; Set memory access breakpoint, data value possible, one counter (up to 1) Break.Set <address> <range> /<access> <data_def> /COUNT <number> Var.Break.Set <hll_expression> /<access> <data_def> /COUNT <number> Hexagon-ETM Training 47
48 Combining Program and Data Breakpoints Complex breakpoint: Stop the program execution after the specified instruction has read/written the specified data value from/to the specified address (negation of the instruction address possible). To illustrate the combination of program and data breakpoints, the following examples are provided: Example 1: Stop the program execution after an instruction from a <function> has written a <value> to an <integer variable>. Example 2: Stop the program execution if any <function>, but not <function X>, writes to the <variable Y>. Example 1 Stop the program execution after an instruction from the function BLASTK_schedule_new_fromsleep has written the value 0x34 to the integer variable BLASTK_wait_mask (etm_break6.cmm). 1. Specify the breakpoint. - Specify the function s address range in the address / expression field. - Specify DATA value. - Select MemoryWrite. - Specify the variable in the memory / register / var field. 2. List the breakpoint settings. Hexagon-ETM Training 48

49 3. Start the program execution. Break.Set 0x180C240--0x180C2F4 /VarWrite BLASTK_wait_mask; /DATA.auto 0x34 Go Hexagon-ETM Training 49
50 Example 2 Stop the program execution if any function, but not BLASTK_schedule_new_fromsleep, writes to the variable BLASTK_wait_mask (etm_break7.cmm). 1. Specify the breakpoint. - Specify the function s address range in the address / expression field. - Select EXclude to negate the function s address range. - Select MemoryWrite. - Specify the variable name in the memory / register / var field. 2. Start the program execution. Hexagon-ETM Training 50

51 Break.Set BLASTK_schedule_new_fromsleep++0xB4 /VarWrite BLASTK_wait_mask /EXclude Go Hexagon-ETM Training 51
52 Summary ; Set combined instruction/data access breakpoint, data value possible, negation possible (up to 1) Break.Set <i_address> <i_range> /MemoryReadWrite <d_address> <d_range> <data_def> [/EXclude] Break.Set <i_address> <i_range> /MemoryRead <d_address> <d_range> <data_def> [/EXclude] Break.Set <i_address> <i_range> /MemoryWrite <d_address> <d_range> <data_def> [/EXclude] Var.Break.Set <function> /VarReadWrite <variable> DATA.auto <value> [/EXclude] Var.Break.Set <function> /VarRead <variable> DATA.auto <value> [/EXclude] Var.Break.Set <function> /VarWrite <variable> DATA.auto <value> [/EXclude] Hexagon-ETM Training 52


53 Saving the Breakpoint Settings as a PRACTICE Script You can save breakpoint settings via the TRACE32 PowerView GUI or via the TRACE32 command line. To save them via the GUI, take the following steps: 1. Choose Break menu > List to open a breakpoint listing. 2. Click the Store button to generate a PRACTICE script for all set breakpoints. 3. Specify the name for the PRACTICE script, and then click Save. 4. To display the contents of the PRACTICE script, choose File menu > Edit Script. The following commands are available to save breakpoint settings via the TRACE32 command line: STOre <file> Break ClipSTOre Break Save breakpoint settings to file. Save breakpoint settings to clipboard. Hexagon-ETM Training 53
54 Displaying the Trace Contents Fundamentals In order to provide an intuitive trace display the following sources of information are merged: The trace packets stored in the trace memory of the PowerTrace/ETB. The trace packets provide only the addresses of the executed instruction packets (instruction flow). The program code from the target memory read via JTAG. The symbol and debug information already loaded to TRACE32 from a file. Trace packets from the PowerTrace/ETB Program code from the target system memory JTAG Symbol and debug information in TRACE32 Hexagon-ETM Training 54
55 The following functional units have an effect on the trace recording: Benchmark counters Filter via the ETM.Set command Filter breakpoints ETM configuration ETM trace packet generation [0..n-1] Trace/Analyzer configuration in TRACE32 Trigger breakpoints Trace memory of PowerTrace/ETB Trigger via the ETM.Set command Hexagon-ETM Training 55
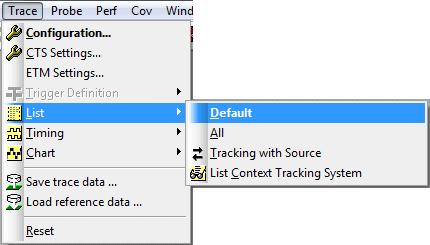
56 Display Commands The following commands are available to display a trace listing: Trace.List Trace.List /CORE 0 Trace.List /CORE 1 Trace.List /CORE 2 Trace.List /CORE 3 Trace.List /CORE 4 Trace.List /CORE 5 Display a trace listing by merging the trace information of all hardware threads Display the trace listing based on the trace information generated for hardware thread 0 Display the trace listing based on the trace information generated for hardware thread 1 Display the trace listing based on the trace information generated for hardware thread 2 Display the trace listing based on the trace information generated for hardware thread 3 Display the trace listing based on the trace information generated for hardware thread 4 Display the trace listing based on the trace information generated for hardware thread 5 Hexagon-ETM Training 56


57 Trace.List Trace.List /CORE 3 Hexagon-ETM Training 57

58 Please Note TRACE32 flushes all trace information stuck in the ETM fifos when the recording to the trace repository is stopped because the program execution stopped. These delayed exported trace packets can be identified by no TIme.Back value or by a large TIme.Back value. Flushed trace packets On the one hand, flushing the ETM fifos is necessary to get the correct state of a hardware thread. In most cases wait instructions are stuck. On the other hand, run-time measurements can be falsified due to incorrect (too large) time stamps. Please refer to Did you know? to learn how to exclude flushed trace packets from the run-time measurement. Hexagon-ETM Training 58

59 Correlating Different Trace Displays The /Track option allows to establish a timing relation between different trace displays. The cursors of all Trace.List windows with the option /Track track the cursor movement within the active window. Example: Trace.List Trace.List /CORE 0 /Track Trace.List /CORE 3 /Track Cursor movement within the active window Track cursor Track cursor If a trace record in the Trace.List window is selected, the cursors in the Trace.List /CORE 0 and Trace.List /CORE 3 windows mark the record that was executed by their hardware thread nearly at the same time. Hexagon-ETM Training 59


60 Correlating the Trace Display and the Source Code The /Track option also allows to establish a logical relation between a trace listing and a source code listing. If a trace record is selected in the Trace.List window, the corresponding source code line is automatically highlighted with a blue cursor. Example: Trace.List List /Track Corresponding source code line Selected record For a description of the highlighted columns, see Default Display Items. Hexagon-ETM Training 60
61 Default Display Items Columns record run address cycle data symbol ti.back (TIme.Back) Description Record number (For details, click here.) Run-time information (For details, click here.) Logical address of the executed instruction packet. Cycle type. The only available cycles type is ptrace. ptrace stands for program trace information. (No data access information is exported by the Hexagon ETM) Symbolic address of the executed instruction packet Distance of time between a trace record and its preceding trace record (For details, click here.) record Trace records are numbered consecutively in the trace display. The numbering scheme depends on the selected trace mode. The following trace modes are available: Fifo Mode Stack Mode Leash Mode STREAM Mode Hexagon-ETM Training 61


62 Trace.Mode Fifo ; Default mode ; When the trace repository is full ; the newest trace information ; overwrites the oldest ; The trace repository contains ; all information exported ; until the program execution ; stopped In Fifo mode negative record numbers are used. The last record gets the smallest negative number. Hexagon-ETM Training 62

63 Trace.Mode Stack ; When the trace repository is full ; the trace recording is stopped ; The trace repository contains ; all information exported ; directly after the start of ; the program execution As soon as the trace repository is full, the trace capturing is stopped (OFF state) OFF in the Trace State Field indicates that the trace capturing is stopped running in the Debug State Field indicates that the program execution is running Hexagon-ETM Training 63

64 Trace information can not be displayed while the program is running, since TRACE32 has NOACCESS to the program code in the target system memory Hexagon-ETM Training 64
.")
65 In order to display the trace information, you can either stop the program execution, or you can set up TRACE32 for displaying the trace information while the program execution is running. This is done by copying the program code to the TRACE32 Virtual Memory (VM:). Trace packets from the PowerTrace Copy of the program code in TRACE32 Virtual Memory Symbol and debug information in TRACE32 ; Copy the program code from the target system memory into the TRACE32 ; Virtual Memory (VM:) in order to get access to the program code ; while the program execution is running Data.COPY 0x x182afff VM: Alternatively: ; Load the program code into the TRACE32 Virtual Memory (VM:) Data.LOAD.Elf blast/bootimg.pbn /VM /NOREG /NOMAP Loading the program code into the virtual memory is also recommended if the JTAG interface is very slow or if there is no access to the target system memory due to any reasons. Hexagon-ETM Training 65
 on page 28.")
66 NOTE: Please make sure that the TRACE32 Virtual Memory always provides an up-todate version of the program code. Out-of-date program versions will cause FLOW ERRORs (see FLOW ERROR (training_hexagon_etm.pdf) on page 28. Back to Stack mode now: Since the trace recording starts with the program execution and stops when the trace repository is full, positive record numbers are used in Stack mode. The first record in the trace gets the smallest positive number. Hexagon-ETM Training 66

67 Trace.Mode Leash ; When the trace repository is ; nearly full the program execution ; is stopped ; Same record numbering as for ; Stack mode Hexagon-ETM Training 67
68 STREAM Mode (PowerTrace only) Trace.Mode STREAM ; STREAM the recorded trace ; information to a file on the host ; computer ; STREAM mode uses the same record ; numbering scheme as Stack mode The trace information is immediately streamed to a file on the host computer after it was placed into the trace memory of TRACE32 PowerTrace. This procedure extends the size of the trace memory to up to 1 T Frames. Streaming mode requires 64-bit host computer and a 64-bit TRACE32 executable to handle the large trace record numbers. By default the streaming file is placed into the TRACE32 temporary directory (OS.PresentTemporaryDirectory()). The command Trace.STREAMFILE <file> allows to specify a different name and location for the streaming file. Trace.STREAMFILE d:\temp\mystream.t32 ; Specify the location for ; your streaming file Please be aware that the streaming file is deleted as soon as you de-select the STREAM mode or when you exit TRACE32. Hexagon-ETM Training 68


69 STREAM mode can only be used if the average data rate at the trace port does not exceed the maximum transmission rate of the host interface in use. Peak loads at the trace port are intercepted by the trace memory of the PowerTrace, which can be considered to be operating as a large FIFO. used indicates how much trace information is buffered by the trace memory (used FIFO) STREAM mode can generate very large record numbers If no trace information was exported by a hardware thread within records, the record column shows????. Hexagon-ETM Training 69
 display address information for all instruction packets Trace.List List.")
70 run Graphic elements provide a quick overview on the program flow sequential instruction execution branch taken ; Display trace information for hardware thread 3 ; (List.ADDRESS) display address information for all instruction packets Trace.List List.ADDRESS DEFault /CORE 3 Hexagon-ETM Training 70


71 Interrupts/Traps are indicated in the run column. Pastel printed source code indicates that a branch was not taken. Hexagon-ETM Training 71

72 Trace.List ; The run column indicates which ; hardware thread executed the ; exported instruction packet Hexagon-ETM Training 72

: Trace records are time stamped when they are stored into the PowerTrace s memory. The resolution of the time stamp is 10 ns for PowerTrace and 5 ns for PowerTrace II. (ETM.")
73 address/symbol The address column shows the logical address of the executed instruction packet. The symbol column shows the symbolic address of the executed instruction packet. TIme.Back TIme.Back indicates the distance of time between a trace record and its preceding trace record on the same core. No TIme.Back information is displayed, if the preceding trace record on the same core is too far away. Time stamp generation (ETM.CycleAccurate OFF): Trace records are time stamped when they are stored into the PowerTrace s memory. The resolution of the time stamp is 10 ns for PowerTrace and 5 ns for PowerTrace II. (ETM.CycleAccurate ON): The time information is calculated from the exported trace information and the core clock provided by the command Trace.CLOCK <core_clock>. Hexagon-ETM Training 73

74 Additional Display Items ASID and TID If the ContextID check box is active in the ETM.state window, the ASID and TID are exported by the ETM. Hexagon-ETM Training 74


75 TIme.Zero In addition to TIme.Back there is also a more global time information called TIme.Zero. Trace.List DEFault TIme.Zero ; Add the TIme.Zero ; information to ; the default trace display TRACE32 allows to mark a selected record as zero point within the trace. All other trace records are then time referenced to this record. Hexagon-ETM Training 75


76 ETM Packets Trace.List TP DEFault /CORE 0 ; Add the trace packet information ; to the default trace display ; Display trace control and the lowest 8 trace port pins with time stamp Trace.List %Timing TCTL TP0 TP1 TP2 TP3 TP4 TP5 TP6 TP7 TIme.Back Hexagon-ETM Training 76


77 Formatting the Trace Display The standard way to format the trace display is to use the More/Less buttons. Pushing one time the More button Pushing one time the More button will add the so-called dummy records to the trace display. Dummy records don t provide information with regards to the program execution. They are just empty in most cases. Trace.List DEFault List.NoDummy.OFF Hexagon-ETM Training 77
 from the trace display. Trace.List DEFault List.")

78 Pushing for the first time the Less button Pushing for the first time the Less button will remove the trace packet information (ptrace records) from the trace display. Trace.List DEFault List.NoCycle Pushing for the second time the Less button Pushing for the second time the Less button will remove the assembly code from the trace display. Trace.List List.HllOnly List.TIme TIme.Back Hexagon-ETM Training 78

79 Changing the DEFault Display The command SETUP.ALIST allows to change the DEFault display of the trace information preset by TRACE32. Examples: ; Add the column TIme.Zero after the default display SETUP.ALIST DEFault TIme.Zero ; Add time and address information for every instruction packet SETUP.ALIST DEFault List.ADDRESS List.TIme ; Add ETM trace packet information before the default display ; See picture below SETUP.ALIST TP DEFault ; Increase the width of the symbol column (60 characters) SETUP.ALIST %LEN 60 DEFault Hexagon-ETM Training 79
80 The AutoInit Option While testing it might be helpful to clear the trace memory of the PowerTrace/ETB before a new test is started. Instead of pushing manually the Init button in the Trace.state window, it is more convenient to activate the AutoInit check box. Init button AutoInit check box Trace.AutoInit ON ; The trace memory is ; automatically cleared before ; the program execution is started Hexagon-ETM Training 80

81 Searching in the Trace TRACE32 provides fast search algorithms to find a specific event in the trace quickly. Push the Find button Use the Trace Find dialog to specify your event Hexagon-ETM Training 81

82 Did you know? If no trace information is available for the hardware thread, you can get to an trace area with information as follows: 1. Open the Trace Find dialog by pushing the Find button. 2. Select the Changes page. 3. Select either Up or Down as search direction. 4. Push Find Here to start the search. Open the Trace Find dialog by pushing the Find button (1) Changes page (2) Select Up or Down as search direction (3) (4) Hexagon-ETM Training 82
83 Belated Trace Analysis There are several ways for a belated trace analysis: 1. Save a part of the trace contents into an ASCII file and analyze this trace contents by reading. 2. Save the trace contents in a compact format into a file. Load the trace contents at a subsequent date into a TRACE32 Instruction Set Simulator and analyze it there. 3. Export the ETMv3 byte stream to postprocess it with an external tool. Hexagon-ETM Training 83
 ; Specify the file name 2.")
--(-2418.")
84 ASCII File Saving part of the trace contents to an ASCII file requires the following steps: 1. Choose File menu > Print, and then specify the file name and the output format. PRinTer.FileType ASCIIE PRinTer.FILE testrun1.lst ; Specify output format ; here (ASCII enhanced) ; Specify the file name 2. It only makes sense to save a part of the trace contents into an ASCII-file. Use the record numbers to specify the trace part you are interested in. TRACE32 provides the command prefix WinPrint. to redirect the result of a display command into a file. ; Save the trace record range (-8976.)--(-2418.) into the ; specified file WinPrint.Trace.List (-8976.)--(-2418.) 3. Use an ASCII editor to display the result. Hexagon-ETM Training 84
85 TRACE32 Instruction Set Simulator The following command allows you to save the trace information to a file: Trace.SAVE <file> Analyzing the trace contents within a TRACE32 simulator requires the following three steps: 1. Save the contents of the trace memory to a file. Trace.SAVE testrun1 ; The following information ; is saved to file: ; - Raw data ; - Merged source code ; - Timing information Hexagon-ETM Training 85


86 2. Start a TRACE32 instruction set simulator (PBI=SIM). Hexagon-ETM Training 86


87 3. Select your target CPU within the simulator. 4. Load the trace file. Trace.LOAD testrun1 Trace.List ; Display a trace listing LOAD indicates that the source for the trace information is the loaded file. 5. Load symbol and debug information if you need it. Data.LOAD.Elf blast/bootimg.pbn /NOCODE The TRACE32 instruction set simulator provides the same trace display and analysis commands as the TRACE32 debugger. Please be aware that analyzing the trace in the TRACE32 instruction set simulator will require a more complex setup if the MMU is used. (no example for testing available) Hexagon-ETM Training 87
88 Export the Trace Information as ETMv3 Byte Stream TRACE32 allows to save the ETMv3 byte stream into a file for further analysis by an external tool. Trace.EXPORT testrun1.ad /ByteStream ; Export only a part of the trace contents Trace.EXPORT testrun2.ad ( )--(-2389.) /ByteStream Hexagon-ETM Training 88
89 Function Run-Times Analysis All commands for the function run-time analysis introduced in this chapter use the contents of the trace repository as base for their analysis. For the function run-time analysis it is helpful to differentiate between three types of application software: 1. Software without operating system (abbreviation: no OS) 2. Software with an operating system without dynamic memory management (abbreviation: OS). 3. Software with an operating system that uses dynamic memory management to handle processes/tasks (abbreviation: OS+MMU). If an OS+MMU is used, several processes/tasks run at the same virtual addresses. Hexagon-ETM Training 89

90 Flat vs. Nesting Analysis Basic Knowledge about the Flat Analysis The flat analysis bases on the symbolic instruction addresses of the trace entries. The time spent by an instruction packet is assigned to the corresponding function. min max main func1 func2 func1 func1 func3 main func1 func3 func1 main Entry of func1 Entry of func1 Exit of func1 Exit of func1 min max shortest time continuously in the address range of a function/symbol range longest time continuously in the address range of a function/symbol range Hexagon-ETM Training 90

91 Basic Knowledge about the Nesting Analysis For the function run-time analysis with nesting, the TRACE32 software scans the trace contents in order to find: 1. Function entries The execution of the first instruction of an HLL function is regarded as function entry. Additional identifications of function entries are implemented depending on the processor architecture and the compiler used. 2. Function exits A RETURN instruction within an HLL function is regarded as function exit. Additional identifications of function exits are implemented depending on the processor architecture and the compiler used. 3. Entries to interrupt service routines (asynchronous) Interrupts are identified as follows: - An entry to the vector table is detected and the vector address indicates an asynchronous/hardware interrupt. The HLL function started following the interrupt is regarded as interrupt service routine. If a RETURN is detected before the entry to this HLL function, TRACE32 assumes that there is an assembler interrupt service routine. This assembler interrupt service routine has to be marked explicitly if it should be part of the function run-time analysis (symbol.new.marker FENTRY/FEXIT). 4. Exits of interrupt service routines Hexagon-ETM Training 91

92 5. Entries to TRAP handlers (synchronous) 6. Exits of TRAP handlers Based on the results a complete call tree is constructed. main func1 func2 func1 func3 func1 main func1 func3 func1 main Entry of func1 max Entry of func1 min Exit of func1 Exit of func1 min max shortest time within the function including all subfunctions and traps longest time within the function including all subfunctions and traps Summary The nesting analysis provides more details on the structure and the timing of the program run, but it is much more sensitive then the flat analysis. Missing or tricky function exits for example result in a worthless nesting analysis. Hexagon-ETM Training 92
 Details on the execution of single")
93 Flat Analysis Flat function run-time analysis is easy to use and error-tolerant. It provides analysis results at different levels: Overview on the dynamic program behavior Timing diagrams of function execution order (function timing diagram) Details on the execution of single instructions (hot-spot analysis) Dynamic Program Behavior (no OS and OS) Push the Profile button to get information on the dynamic behavior of the program. Trace.PROfileChart.sYmbol [/SplitCORE] Graphic display of dynamic program behavior Analysis independently for each hardware thread Individual results for all hardware threads are displayed The number after : represents the hardware thread Default option Hexagon-ETM Training 93


94 Trace.PROfileChart.sYmbol /MergeCORE Graphic display of dynamic program behavior Analysis independently for each hardware thread Results are summarized and displayed as a single result Trace.PROfileChart.sYmbol /CORE <n> Graphic display of dynamic program behavior Analysis for specified hardware thread Hexagon-ETM Training 94

95 More Details To draw the Trace.PROfileChart.sYmbol graphic, TRACE32 PowerView partitions the recorded instruction flow into time intervals. The default interval size is 10.us. For each time interval rectangles are drawn that represent the time ratio the executed functions/symbol ranges consumed within the time interval. For the final display this basic graph is smoothed. BLASTK_wait_forever:5 doangel:3 BLASTK_puts_debug_buffer:3 BLASTK_error:3 BLASTK_reschedule_from_wait:2 BLASTK_futex_wait:0 BLASTK_futex_wait:4 BLASTK_futex_wait:1 BLASTK_mutex_lock:3 Hexagon-ETM Training 95

96 Fine Decrease the time interval size by the factor 10 Coarse Increase the time interval size by the factor 10 The time interval size can also be set manually. Trace.PROfileChart.sYmbol /InterVal 5.ms ; Change the time ; segment size to 5.ms Hexagon-ETM Training 96
 and the used interval size.")

97 Color Assignment - Basics The tooltip at the cursor position shows the function color assignment (item) and the used interval size. Use the control handle on the right upper corner of the Trace.PROfileChart.sYmbol window to get a color legend. Control handle Hexagon-ETM Training 97

98 Function Color Assignment - Statically or Dynamically FixedColors Colors are assigned fixed to functions (default). Fixed color assignment has the risk that two functions with the same color are drawn side by side and thus may convey a wrong impression of the dynamic behavior. AlternatingColors Colors are assigned by the recording order of the functions, again and again for each measurement. Trace.PROfileChart.sYmbol [/InterVal <time>] Trace.PROfileSTATistic.sYmbol [/InterVal <time>] Trace.STATistic.COLOR FixedColors AlternatingColors Overview on the dynamic behavior of the program Graphical display Overview on the dynamic behavior of the program Numerical display for export as comma-separated values Color assignment method Hexagon-ETM Training 98

99 Function Timing Diagram (no OS or OS) Push the Chart button to get a function timing diagram for the captured instruction flow. Trace.Chart.sYmbol [/SplitCORE] Graphic display of function timing Analysis independently for each hardware thread Individual results for all hardware threads are displayed The number after : represents the hardware thread Default option Hexagon-ETM Training 99


100 Trace.PROfileChart.sYmbol /MergeCORE Graphic display of function timing Analysis independently for each hardware thread Results are summarized and displayed as a single result Trace.PROfileChart.sYmbol /CORE <n> Graphic display of function timing Analysis for specified hardware thread Hexagon-ETM Training 100


101 Did you know? Periods of time for which no trace information is exported (?????) are assigned to the last running function (here BLASTK_futex_wait). Did you know? If the Window check box is selected in the Chart Config window, the functions that are active at the selected point of time are visualized in the Trace.Chart.sYmbol window. This is helpful especially if you scroll horizontally. Switch Window on Hexagon-ETM Training 101
102 Numerical Display Some trace analysis commands that provide a graphical result have a numerical counterpart. Trace.Chart.sYmbol Trace.STATistic.sYmbol Graphic display of function timing Numerical display of function timing Trace.STATistic.sYmbol [/SplitCORE] Numerical display of function timing Analysis independently for each hardware thread Individual results for all hardware threads are displayed The number after : represents the hardware thread Default option Hexagon-ETM Training 102

103 For a description of the list summary and the highlighted columns, see tables below. List Summary item total samples Number of recorded functions/symbol regions Time period recorded by the trace Total number of recorded changes of functions/symbol regions (instruction flow continuously in the address range of a function/symbol region) Columns with function details address total min max avr count ratio Function name (other) program sections that can not be assigned to a function/symbol region Time period in the function/symbol region during the recorded time period Shortest time continuously in the address range of the function/symbol region Longest time continuously in the address range of the function/symbol region Average time continuously in the address range of the function/symbol region (calculated by total/count) Number of new entries into the address range of the function/symbol region (start address executed) Ratio of time in the function/symbol region with regards to the total time period recorded Hexagon-ETM Training 103

104 Pushing the Config button provides the possibility to specify a different sorting criterion or a different column layout Trace.STATistic.sYmbol /MergeCORE Trace.STATistic.sYmbol /CORE <n> Numerical display of function timing Analysis independently for each hardware thread Results are summarized and displayed as a single result Numerical display of function timing Analysis for specified hardware thread Hexagon-ETM Training 104

105 Did you know? TRACE32 flushes all trace information stuck in the ETM fifos when the recording to the trace repository is stopped because the program execution stopped. These delayed exported trace packets can be identified by no TIme.Back value or by a large TIme.Back value. These delayed exported trace packets can falsify the run-time analysis. So it is recommended to exclude them from the analysis. This is done by tagging the last not-delayed trace packet as Last in Statistic : Trace.STATistic.LAST ; Specify the last record that ; should be included into the ; statistic analysis, the rest ; will be ignored Hexagon-ETM Training 105

106 Hot-spot Analysis (no OS or OS) If a function seems to be very time consuming, details on the run-time of single instruction packets can be displayed with the help of the ISTATistic command group. Preparation The run-time results on single instruction packets are more accurate if cycle-accurate tracing is used. ETM.CycleAccurate ON Trace.CLOCK 600.MHz ; Switch cycle accurate tracing on ; Inform TRACE32 about your core ; frequency A high number of local FIFOFULLs might affect the result of the instruction statistic. Hexagon-ETM Training 106
107 Processing The command group ISTATistic works with a database. The measurement includes the following steps: 1. Enable cycle-accurate tracing. 2. Specify the core clock frequency. 3. Clear the database. 4. Fill the trace repository. 5. Transfer the contents of the trace repository to the database. 6. Display the result. 7. (Repeat step 4-6 if required). Main commands: ETM.CycleAccurate ON Trace.CLOCK <core_clock> Trace.FLOWPROCESS ISTATistic.RESet ISTATistic.ADD [/MergeCORE] Switch cycle-accurate tracing on. Inform TRACE32 about your core frequency. Upload the complete trace contents to the host and merge it with the program code/debug information Clear the Instruction Statistic database. Transfer the trace information of all hardware threads from the trace repository to the Instruction Statistic database. Default ISTATistic.ADD /CORE <n> ISTATistic.ListFunc Data.List <address> /ISTAT TCLOCKS Transfer the trace information of the specified hardware thread from the trace repository to the Instruction Statistic database. List flat function run-time analysis based on the added trace information. List flat run-time analysis for the single instruction packets. Hexagon-ETM Training 107
108 A detailed flat function run-time analysis for all hardware threads can be performed as follows: ETM.CycleAccurate ON Trace.CLOCK 600.MHz ISTATistic.RESet Trace.Mode Leash Go WAIT!RUN() Trace.FlowProcess ; Switch cycle accurate tracing on ; Inform TRACE32 about your core ; frequency ; Reset Instruction Statistic Data ; Base ; Switch trace to Leash mode ; Start program execution ; Wait until program stops ; Process the trace information IF Trace.FLOW.FIFOFULL>6000. PRINT "Warning: Please control the FIFOFULLS" ISTATistic.add ISTATistic.ListFunc ; Add trace information for all ; hardware threads to Instruction ; Statistic database ; List flat function run-time ; statistic Hexagon-ETM Training 108

109 For a description of the highlighted columns, see table below. Columns address tree coverage count time clocks ratio cpi Description Address range of the module, function or HLL line Flat module/function/hll line tree Code coverage of the module, function or HLL line Number of module/function/hll line executions Total time spent by the module, function or HLL line Total number of clocks spent by the module, function or HLL line Percentage of the total measurement time spent in the module, function or HLL line Average clocks per instruction packet for the function or the HLL line Hexagon-ETM Training 109
 Average thread clocks per")
110 List.Asm /ISTAT TCLOCKS ; List instruction packet run-time ; statistic ; - Display time information per ; thread For a description of the highlighted columns, see below. Columns count tclocks tcpi Description Total number of instruction packet executions Total number of thread clocks for the instruction packet (tclocks = 1/6 clocks) Average thread clocks per instruction packet Hexagon-ETM Training 110

111 Data.ListAsm /ISTAT COVerage ; List instruction packet coverage For a description of the highlighted columns, see below. Columns exec Description Conditional instructions: number of times the instruction packet was executed because the condition was true. Other instructions: number of times the instruction packet was executed notexec coverage Conditional instructions: number of times the instruction packet wasn t executed because the condition was false. Instruction packet coverage If exec or/and notexec is 0 for an instruction packet with condition, the instruction packet is bold-printed against a yellow background. All other instruction packets are bold-printed on a yellow background if they were not executed. Hexagon-ETM Training 111
112 Nesting Analysis Fundamentals 1. The nesting analysis analyses only HLL functions. 2. The nesting analysis expects common ways to enter/exit functions. 3. The result of the nesting analysis is sensitive with regards to FIFOFULLs. No OS Trace.Chart.Func Trace.STATistic.Func Graphic display of nested function run-time analysis Numerical display of nested function run-time analysis Hexagon-ETM Training 112

113 The TRACE32 software scans the trace contents in order to find: Function entries The execution of the first instruction of an HLL function is regarded as function entry. Additional identifications for function entries are implemented depending on the processor architecture and the used compiler. Trace.Chart.Func /CORE 1 ; Function ; BLASTK_continuation_syscall ; as example Trace.List /CORE 1 /Track Hexagon-ETM Training 113

114 Function exits A RETURN instruction within an HLL function is regarded as function exit. Additional identifications for function exits are implemented depending on the processor architecture and the used compiler. Hexagon-ETM Training 114

115 Entries to interrupt service routines (asynchronous) Interrupts are identified as follows: - An entry to the vector table is detected and the vector address indicates an asynchronous/hardware interrupt. The HLL function started following the interrupt is regarded as interrupt service routine. If a RETURN is detected before the entry to this HLL function, TRACE32 assumes that there is an assembler interrupt service routine. This assembler interrupt service routine has to be marked explicitly if it should be part of the function run-time analysis (symbol.new.marker FENTRY/FEXIT). Trace.Chart.Func /CORE 1 ; Function BLASTK_handle_int ; as example Trace.List /CORE 1 /Track Exits of interrupt service routines A RETURN / RETURN FROM INTERRUPT within the HLL interrupt service routine is regarded as exit of the interrupt service routine. Hexagon-ETM Training 115

116 Entries to TRAP handlers (synchronous) If an entry to the vector table is identified and if the vector address indicates a synchronous interrupt/trap the following entry to an HLL function is regarded as entry to the trap handler. Trace.Chart.Func /CORE 0 ; Function BLASTK_handle_trap0 ; as example Trace.List /CORE 0 /Track Exits of TRAP handlers A RETURN / RETURN FROM INTERRUPT within the HLL TRAP handler is regarded as exit of the TRAP handler. Hexagon-ETM Training 116

117 Analysis Details (no OS) Numerical Analysis Trace.STATistic.Func [/MergeCORE] Trace.STATistic.sYmbol /CORE <n> Numerical display of nested function run-time analysis analysis for all hardware threads Numerical display of function timing analysis for specified hardware thread List Summary For a description of the list summary, see table below. List Summary func total intr Number of functions in the trace Total measurement time Total time in interrupt service routines Hexagon-ETM Training 117
118 For a description of the highlighted column, see table below. Columns range (NAME) Description Function name, sorted by their occurrence by default (root) The function nesting is regarded as tree, root is the root of the function nesting. HLL function HLL interrupt service routine HLL trap handler Hexagon-ETM Training 118
119 For a description of the highlighted columns, see below. Columns (cont.) total min Description Total time within the function Shortest time between function entry and exit, time spent in interrupt service routines is excluded. No min time is displayed if a function exit was never executed. max avr Longest time between function entry and exit, time spent in interrupt service routines is excluded. Average time between function entry and exit, time spent in interrupt service routines is excluded. Hexagon-ETM Training 119
120 For a description of the highlighted columns, see below. Columns (cont.) count Description Times within the function If function entries or exits are missing, this is displayed in the following format: <times within the function >. (<number of missing function entries>/<number of missing function exits>). Interpretation examples: (2/0): 2. times within the function, 2 function entries missing (0/3): 4. times within the function, 3 function exits missing (1/1): 11. times within the function, 1 function entry and 1 function exit is missing. If the number of missing function entries or exits is higher the 1. the analysis performed by the command Trace.STATistic.Func might fail due to nesting problems. A detailed view to the trace contents is recommended. Columns (cont.) intern% (InternalRatio, InternalBAR.LOG) Description Ratio of time within the function without subfunctions, TRAP handlers, interrupts Hexagon-ETM Training 120
 - times only in function Internal IAVeRage IMIN IMAX InternalRatio InternalBAR Total time between function entry and exit without called sub-functions, TRAP handlers, interrupt service routines")
121 Pushing the Config button allows to display additional columns. For a description of the additional columns, see tables below. Columns (cont.) - times only in function Internal IAVeRage IMIN IMAX InternalRatio InternalBAR Total time between function entry and exit without called sub-functions, TRAP handlers, interrupt service routines Average time between function entry and exit without called subfunctions, TRAP handlers, interrupt service routines Shortest time between function entry and exit without called subfunctions, TRAP handlers, interrupt service routines Longest time spent in the function between function entry and exit without called sub-functions, TRAP handlers, interrupt service routines <Internal time of function>/<total measurement time> as a numeric value. <Internal time of function>/<total measurement time> graphically. Hexagon-ETM Training 121
122 Columns (cont.) - times in sub-functions and TRAP handlers External EAVeRage EMIN EMAX Total time spent within called sub-functions/trap handlers Average time spent within called sub-functions/trap handlers Shortest time spent within called sub-functions/trap handlers Longest time spent within called sub-functions/trap handlers Columns (cont.) - interrupt times INTR ExternalINTRMAX ExternalINTRCount Total time the function was interrupted Max. time one function pass was interrupted Number of interrupts that occurred during the function run-time Hexagon-ETM Training 122
123 The following graphic give an overview how times are calculated: Start of measurement Entry to func1 Exit of func1 Entry to func1 func2 ExternalINTR of func1 External of func1 Internal of func1 Total of func1 Total of (root) TRAP1 func3 interrupt 1 Exit of func1 Entry to func1 Exit of func1 End of measurement Hexagon-ETM Training 123

![Func [/MergeCORE] Trace.Chart.](/docs-images/89/100150276/images/124-1.jpg "Func /CORE <n> Graphical display of nested function run-time analysis Analysis for all hardware")
124 Further Analysis Commands Legend solid black bar thin black line Function running Subfunction or TRAP handler running Trace.Chart.Func [/MergeCORE] Trace.Chart.Func /CORE <n> Graphical display of nested function run-time analysis Analysis for all hardware threads Graphical display of nested function run-time analysis Analysis for specified hardware thread Hexagon-ETM Training 124


125 Trace.STATistic.TREE [/MergeCORE] Trace.STATistic.TREE /CORE <n> Tree display of nested function run-time analysis Analysis for all hardware threads Tree display of nested function run-time analysis Analysis for specified hardware thread Hexagon-ETM Training 125


126 Trace.ListNesting [/MergeCORE] Nesting display of nested function run-time analysis Analysis for all hardware threads Hexagon-ETM Training 126

127 Cycle Statistic To perform a cycle statistic proceed as follows: 1. Activate cycle-accurate tracing. ETM.CycleAccurate ON Trace.CLOCK 600.MHZ 2. Start and stop the program execution to fill the trace repository. 3. Display the result. Trace.STATistic.CYcle List Summary Details For a description of the list summary and the details, see tables below. List Summary records time Description Number of records in the trace Time period recorded by the trace Hexagon-ETM Training 127
128 List Summary clocks flow cycles bus cycles cpi Description Number of clock cycles in the trace Number of ptrace packages 0 (no recording of bus cycles) Average clocks per instruction packet (cpi/6 average thread clock per instruction packet) Details flow execute flow read flow write bus fetch bus read bus write instr Description Number of cycles that executed instructions Number of cycles that performed a read access (not implemented yet) Number of cycles that performed a write access (not implemented yet) 0 (no recording of bus cycles) 0 (no recording of bus cycles) 0 (no recording of bus cycles) number of instruction packages slot instr fail cond pass cond fail branch dir branch indir branch load instr store instr Number of conditional instruction that failed (failed branch instructions included) Number of conditional instruction that passed (branch taken included) Number of failed branches Number of direct branches Number of indirect branches Number of load instructions (not implemented yet) Number of store instructions (not implemented yet) modify instr Hexagon-ETM Training 128
 Trace.STATistic.")
129 Details traps interrupts idles Description Number of traps Number of interrupts Number of idle states Wait instruction, under the assumption that the hardware thread put itself to idle state More the clock cycles without trace information core 0 Number of idle states for hardware thread 0 trace gaps Number of trace gaps (FIFOFULLs, filtered trace information ) Trace.STATistic.CYcle [/MergeCORE] Trace.STATistic.CYcle /CORE <n> Cycle statistic Analysis for all hardware threads Cycle statistic Analysis for specified hardware thread Analyzer.STATistic.CYcle /CORE 3 Hexagon-ETM Training 129
130 Filtering via the ETM Configuration Window Filtering means to reduce the generated trace information to the information of interest. Some basic filtering can be done via the ETM configuration window. ETM configuration ETM trace packet generation Trace repository* * trace memory of PowerTrace or ETB The following setups in the ETM configuration window can be done to reduce the generation of the trace information: ETM.state ETM.TraceTNUM <hardware_thread> ETM.TraceASID <asid> ETM.TraceTID <tid_number> <bitmask> Display the ETM configuration window Program the ETM to export the instruction flow only for the specified <hardware_thread> Program the ETM to export the instruction flow only for the specified <asid> Program the ETM to export the instruction flow only for the specified software thread(s) Hexagon-ETM Training 130

131 Hardware Thread Filter To restrict the exported instruction flow to the specified hardware thread proceed as follows: 1. Open the ETM configuration window and specify the hardware thread. 2. Start and stop the program execution. 3. Display the result. Trace.List Hexagon-ETM Training 131

132 Software Thread Filter To restrict the exported instruction flow to the specified software thread proceed as follows: 1. Open the ETM configuration window and specify the software thread. 2. Start and stop the program execution. 3. Display the result. Trace.List ASID Filter (no example available) Hexagon-ETM Training 132

133 Filtering/Triggering with Break.Set Filtering means to reduce the generation of trace information to the information of interest. Filtering helps to prevent TARGET FIFO OVERFLOWs and enables a more effective utilization of the trace memory. Triggering means to stop the recording to the trace repository. The following actions provide filters: TraceEnable TraceON TraceOFF Program the ETM to generate only trace information if the specified event matches. Program the ETM to start the generation of trace information if the specified event matches. Program the ETM to stop the generation of trace information if the specified event matches (restart possible). The following action provides triggers: TraceTrigger Stop the recording of trace information into the trace repository if the specified event matches (no restart possible). The stop can be delayed. Hexagon-ETM Training 133
134 The filter/trigger breakpoints and the filters provided by the ETM configuration window can be combined. Filter breakpoints ETM configuration ETM trace packet generation Trigger breakpoints Trace repository* * trace memory of PowerTrace or ETB Hexagon-ETM Training 134
135 TraceEnable Filter Standard Usage To illustrate the standard usage of the TraceEnable filter, the following examples are provided: Example 1: Program the ETM to export only trace information, if the instruction at a particular symbolic address is executed. Example 2: Program the ETM to export only trace information, if the instruction at a particular symbolic address is executed by a particular hardware thread. Example 3: Program the ETM to export only information about the instruction that writes to a particular variable. Example 1 Program the ETM to export only trace information, if the instruction at the symbolic address BLASTK_futex_wait is executed (etm_filter1.cmm). 1. Specify the event in the Break.Set dialog. - Specify the program address in the address / expression field. - Specify the type Program (default). - Specify the action TraceEnable. 2. Start and stop the program execution. 3. Display the result. Hexagon-ETM Training 135

136 Hexagon-ETM Training 136
137 Example 2 Program the ETM to export only trace information, if the instruction at the symbolic address BLASTK_writec is executed by hardware thread 0x0 (etm_filter2.cmm). 1. Specify the event in the Break.Set dialog. - Specify the program address in the address / expression field. - Specify the type Program (default). - Specify the action TraceEnable. 2. Specify hardware thread 0x0 in the ETM configuration window. 3. Start and stop the program execution. Hexagon-ETM Training 137

138 4. Display the result. Summary ; Export only the execution of the specified instruction packets ; (up to 8 single instructions or up to 4 instruction ranges) Break.Set <address> <range> /Program /TraceEnable Hexagon-ETM Training 138

139 Example 3 Program the ETM to export only information about the instruction that writes to the variable BLASTK_wait_mask (etm_filter3.cmm). 1. Specify the event in the Break.Set dialog. - Specify the data address in the address / expression field. Activate the HLL check box to specify the breakpoint for the complete address range of the variable. - Specify the type Write. - Specify the action TraceEnable. 2. Start and stop the program execution 3. Display the result. Hexagon-ETM Training 139
140 Summary ; Export only the instructions that perform the specified data access ; no data value allowed ; (up to 6 single address accesses or up to 3 access ranges) Break.Set <address> <range> /ReadWrite /Read /Write /TraceEnable Var.Break.Set <hll_expression> /ReadWrite /Read /Write /TraceEnable Hexagon-ETM Training 140

141 Statistical Evaluations To illustrate statistical evaluations, the following examples are provided: Example 1: Analyze the intervals of a particular function. Example 2: Analyze the time between function A and function B. Example 1: Time Interval of a Single Event Analyze the intervals of BLASTK_handle_trap0. 1. Program the ETM to export only the entry to the function BLASTK_handle_trap0. - Specify the program address in the address / expression field. - Specify the type Program (default). - Specify the action TraceEnable. 2. Start and stop the program execution. 3. Display the result. Trace.List Trace.STATistic.AddressDIStance BLASTK_handle_trap0 Hexagon-ETM Training 141


142 Example 2: Time between Two Events Analyze the time between BLASTK_mutex_lock and BLASTK_mutex_unlock. 1. Program the ETM to export only the entry to the functions BLASTK_mutex_lock and BLASTK_mutex_unlock. 2. Start and stop the program execution. 3. Display the result. Trace.List Trace.STATistic.AddressDURation BLASTK_mutex_lock \ BLASTK_mutex_unlock Hexagon-ETM Training 142
.")
143 TraceON/OFF Filter To illustrate the TraceON/OFF filter, the following example is provided: Program the ETM to start the exporting of trace information, whenever the instruction at the address BLASTK_puts_debug_buffer was executed. Program the ETM to stop the exporting of trace information, whenever the instruction at the address BLASTK_puts_debug_buffer+0x90 was executed (etm_filter4.cmm). 1. Open a source listing at the label BLASTK_puts_debug_buffer. ; List * List.Asm BLASTK_puts_debug_buffer Hexagon-ETM Training 143


144 2. Set a TraceON breakpoint to the instruction packet at the label BLASTK_puts_debug_buffer. 3. Set a TraceOFF breakpoint to the instruction packet at the address BLASTK_puts_debug_buffer Start and stop the program execution. Hexagon-ETM Training 144


145 5. Display the result. Trace.List Proceed as follows, if you want to search for the ON/OFF transitions: 1. Select the Trace.List window as active window. 2. Specify Enable for the global TRACE32 Find. Hexagon-ETM Training 145
146 Summary ; Export only the execution of the instructions between TraceON/TraceOFF ; (up to 2 pairs) Break.Set <address> <range> /Program /TraceON Break.Set <address> <range> /ReadWrite /Read /Write /TraceON Var.Break.Set <hll_expression> /ReadWrite /Read /Write /TraceON Break.Set <address> <range> /Program /TraceOFF Break.Set <address> <range> /ReadWrite /Read /Write /TraceOFF Var.Break.Set <hll_expression> /ReadWrite /Read /Write /TraceOFF Hexagon-ETM Training 146
147 TraceTrigger There are two use cases for TraceTrigger. To illustrate the two use cases, the following examples are provided: Example 1: A TraceTrigger can be used instead of a breakpoint, if it is not allowed to stop the program execution. Example 2: A TraceTrigger can be used to get the prologue and the epilog of an event in the trace. Example 1 Stop the trace recording after 0x24 was written as a byte to the variable BLASTK_wait_mask (etm_trigger1.cmm). 1. Specify the event in the Break.Set dialog. - Specify the data address in the address / expression field. Activate the HLL check box to specify the breakpoint for the complete address range of the variable. - Specify the type Write. - Specify DATA value and access width. - Specify the action TraceTrigger. 2. Start the program execution. green in the Trace State Field indicates that trace information is being captured running in the Debug State Field indicates that the program execution is running Hexagon-ETM Training 147
 to indicate that the recording to the trace repository is stopped.")
148 3. The recording to the trace repository is stopped soon after the event happened. - The state field in the Trace Configuration window changes to break (1) to indicate that the recording to the trace repository is stopped. - The Trace State field in the TRACE32 State Line changes to BRK accordingly (2). 1 2 Hexagon-ETM Training 148

149 4. Display the result. Please be aware that the result can only be displayed while the program execution is running if the program code was copied into the TRACE32 Virtual Memory before. Hexagon-ETM Training 149
150 Example 2 Stop the trace recording when a write access to the variable BLASTK_wait_mask occurred and another 50% of the trace repository was filled. Event 50% Trace repository 1. Specify the event in the Break.Set dialog. - Specify the data address in the address / expression field. Activate the HLL check box to specify the breakpoint for the complete address range of the variable. - Specify the type Write. - Specify the action TraceTrigger. Hexagon-ETM Training 150
151 2. Specify the fill of the trace repository after the event (TDelay counter). 3. Start the program execution. Hexagon-ETM Training 151
152 4. As soon as the event occurred - The state field in the Trace Configuration window changes to trigger (1). - The Trace State Field in the TRACE32 State Line changes to TRG accordingly (2). 1 2 Hexagon-ETM Training 152

153 5. As soon as the TDelay counter ran down - - The state field in the Trace Configuration window changes to break. - - The Trace State field in the TRACE32 State Line changes to BRK accordingly. Hexagon-ETM Training 153

154 6. After the TDelay counter elapsed the trace information can be displayed. Push Trigger in the Trace Goto dialog for the display of the trigger point. All records recorded after the trigger event have a positive record number. Summary ; Stop trace recording when the specified address is executed ; (up to 4 single instructions or up to 4 instruction ranges) Break.Set <address> <range> /Program /TraceTrigger ; Stop trace recording when the specified data access occurred ; (up 4 single data accesses or up to 2 data access ranges) Break.Set <address> <range> /ReadWrite /Read /Write /TraceTrigger Var.Break.Set <hll_expression> /ReadWrite /Read /Write /TraceTrigger Break.Set <address> <range> /<access> /Data.auto <data> /Data.Byte <data> /TraceTrigger Break.Set <address> <range> /<access> /Data.Word <data> /Data.Long <data> /TraceTrigger Var.Break.Set <hll_expression> /ReadWrite /Read /Write /Data.auto <data> /TraceTrigger ; Counter possible Break.Set <address> <range> /<access> <data_value> /TraceTrigger /COUNT <value> Var.Break.Set <hll_expression> /<access> <data_value> /TraceTrigger /COUNT <value> Hexagon-ETM Training 154
155 Filtering/Triggering via the ETM.Set The ETM.Set commands allow a low-level programming of the triggering/filtering resources of the ETM. The low-level programming of the ETM filters and trigger requires at least some basic knowledge about the so-called event resources provided by the Hexagon ETM. Please refer to your ETM Architecture Specification. The event resources consist basically of 4 trigger blocks and a three state sequencer. The low-level programming adds the following features: More sophisticated breakpoints than the Break.Set dialog. The sequencer allows to combine a series of events to form a breakpoint Hexagon-ETM Training 155

156 The ETM Registers The trigger block/sequencer configuration registers can be displayed as follows: Click Register to display the ETM configuration registers Click here to get details Trigger block 0 Hexagon-ETM Training 156

157 If the contents of an ETM configuration register is selected, the address and a short description of the ETM register is displayed in the TRACE32 state line. For detailed information on the particular register, refer to the ETM architecture specification. The ETM configuration registers can be read while the program execution is running. For an extensive usage of the ETM registers the following command is recommended: ; Display the ETM configuration registers ; - mark changes by color (SpotLight) ; - update register display while program execution is running ; (DualPort) ETM.Register, /SpotLight /DualPort Hexagon-ETM Training 157
158 Actions Based on Sequencer Level Most trigger/filters are programmed as follows: Specify the condition(s) for the trigger block(s) Specify the transitions for the sequencer Specify actions for sequencer level(s) ETM.Set TNUM T0 3. ETM.Set S0TO1 T0 ETM.Set STOP S1 The following graphic shows the relevant ETM.Set commands: Commands to program a trigger block ETM.Set Address ETM.Set Data ETM.Set COUNT ETM.Set ASID ETM.Set TID ETM.Set TNUM TO S0 Commands to trigger an action ETM.Set Trigger <seq_level> ETM.Set STOP <seq_level> ETM.Set EXTOUT <seq_level> T1 S1 ETM.Set INTERRUPT <seq_level> T2 T3 S2 Commands to change the sequencer level ETM.Set S0TO1 ETM.Set S0TO2 ETM.Set S1TO0 To illustrate actions based on sequencer level, the following examples are provided: Example 1: Stop the program execution if a value other than the specified one is written to the <variable X>. Example 2: Stop the program execution if a particular function was first executed by the hardware thread 1 and then by the hardware thread 3. Hexagon-ETM Training 158

159 Example 1 - Actions based on Sequencer Level Stop the program execution if a value other than 0x24 is written to the variable BLASTK_wait_mask (etm_set1.cmm). ; Display command history HISTory.type ETM.Register, /SpotLight /DualPort ; Reset all ETM registers ETM.Clear ; Sequencer level 0 is active after ETM.Clear ; Program the address range of the variable mutex_lock into the ; address comparator of the trigger block 0, specify write access ETM.Set Address T0 Write V.RANGE(BLASTK_wait_mask) Hexagon-ETM Training 159
160 ; Program the data!0x24 into the data comparator of the trigger block 0 ETM.Set Data T0!= 0x24 ; Change from sequencer level 0 to 1 if the event specified in trigger ; block 0 becomes true ETM.Set S0TO1 T0 ; Stop the program execution is sequencer level 1 is active ETM.Set STOP S1 Please be aware, that this program stop is a one time stop. In order to stop the program execution for the same condition again, the same programming sequence needs to be reprogrammed. Hexagon-ETM Training 160
161 Example 2 - Actions based on Sequencer Level Stop the program execution if the function BLASTK_futex_wait was first executed by the hardware thread 1 and then by the hardware thread 3 (etm_set2.cmm). ; Display command history HISTory.type ; Reset all ETM registers ETM.Clear ; sequencer level 0 is active after ETM.Clear ; Program the start address of the function BLASTK_writec into the ; address comparator of the trigger block 0 ETM.Set Address T0 Program BLASTK_futex_wait ; Program the hardware thread 0 into the TNUM comparator of the trigger ; block 0 ETM.Set TNUM T0 1. ; Change from sequencer level 0 to 1 if the event specified in trigger ; block 0 becomes true ETM.Set S0TO1 T0 ; Program the start address of the function BLASTK_writec into the ; address comparator of the trigger block 1 ETM.Set Address T1 Program BLASTK_futex_wait ; Program the hardware thread 3 into the TNUM comparator of the trigger ; block 1 ETM.Set TNUM T1 3. ; Change from sequencer level 1 to 2 if the event specified in trigger ; block 1 becomes true ETM.Set S1TO2 T1 ; Stop the program execution is sequencer level 2 is active ETM.Set STOP S2 Hexagon-ETM Training 161
162 Actions Based on Sequencer Level and Condition Some trigger/filters are programmed as follows: Specify the condition(s) for the trigger block(s) Specify the transitions for the sequencer Specify actions for sequencer level(s) and condition ETM.Set TNUM T0 3. ETM.Set Filter T0 S0 The following graphic shows the relevant ETM.Set commands: Commands to program a trigger block Commands to trigger an action ETM.Set Address ETM.Set Data ETM.Set COUNT ETM.Set ASID ETM.Set TID ETM.Set TNUM TO S0 ETM.Set Filter <trigger_block> <seq_level> ETM.Set CountReload <trigger_block> <seq_level> T1 S1 T2 T3 S2 Commands to change the sequencer level ETM.Set S0TO1 ETM.Set S0TO2 ETM.Set S1TO0 To illustrate actions based on sequencer level and condition, the following examples are provided: Example 1: Program the ETM to export only trace information for <hardware_thread_x> and <hardware_thread_y>. Example 2: Program the ETM to export five times the entry to the <function_x> and one time the entry to the <function_y> repeatedly. Example 3: Stop the program execution after the <function_x> was called 10. times by hardware thread 0. Export only the function call. Hexagon-ETM Training 162
163 Example 1 - Actions based on Sequencer Level and Condition Program the ETM to export only trace information for hardware thread 0x0 and hardware thread 0x3 (etm_set3.cmm). ETM.Clear ETM.Set TNUM T0 0x0 ETM.Set TNUM T1 0x3 ETM.Set Filter T0 ALL ETM.Set Filter T1 ALL ; Reset all ETM registers ; Program the hardware thread 0x0 ; into the TNUM comparator of the ; trigger block 0 ; Program the hardware thread 0x3 ; into the TNUM comparator of the ; trigger block 1 ; Export trace information in ; all sequencer levels if the ; condition specified for trigger ; block 0 is true ; Export trace information in ; all sequencer levels if the ; condition specified for trigger ; block 1 is true Hexagon-ETM Training 163
164 Example 2 - Actions based on Sequencer Level and Condition Program the ETM to export five times the entry to the function blast_mutex_unlock and one time the entry to the function blast_mutex_lock repeatedly (etm_set4.cmm). ; Reset all ETM registers ETM.Clear ; sequencer level 0 is active after ETM.Clear ; Program the start address of the function blast_mutex_unlock into the ; address comparator of the trigger block 0 ; Export the start address of the function blast_mutex_unlock if ; sequencer level 0 is active (alternative way to ETM.Set Filter ) ETM.Set Address T0 Program blast_mutex_unlock S0 ; Program the counter of trigger block 0 to 5. ETM.Set Count T0 5. ; Change from sequencer level 0 to 1 if the event specified in trigger ; block 0 becomes true ETM.Set S0TO1 T0 ; Program the start address of the function blast_mutex_lock into the ; address comparator of the trigger block 1 ; Export the start address of the function blast_mutex_lock if ; sequencer level 1 is active (alternative way to ETM.Set Filter ) ETM.Set Address T1 Program blast_mutex_lock S1 ; Change from sequencer level 1 to 0 if the event specified in trigger ; block 1 becomes true ETM.Set S1TO0 T1 ; Reload all counters if the event specified in trigger block 1 becomes ; true in the sequencer level 1 ETM.Set CountReload T1 S1 Hexagon-ETM Training 164
165 Example 3 - Actions based on Sequencer Level and Condition Stop the program execution after the function BLASTK_writec was called 10. times by hardware thread 0. Export only the function call (etm_set5.cmm). ; Display command history HISTory.type ; Reset all ETM registers ETM.Clear ; sequencer level 0 is active after ETM.Clear ; Program the start address of the function BLASTK_writec into the ; address comparator of the trigger block 0 ; Export this instruction as long as the sequencer level 0 is ; active ETM.Set Address T0 Program BLASTK_writec S0 ; Program the hardware thread 0 into the TNUM comparator of the trigger ; block 0 ETM.Set TNUM T0 0. ; Program the event counter of trigger block 0 with 10. ETM.Set Count T0 10. ; Change from sequencer level 0 to 1 if the event specified in trigger ; block 0 becomes true ETM.Set S0TO1 T0 ; Stop the program execution is sequencer level 1 is active ETM.Set STOP S1 ; Display the result Trace.List Hexagon-ETM Training 165
166 Benchmark Counters Introduction The ETM provides six 16-bit counters which can count one of the following events: DCMISS DCCONFLICT ICMISS ICSTALL ITLBMISS DTLBMISS STALLS data cache misses data cache conflicts instruction cache misses instruction cache stall-cycles itlb misses dtlb misses all stall cycles TRACE32 PowerView enables you: to count the occurrence of up to six events summarized for all hardware threads (BMC.SPLIT OFF). to count the occurrence of a single event separately for each hardware thread (BMC.SPLIT ON). The counters count their assigned event for a fixed number of clock cycles. Profile packets containing the current counter values are exported by the ETM after this fixed number of cycles. Hexagon-ETM Training 166

167 The benchmark counters, the filters provided by the ETM configuration window and the filter breakpoints can be combined. Benchmark counters Filter breakpoints ETM configuration ETM trace packet generation Trace repository* * trace memory of PowerTrace or ETB Hexagon-ETM Training 167
168 Standard Examples To illustrate the handling of benchmark counters, the following examples are provided: Example 1: Count the total number of stall cycles and the number of instruction cache stall cycles summarized for all cores. Export this information every n clock cycles. Example 2: Count the total number of stall cycles separately for each hardware thread. Export this information every n clock cycles. Example 3: Count the instruction cache misses for hardware thread 0. Inspect the peak areas. Example 4: Count the total number of stalls between the entry to a particular function and the instruction at a particular address. Example 1 - Benchmark Counters Count the total number of stall cycles and the number of instruction cache stall cycles summarized for all cores. Export this information every 500. clock cycles. 1. Open the benchmark counter configuration window. BMC.state 2. Configure the benchmark counters. - Counter0 counts the total number of stall cycles - Counter1 counts the number of instruction cache stall cycles Hexagon-ETM Training 168
169 3. Specify the exporting rate. - The counter contents are exported by the ETM all 500 clock cycles. 4. Enable the TRACE32 BenchMark Counter functionality (BMC.ON). 5. Start and stop the program execution. Hexagon-ETM Training 169

170 6. Display the result. Trace.List Counter0 Counter1 DEFault Push the More button to get the counter display Hexagon-ETM Training 170
171 Example 2 - Benchmark Counters Count the total number of stall cycles separately for each hardware thread. Export this information all 500. clock cycles. 1. Open the benchmark counter configuration window. BMC.state 2. Activate the SPLIT option to program the ETM to count the specified event separately for each hardware thread. Hexagon-ETM Training 171
172 3. Configure the benchmark counter Counter0. - Counter0 counts the total number of stall cycles 4. Specify the exporting rate. - The counter contents are exported all 500 clock cycles. 5. Enable the TRACE32 BenchMark Counter functionality (BMC.ON) 6. Start and stop the program execution. 7. Display the result. Trace.List Counter0 Counter1 DEFault Hexagon-ETM Training 172

173 Push the More button to get the counter display Hexagon-ETM Training 173
174 Example 3 - Benchmark Counters Count the instruction cache misses for hardware thread 0. Inspect the peak areas. 1. Configure the benchmark counter. BMC.state - Program the ETM to count the specified event for each hardware thread separately (BMC.SPLIT ON) - Specify that Counter0 counts Instruction Cache Misses - The counter contents is exported all 500. clock cycles - Enable the TRACE32 BenchMark Counter functionality (BMC.ON) 2. Program the ETM to export trace information only for hardware thread 0. ETM.state 3. Start and stop the program execution. Hexagon-ETM Training 174

175 4. Display the result. Push Counter0 in the draw field to get a graphical display of the counter values Use the zoom buttons in the display Hexagon-ETM Training 175

176 5. Open a trace listing to inspect peak areas. Trace.List /Track Hexagon-ETM Training 176
177 6. Reset all settings when you are done with your test. Hexagon-ETM Training 177

 3. Start and stop the program execution. 4. Display the result. 5.")
178 Example 4 - Benchmark Counters Count the total number of stalls between the entry to the function BLASTK_writec and the instruction at address BLASTK_mutex_unlock+0x0C. 1. Specify TraceON/TraceOFF breakpoints for the program range of interest. 2. Configure the benchmark counters. - Counter0 counts the total number of stalls - The counter contents is exported all 100. clock cycles. - Enable the TRACE32 BenchMark Counter functionality (BMC.ON) 3. Start and stop the program execution. 4. Display the result. 5. Reset the benchmark counters and delete the breakpoints when you are done with your test. Hexagon-ETM Training 178
179 Function Run-time Analysis - Cache Misses/Stalls Function run-times increase with the number of stalls or/and cache misses. It makes sense to check such events. Example Analyze the number of Instruction Cache Misses for all function. 1. Configure the Benchmark Counter. BMC.state ; Open the benchmark counter ; configuration window - Program the ETM to count the specified event for each hardware thread separately (BMC.SPLIT ON) - Specify Instruction Cache Misses for Counter0. - The counter contents is exported all 500 clock cycles. - Enable the TRACE32 BenchMark Counter functionality (BMC.ON) - SELect Counter0 as source for the benchmark counter statistic. 2. Start and stop the program execution. Hexagon-ETM Training 179

180 3. Display the result. BMC.STATistic.sYmbol For a description of the list summary and the columns, see tables below. List Summary item total samples number of recorded functions/symbol regions total number of stalls during measurement period number of recorded profiling packets Columns with function details address total min max avr count ratio function name/name of symbol region (other) program sections that can not be assigned to a function total number of stalls for the function during the recorded period smallest number of stalls in a continuous address range of the function largest number of stalls in a continuous address range of the function average number of stalls in a continuous address range of the function number of new entries into the address range of the function/symbol region (start address executed) ratio of stalls for the function with regards to the total number of stalls Hexagon-ETM Training 180
181 Background bb e8 Profiling packet number of stalls is evenly split up on all instructions executed between 2 profiling packets Profiling packet e1 Profiling packet Hexagon-ETM Training 181
. ETM configuration The filter and trigger breakpoints [0..n.1] The filter and trigger set via the ETM.")
182 Summary: Trigger and Filter A set of functions has an effect on the ETM trace packet generation. But at the end all these functions are using the same resources (the four trigger blocks and the sequencer provided by the ETM). ETM configuration The filter and trigger breakpoints [0..n.1] The filter and trigger set via the ETM.Set command ETM trace packet generation The benchmark counters In the case of a resource conflict, prioritization is done as follows: 1. ETM.Set commands 2. Break.Set commands 3. Benchmark counters Please do not program the ETM resources via Data.Set PER.Set.simple TRACE32 may overwrite your settings. Hexagon-ETM Training 182
183 Appendix A The Calibration of the Recording Tool TRACE32 provide the AutoFocus button in the Trace configuration window to calibrate the recording tool. Trace.AutoFocus In order to perform the calibration TRACE32 loads a test program to the memory addressed by the PC or the stack pointer. It is also possible to define an <address_range> for the test program. If the calibration is performed successfully, the following message will be displayed: Frequencies smaller then 6 MHz result in f=0.0 MHz, since the frequency is maintained by TRACE32 as an integer. Hexagon-ETM Training 183
 Trace.")
184 The ShowFocus button in the Trace configuration window allows to inspect the result of the calibration. Data channel delay Sampling points (red lines) Trace.ShowFocus Hexagon-ETM Training 184

185 Calibration Problems If the calibration of the recording tool fails, the following error message is displayed: The TRACE32 message area displays further diagnosis information. AREA.view Hexagon-ETM Training 185


186 If the diagnosis information of TRACE32 is not sufficient to identify the problem, make sure that the following preconditions are fulfilled before you start a more detailed diagnosis: The ETM is enabled on your target board. The ETM pins are enabled on your target board. A helpful tool for further diagnosis can be the Trace.ShowFocusEye window. Push Scan to get diagnosis data Push Channel to check the data eyes of the trace channels The recording tools can not dectect a data eye for TP11 Hexagon-ETM Training 186
Intel Processor Trace Training
 Intel Processor Trace Training TRACE32 Online Help TRACE32 Directory TRACE32 Index TRACE32 Training... Training Intel x86/x64... Intel Processor Trace Training... 1 Protocol Description... 5 Basic Trace
TRACE32 Training... Training AURIX... AURIX Trace Training... 1
 AURIX Trace Training TRACE32 Online Help TRACE32 Directory TRACE32 Index TRACE32 Training... Training AURIX... AURIX Trace Training... 1 Basic Knowledge... 6 Protocol Description 6 Source for the Recorded
Application Note for the SNOOPer Trace
 Application Note for the SNOOPer Trace TRACE32 Online Help TRACE32 Directory TRACE32 Index TRACE32 Documents... Trace Analysis... Trace Application Notes... Application Note for the SNOOPer Trace... 1
TRACE32 Training... Training ARM-ETM... ARM-ETM Training... 1
 ARM-ETM Training TRACE32 Online Help TRACE32 Directory TRACE32 Index TRACE32 Training... Training ARM-ETM... ARM-ETM Training... 1 ETM Setup... 5 ETM Versions 5 Main Setup Windows 6 ETM.state Window 6
ARM Application Note for MXC Chips
 ARM Application Note for MXC Chips TRACE32 Online Help TRACE32 Directory TRACE32 Index TRACE32 Documents... ICD In-Circuit Debugger... Processor Architecture Manuals... ARM/CORTEX/XSCALE... ARM Application
Application Note for the Trace.Find Command
 Application Note for the Trace.Find Command TRACE32 Online Help TRACE32 Directory TRACE32 Index TRACE32 Documents... Trace Analysis... Trace Application Notes... Application Note for the Trace.Find Command...
ARM-ETM RTS User s Guide
 ARM-ETM RTS User s Guide TRACE32 Online Help TRACE32 Directory TRACE32 Index TRACE32 Documents... ICD In-Circuit Debugger... Processor Architecture Manuals... ARM/CORTEX/XSCALE... ARM-ETM RTS User's Guide...
TRACE32 Debugger Getting Started... ICD Tutorial About the Tutorial... 2
 ICD Tutorial TRACE32 Online Help TRACE32 Directory TRACE32 Index TRACE32 Debugger Getting Started... ICD Tutorial... 1 About the Tutorial... 2 Working with the Debugger... 3 Set up the Program Environment
RTOS Debugger for RTX-ARM
 RTOS Debugger for RTX-ARM TRACE32 Online Help TRACE32 Directory TRACE32 Index TRACE32 Documents... RTOS Debuggers... RTOS Debugger for RTX-ARM... 1 Overview... 2 Brief Overview of Documents for New Users...
RTOS Debugger for ThreadX
 RTOS Debugger for ThreadX TRACE32 Online Help TRACE32 Directory TRACE32 Index TRACE32 Documents... RTOS Debuggers... RTOS Debugger for ThreadX... 1 Overview... 3 Brief Overview of Documents for New Users...
TDT 1.2 Release Notes and FAQ March 2002
 TDT 1.2 Release Notes and FAQ March 2002 This document gives additional information about the use of the ARM Trace Debug Tools TDT 1.2 (build 1031) For more information, please see the Trace Debug Tools
Visual Profiler. User Guide
 Visual Profiler User Guide Version 3.0 Document No. 06-RM-1136 Revision: 4.B February 2008 Visual Profiler User Guide Table of contents Table of contents 1 Introduction................................................
Training Simulator and Demo Software
 Training Simulator and Demo Software TRACE32 Online Help TRACE32 Directory TRACE32 Index TRACE32 Training... Training Simulator and Demo Software... 1 About the Demo... 2 Starting the TRACE32 Simulator...
OS Awareness Manual Sciopta
 OS Awareness Manual Sciopta TRACE32 Online Help TRACE32 Directory TRACE32 Index TRACE32 Documents... OS Awareness Manuals... OS Awareness Manual Sciopta... 1 History... 2 Overview... 2 Brief Overview of
RTOS Debugger for ChibiOS/RT
 RTOS Debugger for ChibiOS/RT TRACE32 Online Help TRACE32 Directory TRACE32 Index TRACE32 Documents... RTOS Debuggers... RTOS Debugger for ChibiOS/RT... 1 Overview... 3 Brief Overview of Documents for New
OS Awareness Manual OSEK/ORTI
 OS Awareness Manual OSEK/ORTI TRACE32 Online Help TRACE32 Directory TRACE32 Index TRACE32 Documents... OS Awareness Manuals... OS Awareness for OSEK/ORTI... OS Awareness Manual OSEK/ORTI... 1 History...
AutoFocus User s Guide
 AutoFocus User s Guide TRACE32 Online Help TRACE32 Directory TRACE32 Index TRACE32 Documents... AutoFocus User's Guide... 1 Introduction... 4 Intended Audience 4 Prerequisites 4 Contacting Support 5 Installation...
ARM-ETM Programming Dialog
 ARM-ETM Programming Dialog TRACE32 Online Help TRACE32 Directory TRACE32 Index TRACE32 Documents... ICD In-Circuit Debugger... Processor Architecture Manuals... ARM/CORTEX/XSCALE... ARM-ETM Programming
RTOS Debugger for CMX
 RTOS Debugger for CMX TRACE32 Online Help TRACE32 Directory TRACE32 Index TRACE32 Documents... RTOS Debuggers... RTOS Debugger for CMX... 1 Overview... 2 Brief Overview of Documents for New Users... 3
RTOS Debugger for MicroC/OS-III
 RTOS Debugger for MicroC/OS-III TRACE32 Online Help TRACE32 Directory TRACE32 Index TRACE32 Documents... RTOS Debuggers... RTOS Debugger for MicroC/OS-III... 1 Overview... 2 Brief Overview of Documents
RTOS Debugger for FreeRTOS
 RTOS Debugger for FreeRTOS TRACE32 Online Help TRACE32 Directory TRACE32 Index TRACE32 Documents... RTOS Debuggers... RTOS Debugger for FreeRTOS... 1 Overview... 2 Brief Overview of Documents for New Users...
TRACE32 Glossary Terms, Abbreviations, and Definitions... 2
 TRACE32 Glossary TRACE32 Online Help TRACE32 Directory TRACE32 Index TRACE32 Glossary... 1 Terms, Abbreviations, and Definitions... 2 Terms with Explanations and Examples... 4 Access Classes 4 Build Path
OS Awareness Manual OSE Epsilon
 OS Awareness Manual OSE Epsilon TRACE32 Online Help TRACE32 Directory TRACE32 Index TRACE32 Documents... OS Awareness Manuals... OS Awareness Manual OSE Epsilon... 1 History... 2 Overview... 2 Brief Overview
Chapter 8: Memory- Management Strategies. Operating System Concepts 9 th Edition
 Chapter 8: Memory- Management Strategies Operating System Concepts 9 th Edition Silberschatz, Galvin and Gagne 2013 Chapter 8: Memory Management Strategies Background Swapping Contiguous Memory Allocation
Changing the Embedded World TM. Module 3: Getting Started Debugging
 Changing the Embedded World TM Module 3: Getting Started Debugging Module Objectives: Section 1: Introduce Debugging Techniques Section 2: PSoC In-Circuit Emulator (ICE) Section 3: Hands on Debugging a
MCUXpresso IDE Instruction Trace Guide. Rev May, 2018 User guide
 MCUXpresso IDE Instruction Trace Guide User guide 14 May, 2018 Copyright 2018 NXP Semiconductors All rights reserved. ii 1. Trace Overview... 1 1.1. Instruction Trace Overview... 1 1.1.1. Supported Targets...
NEW CEIBO DEBUGGER. Menus and Commands
 NEW CEIBO DEBUGGER Menus and Commands Ceibo Debugger Menus and Commands D.1. Introduction CEIBO DEBUGGER is the latest software available from Ceibo and can be used with most of Ceibo emulators. You will
CHAPTER 8 - MEMORY MANAGEMENT STRATEGIES
 CHAPTER 8 - MEMORY MANAGEMENT STRATEGIES OBJECTIVES Detailed description of various ways of organizing memory hardware Various memory-management techniques, including paging and segmentation To provide
Q.1 Explain Computer s Basic Elements
 Q.1 Explain Computer s Basic Elements Ans. At a top level, a computer consists of processor, memory, and I/O components, with one or more modules of each type. These components are interconnected in some
Chapter 8: Memory-Management Strategies
 Chapter 8: Memory-Management Strategies Chapter 8: Memory Management Strategies Background Swapping Contiguous Memory Allocation Segmentation Paging Structure of the Page Table Example: The Intel 32 and
Common Computer-System and OS Structures
 Common Computer-System and OS Structures Computer System Operation I/O Structure Storage Structure Storage Hierarchy Hardware Protection General System Architecture Oct-03 1 Computer-System Architecture
General Commands Reference Guide H
 General Commands Reference Guide H TRACE32 Online Help TRACE32 Directory TRACE32 Index TRACE32 Documents... General Commands... General Commands Reference Guide H... 1 HAnalyzer... 4 HAnalyzer tbd. 4 HAnalyzer-specific
file://c:\documents and Settings\degrysep\Local Settings\Temp\~hh607E.htm
 Page 1 of 18 Trace Tutorial Overview The objective of this tutorial is to acquaint you with the basic use of the Trace System software. The Trace System software includes the following: The Trace Control
Chapter-6. SUBJECT:- Operating System TOPICS:- I/O Management. Created by : - Sanjay Patel
 Chapter-6 SUBJECT:- Operating System TOPICS:- I/O Management Created by : - Sanjay Patel Disk Scheduling Algorithm 1) First-In-First-Out (FIFO) 2) Shortest Service Time First (SSTF) 3) SCAN 4) Circular-SCAN
Chapter 8: Main Memory. Operating System Concepts 9 th Edition
 Chapter 8: Main Memory Silberschatz, Galvin and Gagne 2013 Chapter 8: Memory Management Background Swapping Contiguous Memory Allocation Segmentation Paging Structure of the Page Table Example: The Intel
RTOS Debugger for MicroC/OS-II
 RTOS Debugger for MicroC/OS-II TRACE32 Online Help TRACE32 Directory TRACE32 Index TRACE32 Documents... RTOS Debuggers... RTOS Debugger for MicroC/OS-II... 1 Overview... 3 Brief Overview of Documents for
Chapter 8: Main Memory
 Chapter 8: Main Memory Silberschatz, Galvin and Gagne 2013 Chapter 8: Memory Management Background Swapping Contiguous Memory Allocation Segmentation Paging Structure of the Page Table Example: The Intel
Memory management. Last modified: Adaptation of Silberschatz, Galvin, Gagne slides for the textbook Applied Operating Systems Concepts
 Memory management Last modified: 26.04.2016 1 Contents Background Logical and physical address spaces; address binding Overlaying, swapping Contiguous Memory Allocation Segmentation Paging Structure of
Tracking the Virtual World
 Tracking the Virtual World Synopsys: For many years the JTAG interface has been used for ARM-based SoC debugging. With this JTAG style debugging, the developer has been granted the ability to debug software
PAGE REPLACEMENT. Operating Systems 2015 Spring by Euiseong Seo
 PAGE REPLACEMENT Operating Systems 2015 Spring by Euiseong Seo Today s Topics What if the physical memory becomes full? Page replacement algorithms How to manage memory among competing processes? Advanced
RTOS Debugger for QNX - Run Mode
 RTOS Debugger for QNX - Run Mode TRACE32 Online Help TRACE32 Directory TRACE32 Index TRACE32 Documents... RTOS Debuggers... RTOS Debugger for QNX - Run Mode... 1 Basic Concepts... 2 pdebug... 2 Switching
OS Awareness Manual OSE Delta
 OS Awareness Manual OSE Delta TRACE32 Online Help TRACE32 Directory TRACE32 Index TRACE32 Documents... OS Awareness Manuals... OS Awareness Manual OSE Delta... 1 History... 3 Overview... 3 Brief Overview
CSE 120. Translation Lookaside Buffer (TLB) Implemented in Hardware. July 18, Day 5 Memory. Instructor: Neil Rhodes. Software TLB Management
 Implemented in Hardware. July 18, Day 5 Memory. Instructor: Neil Rhodes. Software TLB Management") CSE 120 July 18, 2006 Day 5 Memory Instructor: Neil Rhodes Translation Lookaside Buffer (TLB) Implemented in Hardware Cache to map virtual page numbers to page frame Associative memory: HW looks up in
CSE 120 July 18, 2006 Day 5 Memory Instructor: Neil Rhodes Translation Lookaside Buffer (TLB) Implemented in Hardware Cache to map virtual page numbers to page frame Associative memory: HW looks up in
Chapter 7: Main Memory. Operating System Concepts Essentials 8 th Edition
 Chapter 7: Main Memory Operating System Concepts Essentials 8 th Edition Silberschatz, Galvin and Gagne 2011 Chapter 7: Memory Management Background Swapping Contiguous Memory Allocation Paging Structure
ARM Processors for Embedded Applications
 ARM Processors for Embedded Applications Roadmap for ARM Processors ARM Architecture Basics ARM Families AMBA Architecture 1 Current ARM Core Families ARM7: Hard cores and Soft cores Cache with MPU or
Integration for CodeBlocks
 Integration for CodeBlocks TRACE32 Online Help TRACE32 Directory TRACE32 Index TRACE32 Documents... 3rd Party Tool Integrations... Integration for CodeBlocks... 1 Overview... 2 Supported Code::Blocks versions...
Programming in the MAXQ environment
 AVAILABLE The in-circuit debugging and program-loading features of the MAXQ2000 microcontroller combine with IAR s Embedded Workbench development environment to provide C or assembly-level application
ARM CORTEX-R52. Target Audience: Engineers and technicians who develop SoCs and systems based on the ARM Cortex-R52 architecture.
 ARM CORTEX-R52 Course Family: ARMv8-R Cortex-R CPU Target Audience: Engineers and technicians who develop SoCs and systems based on the ARM Cortex-R52 architecture. Duration: 4 days Prerequisites and related
This section covers the MIPS instruction set.
 This section covers the MIPS instruction set. 1 + I am going to break down the instructions into two types. + a machine instruction which is directly defined in the MIPS architecture and has a one to one
1 Introduction to MARS
 1 Introduction to MARS 1.1 Objectives After completing this lab, you will: Get familiar with the MARS simulator Learn how to assemble, run, and debug a MIPS program 1.2 The MARS Simulator MARS, the MIPS
Integration for CodeWright
 Integration for CodeWright TRACE32 Online Help TRACE32 Directory TRACE32 Index TRACE32 Documents... 3rd Party Tool Integrations... Integration for CodeWright... 1 Overview... 2 Brief Overview of Documents
4 DEBUGGING. In This Chapter. Figure 2-0. Table 2-0. Listing 2-0.
 4 DEBUGGING Figure 2-0. Table 2-0. Listing 2-0. In This Chapter This chapter contains the following topics: Debug Sessions on page 4-2 Code Behavior Analysis Tools on page 4-8 DSP Program Execution Operations
April 4, 2001: Debugging Your C24x DSP Design Using Code Composer Studio Real-Time Monitor
 1 This presentation was part of TI s Monthly TMS320 DSP Technology Webcast Series April 4, 2001: Debugging Your C24x DSP Design Using Code Composer Studio Real-Time Monitor To view this 1-hour 1 webcast
Contents. Cortex M On-Chip Emulation. Technical Notes V
 _ Technical Notes V9.12.225 Cortex M On-Chip Emulation Contents Contents 1 1 Introduction 2 2 Access Breakpoints 3 3 Trace 5 4 NXP LPC 5 4.1 Boot and Memory Remapping 5 4.2 LPC17xx Startup 5 4.1 LPC11A02/04
General Commands Reference Guide O
 General Commands Reference Guide O TRACE32 Online Help TRACE32 Directory TRACE32 Index TRACE32 Documents... General Commands... General Commands Reference Guide O... 1 OCP... 4 OCP OpenCoreProtocol WatchPoint
MPLAB SIM. MPLAB IDE Software Simulation Engine Microchip Technology Incorporated MPLAB SIM Software Simulation Engine
 MPLAB SIM MPLAB IDE Software Simulation Engine 2004 Microchip Technology Incorporated MPLAB SIM Software Simulation Engine Slide 1 Welcome to this web seminar on MPLAB SIM, the software simulator that
The control of I/O devices is a major concern for OS designers
 Lecture Overview I/O devices I/O hardware Interrupts Direct memory access Device dimensions Device drivers Kernel I/O subsystem Operating Systems - June 26, 2001 I/O Device Issues The control of I/O devices
CHAPTER 8: MEMORY MANAGEMENT. By I-Chen Lin Textbook: Operating System Concepts 9th Ed.
 CHAPTER 8: MEMORY MANAGEMENT By I-Chen Lin Textbook: Operating System Concepts 9th Ed. Chapter 8: Memory Management Background Swapping Contiguous Memory Allocation Segmentation Paging Structure of the
Chapter 8: Main Memory
 Chapter 8: Main Memory Chapter 8: Memory Management Background Swapping Contiguous Memory Allocation Segmentation Paging Structure of the Page Table Example: The Intel 32 and 64-bit Architectures Example:
Memory Management Prof. James L. Frankel Harvard University
 Memory Management Prof. James L. Frankel Harvard University Version of 5:42 PM 25-Feb-2017 Copyright 2017, 2015 James L. Frankel. All rights reserved. Memory Management Ideal memory Large Fast Non-volatile
CS370 Operating Systems
 CS370 Operating Systems Colorado State University Yashwant K Malaiya Spring 2018 L20 Virtual Memory Slides based on Text by Silberschatz, Galvin, Gagne Various sources 1 1 Questions from last time Page
TRACE APPLICATION NOTE VERSION MB86R0X 'JADE' SERIES DEVICES & GREENHILLS TOOLCHAIN. Fujitsu Microelectronics Europe Application Note
 Fujitsu Microelectronics Europe Application Note an-mb86r0x-trace-rev0-02.doc TRACE MB86R0X 'JADE' SERIES DEVICES & GREENHILLS TOOLCHAIN APPLICATION NOTE VERSION 0.02 21.05.2010 Revision History Revision
ASSEMBLY LANGUAGE MACHINE ORGANIZATION
 ASSEMBLY LANGUAGE MACHINE ORGANIZATION CHAPTER 3 1 Sub-topics The topic will cover: Microprocessor architecture CPU processing methods Pipelining Superscalar RISC Multiprocessing Instruction Cycle Instruction
Trace Getting Started V8.02
 Trace Getting Started V8.02 1. Introduction This paper helps the user to entirely exploit the trace and troubleshoot most often situations that the developer is confronted with while debugging the application.
Operating Systems. 09. Memory Management Part 1. Paul Krzyzanowski. Rutgers University. Spring 2015
 Operating Systems 09. Memory Management Part 1 Paul Krzyzanowski Rutgers University Spring 2015 March 9, 2015 2014-2015 Paul Krzyzanowski 1 CPU Access to Memory The CPU reads instructions and reads/write
Control Hazards. Branch Prediction
 Control Hazards The nub of the problem: In what pipeline stage does the processor fetch the next instruction? If that instruction is a conditional branch, when does the processor know whether the conditional
Chapter 8: Memory- Management Strategies. Operating System Concepts 9 th Edition
 Chapter 8: Memory- Management Strategies Operating System Concepts 9 th Edition Silberschatz, Galvin and Gagne 2013 Chapter 8: Memory Management Strategies Background Swapping Contiguous Memory Allocation
Chapter 8: Memory- Management Strategies
 Chapter 8: Memory Management Strategies Chapter 8: Memory- Management Strategies Background Swapping Contiguous Memory Allocation Segmentation Paging Structure of the Page Table Example: The Intel 32 and
Chapter 12. CPU Structure and Function. Yonsei University
 Chapter 12 CPU Structure and Function Contents Processor organization Register organization Instruction cycle Instruction pipelining The Pentium processor The PowerPC processor 12-2 CPU Structures Processor
Hypervisor Awareness for Wind River Hypervisor
 Hypervisor Awareness for Wind River Hypervisor TRACE32 Online Help TRACE32 Directory TRACE32 Index TRACE32 Documents... Hypervisor Support... Hypervisor Awareness for Wind River Hypervisor... 1 Overview...
Codewarrior for ColdFire (Eclipse) 10.0 Setup
 10.0 Setup") Codewarrior for ColdFire (Eclipse) 10.0 Setup 1. Goal This document is designed to ensure that your Codewarrior for Coldfire v10.0 environment is correctly setup and to orient you to it basic functionality
Codewarrior for ColdFire (Eclipse) 10.0 Setup 1. Goal This document is designed to ensure that your Codewarrior for Coldfire v10.0 environment is correctly setup and to orient you to it basic functionality
TrueView Queue Manual. Embedded for Axis IP cameras version 1.x Copyright 2014 Cognimatics
 TrueView Queue Manual Embedded for Axis IP cameras version 1.x Copyright 2014 Cognimatics 1 Table of Contents Table of Contents... 2 Overview... 3 Mounting the camera... 4 Installing the software... 4
Development Tools. 8-Bit Development Tools. Development Tools. AVR Development Tools
 Development Tools AVR Development Tools This section describes some of the development tools that are available for the 8-bit AVR family. Atmel AVR Assembler Atmel AVR Simulator IAR ANSI C-Compiler, Assembler,
Virtual Memory III. Jo, Heeseung
 Virtual Memory III Jo, Heeseung Today's Topics What if the physical memory becomes full? Page replacement algorithms How to manage memory among competing processes? Advanced virtual memory techniques Shared
Memory Management. To improve CPU utilization in a multiprogramming environment we need multiple programs in main memory at the same time.
 Memory Management To improve CPU utilization in a multiprogramming environment we need multiple programs in main memory at the same time. Basic CPUs and Physical Memory CPU cache Physical memory
Chapter 8 & Chapter 9 Main Memory & Virtual Memory
 Chapter 8 & Chapter 9 Main Memory & Virtual Memory 1. Various ways of organizing memory hardware. 2. Memory-management techniques: 1. Paging 2. Segmentation. Introduction Memory consists of a large array
Getting Started with Red Trace
 Getting Started with Red Trace Getting Started with Red Trace Red Suite 5 Version 5.1.2 Getting Started with Red Trace 16 April, 2013 Copyright 2012-2013 Code Red Technologies, Inc All rights reserved.
CS307: Operating Systems
 CS307: Operating Systems Chentao Wu 吴晨涛 Associate Professor Dept. of Computer Science and Engineering Shanghai Jiao Tong University SEIEE Building 3-513 wuct@cs.sjtu.edu.cn Download Lectures ftp://public.sjtu.edu.cn
TRACE32 Documents... ICD In-Circuit Debugger... Processor Architecture Manuals... ARM/CORTEX/XSCALE... RAM Trace Port Overview... 2 FAQ...
 RAM Trace Port TRACE32 Online Help TRACE32 Directory TRACE32 Index TRACE32 Documents... ICD In-Circuit Debugger... Processor Architecture Manuals... ARM/CORTEX/XSCALE... RAM Trace Port... 1 Overview...
Chapter 3: Important Concepts (3/29/2015)
") CISC 3595 Operating System Spring, 2015 Chapter 3: Important Concepts (3/29/2015) 1 Memory from programmer s perspective: you already know these: Code (functions) and data are loaded into memory when the
CISC 3595 Operating System Spring, 2015 Chapter 3: Important Concepts (3/29/2015) 1 Memory from programmer s perspective: you already know these: Code (functions) and data are loaded into memory when the
API for Auxiliary Processing Unit
 API for Auxiliary Processing Unit TRACE32 Online Help TRACE32 Directory TRACE32 Index TRACE32 Documents... Misc... API for Auxiliary Processing Unit... 1 Introduction... 3 Release Information 3 Features
RTOS Debugger for MQX
 RTOS Debugger for MQX TRACE32 Online Help TRACE32 Directory TRACE32 Index TRACE32 Documents... RTOS Debuggers... RTOS Debugger for MQX... 1 Overview... 3 Brief Overview of Documents for New Users... 4
Application Note C++ Debugging
 Application Note C++ Debugging TRACE32 Online Help TRACE32 Directory TRACE32 Index TRACE32 Documents... High-Level Language Debugging... Application Note C++ Debugging... 1 Sample Code used by This Application
ICE/FIRE Analyzer Programming Dialog
 ICE/FIRE Analyzer Programming Dialog TRACE32 Online Help TRACE32 Directory TRACE32 Index TRACE32 Documents... FIRE In-Circuit Emulator... ICE Analyzer System... FIRE Analyzer Programming... ICE/FIRE Analyzer
The Kernel Abstraction
 The Kernel Abstraction Debugging as Engineering Much of your time in this course will be spent debugging In industry, 50% of software dev is debugging Even more for kernel development How do you reduce
Project Debugging with MDK-ARM
 Project Debugging with MDK-ARM Notes: This document assumes MDK-ARM Version 5.xx (µvision5 ) is installed with the required ST-Link USB driver, device family pack (STM32F4xx for STM32F4-Discovery board;
XMC4800 EtherCAT APP SSC Firmware Update Slave Example. Getting Started Version 3.0
 XMC4800 EtherCAT APP SSC Firmware Update Slave Example Getting Started Version 3.0 1 2 3 4 5 6 7 Overview and requirements Setup Short overview boot modes Architecture Implementation of the application
Lab 13 Real Time Debugging
 Lab 13 Real Time Debugging Page 13.1 Lab 13 Real Time Debugging This laboratory assignment accompanies the book, Embedded Microcomputer Systems: Real Time Interfacing, by, published by Brooks-Cole, copyright
This chapter introduces how to use the emulator of TOPICE quickly.
 Quick Starting Summarization This chapter introduces how to use the emulator of TOPICE quickly. Compiling Source and Debugging Creating a New Project Select main menu Project, then choose the submenu New
Operating Systems. Designed and Presented by Dr. Ayman Elshenawy Elsefy
 Operating Systems Designed and Presented by Dr. Ayman Elshenawy Elsefy Dept. of Systems & Computer Eng.. AL-AZHAR University Website : eaymanelshenawy.wordpress.com Email : eaymanelshenawy@yahoo.com Reference
Basic Memory Management. Basic Memory Management. Address Binding. Running a user program. Operating Systems 10/14/2018 CSC 256/456 1
 Basic Memory Management Program must be brought into memory and placed within a process for it to be run Basic Memory Management CS 256/456 Dept. of Computer Science, University of Rochester Mono-programming
Page Replacement Algorithms
 Page Replacement Algorithms MIN, OPT (optimal) RANDOM evict random page FIFO (first-in, first-out) give every page equal residency LRU (least-recently used) MRU (most-recently used) 1 9.1 Silberschatz,
Caching and Demand-Paged Virtual Memory
 Caching and Demand-Paged Virtual Memory Definitions Cache Copy of data that is faster to access than the original Hit: if cache has copy Miss: if cache does not have copy Cache block Unit of cache storage
Lecture V Toy Hardware and Operating System
 2. THE Machine Lecture V Page 1 Lecture V Toy Hardware and Operating System 1. Introduction For use in our OS projects, we introduce THE Machine where THE is an acronym 1 for Toy HardwarE. We also introduce
B. V. Patel Institute of Business Management, Computer &Information Technology, UTU
 BCA-3 rd Semester 030010304-Fundamentals Of Operating Systems Unit: 1 Introduction Short Answer Questions : 1. State two ways of process communication. 2. State any two uses of operating system according
CS330: Operating System and Lab. (Spring 2006) I/O Systems
 I/O Systems") CS330: Operating System and Lab. (Spring 2006) I/O Systems Today s Topics Block device vs. Character device Direct I/O vs. Memory-mapped I/O Polling vs. Interrupts Programmed I/O vs. DMA Blocking vs. Non-blocking
CS330: Operating System and Lab. (Spring 2006) I/O Systems Today s Topics Block device vs. Character device Direct I/O vs. Memory-mapped I/O Polling vs. Interrupts Programmed I/O vs. DMA Blocking vs. Non-blocking
HCS12 BDM Getting Started V4.3
 HCS12 BDM Getting Started V4.3 Background The term BDM stands for Background Debug Mode. It is used for the system development and FLASH programming. A BDM firmware is implemented on the CPU silicon providing
Performance Profiling
 Performance Profiling Minsoo Ryu Real-Time Computing and Communications Lab. Hanyang University msryu@hanyang.ac.kr Outline History Understanding Profiling Understanding Performance Understanding Performance
Advanced Debugging using the Ashling MPC5500 tools
 Ashling Product Brief APB200 Advanced Debugging using the Ashling MPC5500 tools 1. Contents 1. Contents 1 2. Introduction 1 3. Break on Data Access 1 4. Tracing Accesses to a Variable 3 4.1 Cycle accurate
Computer Organisation CS303
 Computer Organisation CS303 Module Period Assignments 1 Day 1 to Day 6 1. Write a program to evaluate the arithmetic statement: X=(A-B + C * (D * E-F))/G + H*K a. Using a general register computer with