Improving Linux development with better tools
|
|
|
- Basil Roberts
- 6 years ago
- Views:
Transcription
1 Improving Linux development with better tools Andi Kleen Oct 2013 Intel Corporation
2 Linux complexity growing Source lines in Linux kernel All source code M-LOC V3.6 V3.7 V3.8 V3.9 V3.10 V3.11 Kernel version M-LOC Linux kernel source lines IO net/ fs/ block/ 0 V2.6.16V V3.6 V3.7 V3.8 V3.9 V3.10 V3.11 Kernel version M-LOC Source lines Linux Kernel core kernel/ lib V V3.7 V3.9 V V3.6 V3.8 V3.10 V3.11 Kernel
3 Do we have a problem? If we assume number of bugs stays constant per line there would be more and more bugs If we assume programmers don't get cleverer some code may become too complex to change/debug
4 Or we can use better tools to find bugs Static code checker tools Dynamic runtime checkers Fuzzers/test suites Tracers to understand code Tools to understand the source
5 Static checkers sparse, smatch, coccinelle, clang checker, checkpatch, gcc -W/LTO, stanse Can check a lot of things, simple mistakes, complex problems Generic C and kernel specific rules
6 Static checker challenges Some are very slow False positives Often only can do new warnings Otherwise too many false positives May need concentrated effort to get false positives down Only done for gcc/sparse/checkpatch so far Needs both changes to Linux and to checkers
7 Study bug fixes At least 14.8% 24.4% of the sampled bug fixes are incorrect. Moreover, 43% of the incorrect fixes resulted in severe bugs that caused crash, hang, data corruption or security problems. How do fixes become bugs Yin/Yuan et.al. Great paper, every kernel programmer should read it Can new rules for static checkers help?
8 Coccinelle checker /// Find &&/ operations that include the same argument more than once //# A common source of false positives is when the argument performs a side //# expression@ expression E; position ( * E@p... E * E@p &&... && E depends on org@ p << cocci.print_main("duplicated argument to && or ",p)
9 Challenge: global checks No static checker I found can follow indirect calls ( OO in C, common in kernel) struct foo_ops { } int (*do_foo)(struct foo *obj); foo->do_foo(foo); Can be done by using type information Misses a lot of potential bugs
10 Lock ordering: lockdep Deadlock from lock ordering ( ABBA bugs) used to be common T1 lock(a); lock(b); T2 lock(b); lock(a); Lockdep basically eliminated this problem Checks lock ordering, interrupt flags violations at runtime Unfortunately scaling problems on large systems
11 Kmemcheck / AddressSanitizer Check uninitialized/freed/out of bounds data Kmemcheck based on page faults Quite slow AddressSanitizer using compiler instrumentation Much faster Kernel library seems to exist, but not released yet
12 Thread checkers Find data races: Shared data accesses not protected by locks User space: helgrind, ThreadSanitizer,.. ThreadSanitizer compiler based and could be used in kernel Problem: kernel does not mark lock-less accesses, which would be false positives. User lock less code: atomic_store_n(&foo, 1, ATOMIC_SEQ_CST); Kernel: foo = 1; mb();
13 Undefined behavior checker UBSan: New gcc/llvm feature Checks undefined C behavior at runtime e.g. x << 100, signed integer overflows, Needs special runtime library Would need to be ported to kernel
14 Fuzzers Use random input data to find bugs Trinity is a great tool Finds many bugs Needs manual model for each syscall How do we cover all the ioctls/sys/proc files? Modern fuzzers around using automatic feedback by instrumenting code But not for kernel yet
15 The biggest challenge How to run all these tools on every new patch: Cannot ask every developer to use all of them Static checkers are relatively easy But can we get beyond just deltas for new code? But how to run the dynamic tools?
16 Test suites Ideally all kernel code would come with a test suite Then someone could run all the dynamic checkers Difficult for hardware drivers LKP, kernel unit tests, tools/* limited Need a real unit testing framework
17 Coverage Kernel gcov can be used to test coverage of test suites Should be used much more widely
18 Tracers Long beyond real men don't use debuggers Linux has good debuggers these days (kgdb etc.) But how to debug hard to reproduce bugs Ideal enough information to debug on first trigger Tracing: Low overhead instrumentation When problem triggers dump data
19 ftrace: function tracer Trace all functions in the kernel for PID # trace-cmd record -p function -e sched_switch -P $(pidof firefox-bin) plugin function disable all enable sched_switch path = /sys/kernel/debug/tracing/events/sched_switch/enable path = /sys/kernel/debug/tracing/events/*/sched_switch/enable path = /sys/kernel/debug/tracing/events/sched_switch/enable path = /sys/kernel/debug/tracing/events/*/sched_switch/enable Hit Ctrl^C to stop recording. # trace-cmd report firefox-bin [002] : function: firefox-bin [002] : function: firefox-bin [002] : function: firefox-bin [002] : function: firefox-bin [002] : function: firefox-bin [002] : function: firefox-bin [002] : function: firefox-bin [002] : function: firefox-bin [002] : function: firefox-bin [002] : function: firefox-bin [002] : function: firefox-bin [002] : function: firefox-bin [002] : function: firefox-bin [002] : function: All kernel functions executed sys_poll poll_select_set_timeout ktime_get_ts timekeeping_get_ns set_normalized_timespec timespec_add_safe set_normalized_timespec do_sys_poll copy_from_user might_fault _cond_resched should_resched need_resched test_ti_thread_flag
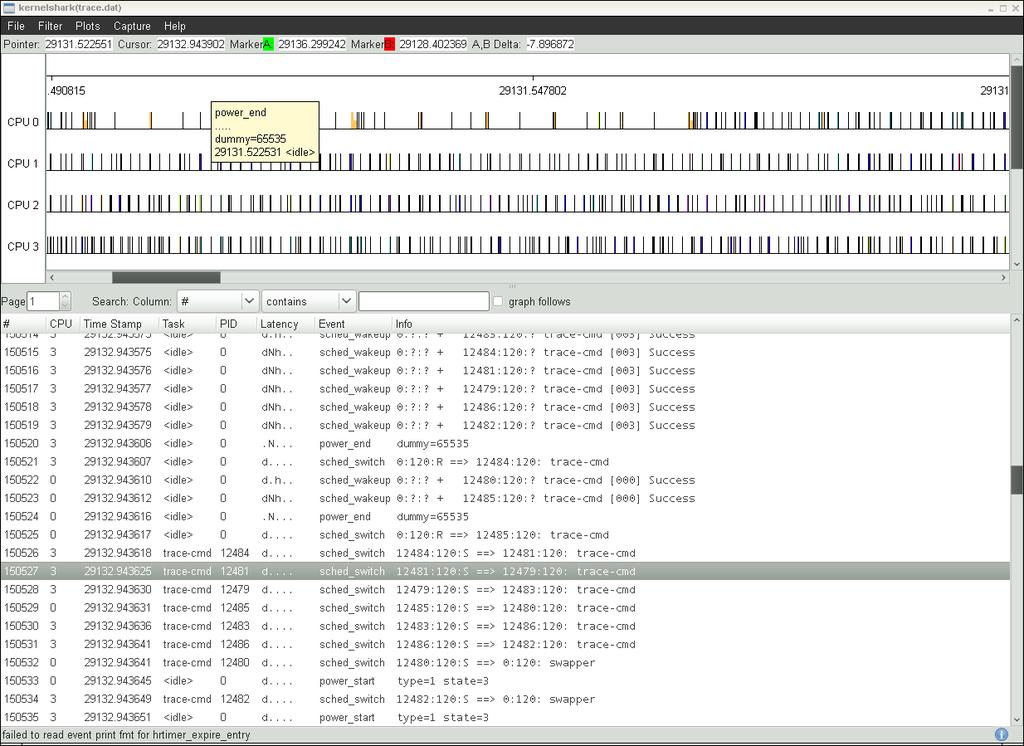
20 kernelshark
21 Ftrace / kernelshark Can dump on events / oops / custom triggers But still too much overhead in many cases to run always during testing Lots of other tracers not mentioned here systemtap, perf, k/uprobes,...
22 Intel Processor Trace (PT) Upcoming Intel CPU feature Traces all branches with low overhead Will be supported in perf and gdb Can be used as Flight Recorder Tells you how you got there on a problem
23 Biggest challenge with tracers They generate too much data Need better tools to analyze the data Can machine learning/analytics help?
24 Understanding source code Often first problem is finding the code grep/cscope work great for many cases But do not understand indirect pointers (OO in C model used in kernel): Give me all do_foo instances struct foo_ops { int (*do_foo)(struct foo *obj); } = {.do_foo = my_foo }; foo->do_foo(foo) Would be great to have a cscope like tool that understands this based on types/initializers
25 Conclusion Linux has a lot of great tools for making kernel development easier We need them to keep up with the growing complexity But still many improvements possible Questions?
Improving Linux Development with better tools. Andi Kleen. Oct 2013 Intel Corporation
 Improving Linux Development with better tools Andi Kleen Oct 2013 Intel Corporation ak@linux.intel.com Linux complexity growing Source lines in Linux kernel All source code 16.5 16 15.5 M-LOC 15 14.5 14
Identifying Memory Corruption Bugs with Compiler Instrumentations. 이병영 ( 조지아공과대학교
 Identifying Memory Corruption Bugs with Compiler Instrumentations 이병영 ( 조지아공과대학교 ) blee@gatech.edu @POC2014 How to find bugs Source code auditing Fuzzing Source Code Auditing Focusing on specific vulnerability
Linux multi-core scalability
 Linux multi-core scalability Oct 2009 Andi Kleen Intel Corporation andi@firstfloor.org Overview Scalability theory Linux history Some common scalability trouble-spots Application workarounds Motivation
Debugging and Profiling
 Debugging and Profiling Dr. Axel Kohlmeyer Senior Scientific Computing Expert Information and Telecommunication Section The Abdus Salam International Centre for Theoretical Physics http://sites.google.com/site/akohlmey/
The Ephemeral Smoking Gun
 The Ephemeral Smoking Gun Using ftrace and kgdb to resolve a pthread deadlock LabVIEW Real-Time National Instruments The Setup Customer application crashed after a few hours The clincher: new issue from
Intro to Segmentation Fault Handling in Linux. By Khanh Ngo-Duy
 Intro to Segmentation Fault Handling in Linux By Khanh Ngo-Duy Khanhnd@elarion.com Seminar What is Segmentation Fault (Segfault) Examples and Screenshots Tips to get Segfault information What is Segmentation
System Wide Tracing User Need
 System Wide Tracing User Need dominique toupin ericsson com April 2010 About me Developer Tool Manager at Ericsson, helping Ericsson sites to develop better software efficiently Background
Efficient and Large Scale Program Flow Tracing in Linux. Alexander Shishkin, Intel
 Efficient and Large Scale Program Flow Tracing in Linux Alexander Shishkin, Intel 16.09.2013 Overview Program flow tracing - What is it? - What is it good for? Intel Processor Trace - Features / capabilities
Dynamic code analysis tools
 Dynamic code analysis tools Stewart Martin-Haugh (STFC RAL) Berkeley Software Technical Interchange meeting Stewart Martin-Haugh (STFC RAL) Dynamic code analysis tools 1 / 16 Overview Introduction Sanitizer
ECE/ME/EMA/CS 759 High Performance Computing for Engineering Applications
 ECE/ME/EMA/CS 759 High Performance Computing for Engineering Applications Elements of Program Debugging Dan Negrut, 2017 ECE/ME/EMA/CS 759 UW-Madison Debugging on Euler [with gdb] Slides on gdb include
DEBUGGING: DYNAMIC PROGRAM ANALYSIS
 DEBUGGING: DYNAMIC PROGRAM ANALYSIS WS 2017/2018 Martina Seidl Institute for Formal Models and Verification System Invariants properties of a program must hold over the entire run: integrity of data no
Porting Linux to x86-64
 Porting Linux to x86-64 Andi Kleen SuSE Labs ak@suse.de Abstract... Some implementation details with changes over the existing i386 port are discussed. 1 Introduction x86-64 is a new architecture developed
CS2141 Software Development using C/C++ Debugging
 CS2141 Software Development using C/C++ Debugging Debugging Tips Examine the most recent change Error likely in, or exposed by, code most recently added Developing code incrementally and testing along
Jackson Marusarz Software Technical Consulting Engineer
 Jackson Marusarz Software Technical Consulting Engineer What Will Be Covered Overview Memory/Thread analysis New Features Deep dive into debugger integrations Demo Call to action 2 Analysis Tools for Diagnosis
Intel Parallel Studio XE 2017 Composer Edition BETA C++ - Debug Solutions Release Notes
 Developer Zone Intel Parallel Studio XE 2017 Composer Edition BETA C++ - Debug Solutions Release Notes Submitted by Georg Z. (Intel) on August 5, 2016 This page provides the current Release Notes for the
SystemTap for Enterprise
 SystemTap for Enterprise SystemTap for Enterprise Enterprise Features in SystemTap 2010/09/28 Hitachi Systems Development Laboratory Linux Technology Center Masami Hiramatsu SystemTap Overview Tracing
Debugging with gdb and valgrind
 Debugging with gdb and valgrind Dr. Axel Kohlmeyer Associate Dean for Scientific Computing, CST Associate Director, Institute for Computational Science Assistant Vice President for High-Performance Computing
Hunting Down Data Races in the Linux Kernel
 Hunting Down Data Races in the Linux Kernel Eugene A. Shatokhin www.rosalab.com Data Race "Simultaneous access to the same memory location by multiple threads, where at least one of the accesses modifies
Copyright 2015 MathEmbedded Ltd.r. Finding security vulnerabilities by fuzzing and dynamic code analysis
 Finding security vulnerabilities by fuzzing and dynamic code analysis Security Vulnerabilities Top code security vulnerabilities don t change much: Security Vulnerabilities Top code security vulnerabilities
Tools for kernel development. Jonathan Corbet LWN.net
 Tools for kernel development Jonathan Corbet LWN.net corbet@lwn.net Tools Lots of development tools exist They will make your life easier Already seen: checkpatch.pl Lockdep Monitors all lock operations
Fuzzing AOSP. AOSP for the Masses. Attack Android Right Out of the Box Dan Austin, Google. Dan Austin Google Android SDL Research Team
 Fuzzing AOSP For the Masses AOSP for the Masses Attack Android Right Out of the Box Dan Austin, Google Dan Austin Google Android SDL Research Team Exploitation: Find the Needle Needles are Interesting
Debugging. ICS312 Machine-Level and Systems Programming. Henri Casanova
 Debugging ICS312 Machine-Level and Systems Programming Henri Casanova (henric@hawaii.edu) Debugging Even when written in high-level languages, programs have bugs Recall the thought that when moving away
Exercise Session 6 Computer Architecture and Systems Programming
 Systems Group Department of Computer Science ETH Zürich Exercise Session 6 Computer Architecture and Systems Programming Herbstsemester 2016 Agenda GDB Outlook on assignment 6 GDB The GNU Debugger 3 Debugging..
GDB Tutorial. A Walkthrough with Examples. CMSC Spring Last modified March 22, GDB Tutorial
 A Walkthrough with Examples CMSC 212 - Spring 2009 Last modified March 22, 2009 What is gdb? GNU Debugger A debugger for several languages, including C and C++ It allows you to inspect what the program
Debugging with GDB and DDT
 Debugging with GDB and DDT Ramses van Zon SciNet HPC Consortium University of Toronto June 28, 2012 1/41 Ontario HPC Summerschool 2012 Central Edition: Toronto Outline Debugging Basics Debugging with the
Scientific Programming in C IX. Debugging
 Scientific Programming in C IX. Debugging Susi Lehtola 13 November 2012 Debugging Quite often you spend an hour to write a code, and then two hours debugging why it doesn t work properly. Scientific Programming
New features in AddressSanitizer. LLVM developer meeting Nov 7, 2013 Alexey Samsonov, Kostya Serebryany
 New features in AddressSanitizer LLVM developer meeting Nov 7, 2013 Alexey Samsonov, Kostya Serebryany Agenda AddressSanitizer (ASan): a quick reminder New features: Initialization-order-fiasco Stack-use-after-scope
CSC 405 Introduction to Computer Security Fuzzing
 CSC 405 Introduction to Computer Security Fuzzing Alexandros Kapravelos akaprav@ncsu.edu Let s find some bugs (again) We have a potentially vulnerable program The program has some inputs which can be controlled
Making C Less Dangerous
 Making C Less Dangerous Linux Security Summit August 27, 2018 Vancouver, Canada Kees ( Case ) Cook keescook@chromium.org @kees_cook https://outflux.net/slides/2018/lss/danger.pdf Agenda Background Kernel
CSE 374 Programming Concepts & Tools
 CSE 374 Programming Concepts & Tools Hal Perkins Fall 2017 Lecture 11 gdb and Debugging 1 Administrivia HW4 out now, due next Thursday, Oct. 26, 11 pm: C code and libraries. Some tools: gdb (debugger)
Verification & Validation of Open Source
 Verification & Validation of Open Source 2011 WORKSHOP ON SPACECRAFT FLIGHT SOFTWARE Gordon Uchenick Coverity, Inc Open Source is Ubiquitous Most commercial and proprietary software systems have some open
Performance analysis basics
 Performance analysis basics Christian Iwainsky Iwainsky@rz.rwth-aachen.de 25.3.2010 1 Overview 1. Motivation 2. Performance analysis basics 3. Measurement Techniques 2 Why bother with performance analysis
Debugging with GDB and DDT
 Debugging with GDB and DDT Ramses van Zon SciNet HPC Consortium University of Toronto June 13, 2014 1/41 Ontario HPC Summerschool 2014 Central Edition: Toronto Outline Debugging Basics Debugging with the
Important From Last Time
 Important From Last Time Embedded C Pros and cons Macros and how to avoid them Intrinsics Interrupt syntax Inline assembly Today Advanced C What C programs mean How to create C programs that mean nothing
Fast dynamic program analysis Race detection. Konstantin Serebryany May
 Fast dynamic program analysis Race detection Konstantin Serebryany May 20 2011 Agenda Dynamic program analysis Race detection: theory ThreadSanitizer: race detector Making ThreadSanitizer
Page 1. Today. Important From Last Time. Is the assembly code right? Is the assembly code right? Which compiler is right?
 Important From Last Time Today Embedded C Pros and cons Macros and how to avoid them Intrinsics Interrupt syntax Inline assembly Advanced C What C programs mean How to create C programs that mean nothing
Concurrency, Thread. Dongkun Shin, SKKU
 Concurrency, Thread 1 Thread Classic view a single point of execution within a program a single PC where instructions are being fetched from and executed), Multi-threaded program Has more than one point
CS354 gdb Tutorial Written by Chris Feilbach
 CS354 gdb Tutorial Written by Chris Feilbach Purpose This tutorial aims to show you the basics of using gdb to debug C programs. gdb is the GNU debugger, and is provided on systems that
Oracle Developer Studio Code Analyzer
 Oracle Developer Studio Code Analyzer The Oracle Developer Studio Code Analyzer ensures application reliability and security by detecting application vulnerabilities, including memory leaks and memory
AMD gdebugger 6.2 for Linux
 AMD gdebugger 6.2 for Linux by vincent Saturday, 19 May 2012 http://www.streamcomputing.eu/blog/2012-05-19/amd-gdebugger-6-2-for-linux/ The printf-funtion in kernels isn t the solution to everything, so
Programming in C. Lecture 9: Tooling. Dr Neel Krishnaswami. Michaelmas Term
 Programming in C Lecture 9: Tooling Dr Neel Krishnaswami Michaelmas Term 2017-2018 1 / 24 Undefined and Unspecified Behaviour 2 / 24 Undefined and Unspecified Behaviour We have seen that C is an unsafe
Linux Kernel Validation Tools. Nicholas Mc Guire Distributed & Embedded Systems Lab Lanzhou University, China
 Linux Kernel Validation Tools Nicholas Mc Guire Distributed & Embedded Systems Lab Lanzhou University, China http://dslab.lzu.edu.cn Virtualization 1 Tools for GNU/Linux problem statement tools overview
Analyzing Kernel Behavior by SystemTap
 Analyzing Kernel Behavior by SystemTap Kernel Tracer Approach 2009/2/25 Hitachi, Ltd., Software Division Noboru Obata ( ) Hitachi, Ltd. 2009. All rights reserved. Contents 1. Improving RAS Features for
Scaling CQUAL to millions of lines of code and millions of users p.1
 Scaling CQUAL to millions of lines of code and millions of users Jeff Foster, Rob Johnson, John Kodumal and David Wagner {jfoster,rtjohnso,jkodumal,daw}@cs.berkeley.edu. UC Berkeley Scaling CQUAL to millions
The benefits and costs of writing a POSIX kernel in a high-level language
 1 / 38 The benefits and costs of writing a POSIX kernel in a high-level language Cody Cutler, M. Frans Kaashoek, Robert T. Morris MIT CSAIL Should we use high-level languages to build OS kernels? 2 / 38
Systems software design. Software build configurations; Debugging, profiling & Quality Assurance tools
 Systems software design Software build configurations; Debugging, profiling & Quality Assurance tools Who are we? Krzysztof Kąkol Software Developer Jarosław Świniarski Software Developer Presentation
Allinea Unified Environment
 Allinea Unified Environment Allinea s unified tools for debugging and profiling HPC Codes Beau Paisley Allinea Software bpaisley@allinea.com 720.583.0380 Today s Challenge Q: What is the impact of current
Debugging. Erwan Demairy Dream
 1 Debugging Erwan Demairy Dream 2 Where are we? Tools Requirements Global architecture UML Local architecture Implementation Compilation Link Editor Compiler Linker Tests Debug Profiling Build IDE Debugger
Bug Hunting and Static Analysis
 Bug Hunting and Red Hat Ondřej Vašík and Petr Müller 2011-02-11 Abstract Basic overview of common error patterns in C/C++, few words about defensive programming
Testing Error Handling Code in Device Drivers Using Characteristic Fault Injection
 1 Testing Error Handling Code in Device Drivers Using Characteristic Fault Injection Jia-Ju Bai, Yu-Ping Wang, Jie Yin, Shi-Min Hu Department of Computer Science and Technology Tsinghua University Beijing,
Configurations. Make menuconfig : Kernel hacking/
 Kernel Debugging Configurations Make menuconfig : Kernel hacking/ Timing info on printks depreciated logic Detection of hung tasks SLUB debugging Kernel memory leak detector Mutext/lock debugging Kmemcheck
Low level security. Andrew Ruef
 Low level security Andrew Ruef What s going on Stuff is getting hacked all the time We re writing tons of software Often with little regard to reliability let alone security The regulatory environment
Using Intel VTune Amplifier XE and Inspector XE in.net environment
 Using Intel VTune Amplifier XE and Inspector XE in.net environment Levent Akyil Technical Computing, Analyzers and Runtime Software and Services group 1 Refresher - Intel VTune Amplifier XE Intel Inspector
Memory & Thread Debugger
 Memory & Thread Debugger Here is What Will Be Covered Overview Memory/Thread analysis New Features Deep dive into debugger integrations Demo Call to action Intel Confidential 2 Analysis Tools for Diagnosis
1. Allowed you to see the value of one or more variables, or 2. Indicated where you were in the execution of a program
 CS0449 GDB Lab What is a debugger? A debugger is a program that helps you find logical mistakes in your programs by running them in a controlled way. Undoubtedly by this point in your programming life,
Important From Last Time
 Important From Last Time Embedded C Ø Pros and cons Macros and how to avoid them Intrinsics Interrupt syntax Inline assembly Today Advanced C What C programs mean How to create C programs that mean nothing
Using a debugger. Segmentation fault? GDB to the rescue!
 Using a debugger Segmentation fault? GDB to the rescue! But first... Let's talk about the quiz Let's talk about the previous homework assignment Let's talk about the current homework assignment K findkey(v
Reversed Buffer Overflow Cross Stack Attacks. Kris Kaspersky Endeavor Security, Inc.
 Reversed Buffer Overflow Cross Stack Attacks Kris Kaspersky Endeavor Security, Inc. Who am I? journalist, reversing as a hobby; currently working for: XAKEP magazine (www.xakep.ru) Endeavor Security, Inc
RAS Enhancement Activities for Mission-Critical Linux Systems
 RAS Enhancement Activities for MissionCritical Linux Systems Hitachi Ltd. Yoshihiro YUNOMAE 01 MissionCritical Systems We apply Linux to missioncritical systems. Banking systems/carrier backend systems/train
Grigore Rosu Founder, President and CEO Professor of Computer Science, University of Illinois
 https://runtimeverification.com Grigore Rosu Founder, President and CEO Professor of Computer Science, University of Illinois Runtime Verification Company Licensed by University of Illinois at Urbana-Champaign
Disclaimer. This talk vastly over-simplifies things. See notes for full details and resources.
 Greg Kroah-Hartman Disclaimer This talk vastly over-simplifies things. See notes for full details and resources. https://github.com/gregkh/presentation-spectre Spectre Hardware bugs Valid code can be tricked
18-600: Recitation #3
 18-600: Recitation #3 Bomb Lab & GDB Overview September 12th, 2017 1 Today X86-64 Overview Bomb Lab Introduction GDB Tutorial 2 3 x86-64: Register Conventions Arguments passed in registers: %rdi, %rsi,
Using Static Code Analysis to Find Bugs Before They Become Failures
 Using Static Code Analysis to Find Bugs Before They Become Failures Presented by Brian Walker Senior Software Engineer, Video Product Line, Tektronix, Inc. Pacific Northwest Software Quality Conference,
Overview of the x86-64 kernel. Andi Kleen, SUSE Labs, Novell Linux Bangalore 2004
 Overview of the x86-64 kernel Andi Kleen, SUSE Labs, Novell ak@suse.de Linux Bangalore 2004 What s wrong? x86-64, x86_64 AMD64 EM64T IA32e IA64 x64, CT Names x86-64, x86_64 AMD64 EM64T IA32e x64 CT Basics
Welcome. HRSK Practical on Debugging, Zellescher Weg 12 Willers-Bau A106 Tel
 Center for Information Services and High Performance Computing (ZIH) Welcome HRSK Practical on Debugging, 03.04.2009 Zellescher Weg 12 Willers-Bau A106 Tel. +49 351-463 - 31945 Matthias Lieber (matthias.lieber@tu-dresden.de)
uftrace: function graph tracer for C/C++
 uftrace: function graph tracer for C/C++ Namhyung Kim ( 김남형 ) namhyung@gmail.com namhyung.kim@lge.com Open Source Summit 2017 2017.9.11 "Powered by Marp" uftrace overview function tracer for C/C++ inspired
Kernel Probes for ARM. Quentin Barnes Motorola - Mobile Devices April 17, 2007
 Kernel Probes for ARM Quentin Barnes q.barnes@motorola.com Motorola - Mobile Devices April 17, 2007 Overview Introduction to kernel probes How kernel probes work The classic kprobe model and 'boosting'
Mental models for modern program tuning
 Mental models for modern program tuning Andi Kleen Intel Corporation Jun 2016 How can we see program performance? VS High level Important to get the common ants fast Army of ants Preliminary optimization
Typical Bugs in parallel Programs
 Center for Information Services and High Performance Computing (ZIH) Typical Bugs in parallel Programs Parallel Programming Course, Dresden, 8.- 12. February 2016 Joachim Protze (protze@rz.rwth-aachen.de)
Overhead Evaluation about Kprobes and Djprobe (Direct Jump Probe)
") Overhead Evaluation about Kprobes and Djprobe (Direct Jump Probe) Masami Hiramatsu Hitachi, Ltd., SDL Jul. 13. 25 1. Abstract To implement flight recorder system, the overhead
Overhead Evaluation about Kprobes and Djprobe (Direct Jump Probe) Masami Hiramatsu Hitachi, Ltd., SDL Jul. 13. 25 1. Abstract To implement flight recorder system, the overhead
CSCI0330 Intro Computer Systems Doeppner. Lab 02 - Tools Lab. Due: Sunday, September 23, 2018 at 6:00 PM. 1 Introduction 0.
 CSCI0330 Intro Computer Systems Doeppner Lab 02 - Tools Lab Due: Sunday, September 23, 2018 at 6:00 PM 1 Introduction 0 2 Assignment 0 3 gdb 1 3.1 Setting a Breakpoint 2 3.2 Setting a Watchpoint on Local
Comprehensive Kernel Instrumentation via Dynamic Binary Translation
 Comprehensive Kernel Instrumentation via Dynamic Binary Translation Peter Feiner Angela Demke Brown Ashvin Goel University of Toronto 011 Complexity of Operating Systems 012 Complexity of Operating Systems
CS61C Machine Structures. Lecture 4 C Pointers and Arrays. 1/25/2006 John Wawrzynek. www-inst.eecs.berkeley.edu/~cs61c/
 CS61C Machine Structures Lecture 4 C Pointers and Arrays 1/25/2006 John Wawrzynek (www.cs.berkeley.edu/~johnw) www-inst.eecs.berkeley.edu/~cs61c/ CS 61C L04 C Pointers (1) Common C Error There is a difference
Author: Steve Gorman Title: Programming with the Intel architecture in the flat memory model
 Author: Steve Gorman Title: Programming with the Intel architecture in the flat memory model Abstract: As the Intel architecture moves off the desktop into a variety of other computing applications, developers
LinuxCon 2010 Tracing Mini-Summit
 LinuxCon 2010 Tracing Mini-Summit A new unified Lockless Ring Buffer library for efficient kernel tracing Presentation at: http://www.efficios.com/linuxcon2010-tracingsummit E-mail: mathieu.desnoyers@efficios.com
CS61C : Machine Structures
 inst.eecs.berkeley.edu/~cs61c CS61C : Machine Structures Lecture 4 Introduction to C (pt 2) 2014-09-08!!!Senior Lecturer SOE Dan Garcia!!!www.cs.berkeley.edu/~ddgarcia! C most popular! TIOBE programming
When the OS gets in the way
 When the OS gets in the way (and what you can do about it) Mark Price @epickrram LMAX Exchange Linux When the OS gets in the way (and what you can do about it) Mark Price @epickrram LMAX Exchange It s
Debugging Kernel without Debugger
 Debugging Kernel without Debugger Masami Hiramatsu Software Platform Research Dept. Yokohama Research Lab. Hitachi Ltd., 1 Who am I? Masami Hiramatsu Researcher in Hitachi
CSC C69: OPERATING SYSTEMS
 CSC C69: OPERATING SYSTEMS Tutorial 1 Thursday, Jan 17, 2013 TA: Ioan Stefanovici (ioan@cs.toronto.edu) HOW DO YOU SUCCEED IN THIS COURSE? Show up to lectures & tutorials (way too much material) Work on
Project 0: Implementing a Hash Table
 Project : Implementing a Hash Table CS, Big Data Systems, Spring Goal and Motivation. The goal of Project is to help you refresh basic skills at designing and implementing data structures and algorithms.
CS 103 Lab - Party Like A Char Star
 1 Introduction In this lab you will implement a "hangman" game where the user is shown blanks representing letter of a word and then tries to guess and fill in the letters with a limited number of guesses.
6.828: OS/Language Co-design. Adam Belay
 6.828: OS/Language Co-design Adam Belay Singularity An experimental research OS at Microsoft in the early 2000s Many people and papers, high profile project Influenced by experiences at
Introduction to debugging. Martin Čuma Center for High Performance Computing University of Utah
 Introduction to debugging Martin Čuma Center for High Performance Computing University of Utah m.cuma@utah.edu Overview Program errors Simple debugging Graphical debugging DDT and Totalview Intel tools
High Performance Computing MPI and C-Language Seminars 2009
 High Performance Computing - Seminar Plan Welcome to the High Performance Computing seminars for 2009. Aims: Introduce the C Programming Language. Basic coverage of C and programming techniques needed
Programming Studio #9 ECE 190
 Programming Studio #9 ECE 190 Programming Studio #9 Concepts: Functions review 2D Arrays GDB Announcements EXAM 3 CONFLICT REQUESTS, ON COMPASS, DUE THIS MONDAY 5PM. NO EXTENSIONS, NO EXCEPTIONS. Functions
EW The Source Browser might fail to start data collection properly in large projects until the Source Browser window is opened manually.
 EW 25462 The Source Browser might fail to start data collection properly in large projects until the Source Browser window is opened manually. EW 25460 Some objects of a struct/union type defined with
STANSE: Bug-finding Framework for C Programs
 STANSE: Bug-finding Framework for C Programs Jan Obdržálek, Jiří Slabý and Marek Trtík Masaryk University, Brno, Czech Republic {obdrzalek,slaby,trtik}@fi.muni.cz Abstract. Stanse is a free (available
NetBSD/pkgsrc for the last 3 years
 DEBUGGING LESSONS LEARNED WHILE FIXING NETBSD ABOUT ME maya@netbsd.org coypu@sdf.org NetBSD/pkgsrc for the last 3 years THIS TALK Mix of a bunch of bugs Not solo work Thanks to riastradh, dholland, martin,
ClabureDB: Classified Bug-Reports Database
 ClabureDB: Classified Bug-Reports Database Tool for developers of program analysis tools Jiri Slaby, Jan Strejček, and Marek Trtík Faculty of Informatics, Masaryk University Botanická 68a, 60200 Brno,
Profiling & Optimization
 Lecture 11 Sources of Game Performance Issues? 2 Avoid Premature Optimization Novice developers rely on ad hoc optimization Make private data public Force function inlining Decrease code modularity removes
CS/COE 0449 term 2174 Lab 5: gdb
 CS/COE 0449 term 2174 Lab 5: gdb What is a debugger? A debugger is a program that helps you find logical mistakes in your programs by running them in a controlled way. Undoubtedly by this point in your
OpenACC Course. Office Hour #2 Q&A
 OpenACC Course Office Hour #2 Q&A Q1: How many threads does each GPU core have? A: GPU cores execute arithmetic instructions. Each core can execute one single precision floating point instruction per cycle
12. Debugging. Overview. COMP1917: Computing 1. Developing Programs. The Programming Cycle. Programming cycle. Do-it-yourself debugging
 COMP1917 12s2 Debugging 1 COMP1917: Computing 1 12. Debugging Overview Programming cycle Do-it-yourself debugging Debugging withgdb Nastier bugs Memory leaks COMP1917 12s2 Debugging 2 Developing Programs
Guarding Vulnerable Code: Module 1: Sanitization. Mathias Payer, Purdue University
 Guarding Vulnerable Code: Module 1: Sanitization Mathias Payer, Purdue University http://hexhive.github.io 1 Vulnerabilities everywhere? 2 Common Languages: TIOBE 18 Jul 2018 Jul 2017 Change Language 1
CSci 4061 Introduction to Operating Systems. Programs in C/Unix
 CSci 4061 Introduction to Operating Systems Programs in C/Unix Today Basic C programming Follow on to recitation Structure of a C program A C program consists of a collection of C functions, structs, arrays,
Black Hat Webcast Series. C/C++ AppSec in 2014
 Black Hat Webcast Series C/C++ AppSec in 2014 Who Am I Chris Rohlf Leaf SR (Security Research) - Founder / Consultant BlackHat Speaker { 2009, 2011, 2012 } BlackHat Review Board Member http://leafsr.com
Random Testing of Interrupt-Driven Software. John Regehr University of Utah
 Random Testing of Interrupt-Driven Software John Regehr University of Utah Integrated stress testing and debugging Random interrupt testing Source-source transformation Static stack analysis Semantics
C Program Development and Debugging under Unix SEEM 3460
 C Program Development and Debugging under Unix SEEM 3460 1 C Basic Elements SEEM 3460 2 C - Basic Types Type (32 bit) Smallest Value Largest Value short int -32,768(-2 15 ) 32,767(2 15-1) unsigned short
Overview. This Lecture. Interrupts and exceptions Source: ULK ch 4, ELDD ch1, ch2 & ch4. COSC440 Lecture 3: Interrupts 1
 This Lecture Overview Interrupts and exceptions Source: ULK ch 4, ELDD ch1, ch2 & ch4 COSC440 Lecture 3: Interrupts 1 Three reasons for interrupts System calls Program/hardware faults External device interrupts
A heap, a stack, a bottle and a rack. Johan Montelius HT2017
 Introduction A heap, a stack, a bottle and a rack. Johan Montelius HT2017 In this assignment you re going to investigate the layout of a process; where are the different areas located and which data structures