Debugging. John Lockman Texas Advanced Computing Center
|
|
|
- Poppy Neal
- 6 years ago
- Views:
Transcription
1 Debugging John Lockman Texas Advanced Computing Center
2 Debugging Outline GDB Basic use Attaching to a running job DDT Identify MPI problems using Message Queues Catch memory errors PTP For the extremely patient*
3 Debugging gdb and ddt
4 Why use a debugger? You ve got code -> you ve got bugs Buffered output (printf / write may not help) Fast & Accurate Many errors are difficult to find without one!
5 About GDB GDB is the GNU Project DeBugger Looks inside a running program (SERIAL) From the GDB website: GDB can do four main kinds of things (plus other things in support of these) to help you catch bugs in the act: Start your program, specifying anything that might affect its behavior. Make your program stop on specified conditions. Examine what has happened, when your program has stopped. Change things in your program, so you can experiment with correcting the effects of one bug and go on to learn about another.
6 Using GDB Compile with debug flags: gcc g O0./srcFile.c The -g flag generates the symbol table and provides the debugger with line-by-line information about the source code. Execute debugger loading source dir: gdb d srcdir./exefile The -d option is useful when source and executable reside in different directories. Use the -q option to skip the licensing message. Type help at any time to see a list of the debugger options and commands.
7 Two levels of control Basic: Run the code and wait for it to crash. Identify line where it crashes. With luck the problem is obvious. Advanced: Set breakpoints Analyze data at breakpoints Watch specific variables
8 GDB basic commands command shorthand argument description run/kill r / k NA start/end program being debugged continue c NA continue running program from last breakpoint step s NA take a single step in the program from the last position where NA NA equivalent to backtrace print p variablename show value of a variable list l srcfile.c:linenumber show the specified source code line break b srcfile.c:linenumber functionname set a breakpoint by line number or function name watch NA variablename stops when the variable changes value
9 GDB example divcrash.c #include <stdio.h> #include <stdlib.h> int mydiv(int, int); int main(void) { int res, x = 5, y; for(y = 1; y < 10; y++){ res = mydiv(x,y); printf("%d,%d,%d\n",x,y,res); } return 0; } int mydiv(int x, int y){ return 1/( x - y); } divcrash.f90 PROGRAM main INTEGER :: mydiv INTEGER :: res, x = 5, y DO y = 1, 10 res = mydiv(x,y) WRITE(*,*) x,y,res END DO END PROGRAM FUNCTION mydiv(x,y) INTEGER, INTENT(IN) :: x, y mydiv = 1/(x-y) RETURN END FUNCTION mydiv
10 GDB example Compile the program and start the debugger: % gcc g O0./divcrash.c % gdb./a.out Start the program: (gdb) run The debugger will stop program execution with the following message: Program received signal SIGFPE, Arithmetic exception. 0x e in mydiv (x=5, y=5) at divcrash.c:28 28 return 1/( x - y); We can use gdb commands to obtain more information about the problem: (gdb) where #0 0x e in mydiv (x=5, y=5) at divcrash.c:28 #1 0x cf in main () at divcrash.c:19
11 GDB example In this case the problem is clear: a divide-by-zero exception happens in line 28 when variables x and y are the same. This is related to the call to mydiv from line 19 that is within a for loop: 18: for(y = 1; y < 10; y++){ 19: res = mydiv(x,y); Eventually the loop sets the value of y equal to 5 (the value of x) producing the exception: 28: return 1/( x - y); With the problem identified we can kill the program and exit the debugger : (gdb) kill (gdb) quit
12 Examining data C Fortran Result (gdb) p x (gdb) p x Print scalar data x value (gdb) p V (gdb) p V Print all vector V components (gdb) p V[i] (gdb) p V(i) Print element i of vector V (gdb) p V[i]@n (gdb) p V(i)@n Print n consecutive elements starting with V i (gdb) p M (gdb) p M Print all matrix M elements (gdb) p M[i] Not Available Print row i of matrix M (gdb) p M[i]@n Not Available Print n consecutive rows starting with row i (gdb) p M[i][j] (gdb) p M(i,j) Print matrix element Mij (gdb) p M[i][j]@n (gdb) p M(i,j)@n Print n consecutive elements starting with Mij No simple way to print columns in C or rows in Fortran Some debuggers print array slices (pgdbg, dbx), i.e. p M(1:3,3:7)
13 Breakpoint control Stop the execution of the program Allow you to examine the execution state in detail Can be assigned to a line or function Can be set conditionally command argument description info breakpoints/b/br Prints to screen all breakpoints breakpoint srcfile:linenumber if a < b Conditional insertion of breakpoint enable/disable breakpointnumber Enable/disable a breakpoint delete breakpointnumber Delete a breakpoint clear srcfile:linenumber functionname Clear breakpoints at a given line or function
14 Attaching GDB to a running program Use top to find out the PID of the tasks run by your program (in the top listing PIDs appear on the left, job names on the right). % top Attach gdb to the relevant PID: % gdb p <PID> or: % gdb (gdb) attach <PID> Once attached the debugger pauses execution of the program. Same level of control than in a standard debugging session.
15 Attaching GDB to a running program Best way to debug production runs. Don t wait for your wall time to run out! From the output of qstat obtain the node name where your code is running. In the queue field you will find an entry like development@i ta queue name partial node name: i tacc.utexas.edu
16 GDB Summary Compile using debug flags: % icc -g -O0./srcFile.c Run indicating the directory where the source is: % gdb -d srcdir./exefile Main commands: run/kill continue/next/step break/watch print where help
17 DDT: Parallel Debugger with GUI Allinea Distributed Debugger Tool Multiplatform Supports all MPI distributions Capable of debugging large scale OMP/MPI Comprehensive Memory checking MPI message tracking Useful Graphical User Interface

18 General Options Queue Submission Parameters Processor and thread number Advanced Options DDT - Run

19 General Options Queue Submission Parameters Processor and thread number Advanced Options DDT 3.2 DDT - Run

20 DDT Queue Parameters Each of these parameters may be changed Project must be set!!

21 DDT: The debug session Process controls Process groups window Project navigation window Code window Variable window Stack view and output window Evaluation window

22 DDT: Memory Leaks Go to View -> Current Memory Usage Process 0 is using much more memory than the others. This looks like a memory leak.
23 DDT Summary ssh to Lonestar or Stampede allowing X11 forwarding: % ssh -X username@<lonestar / stampede>.tacc.utexas.edu Compile with debugging flags: % mpicc -g -O0./srcFile.c Load the ddt module % module load ddt Run ddt % ddt./exefile Configure ddt properly before submission: Options MPI version Queue Parameters Wallclock/CPUs/Project Advanced Memory Checking
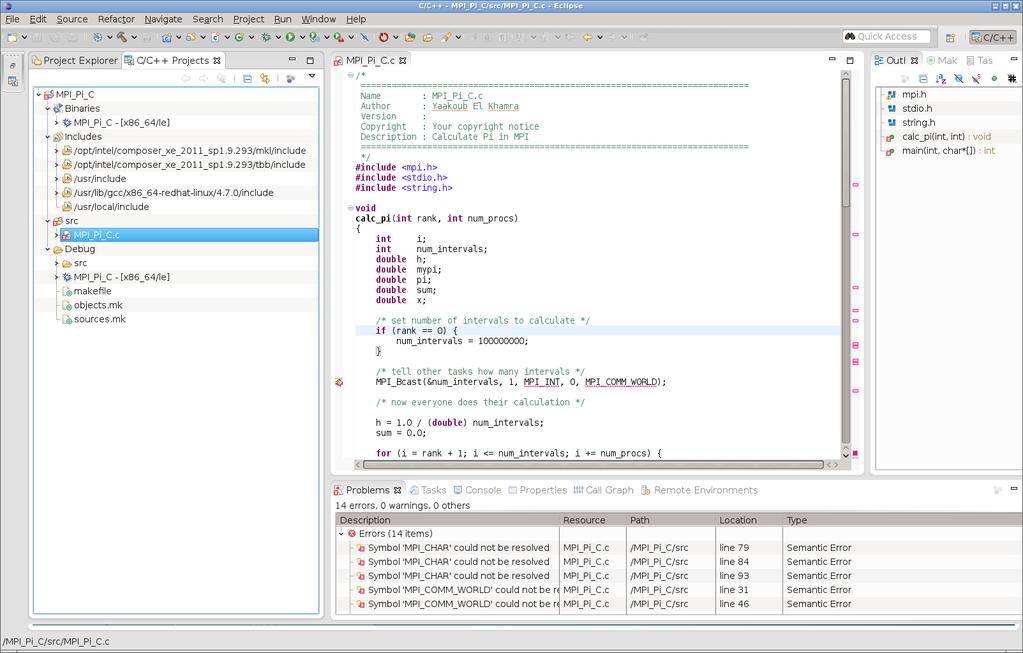
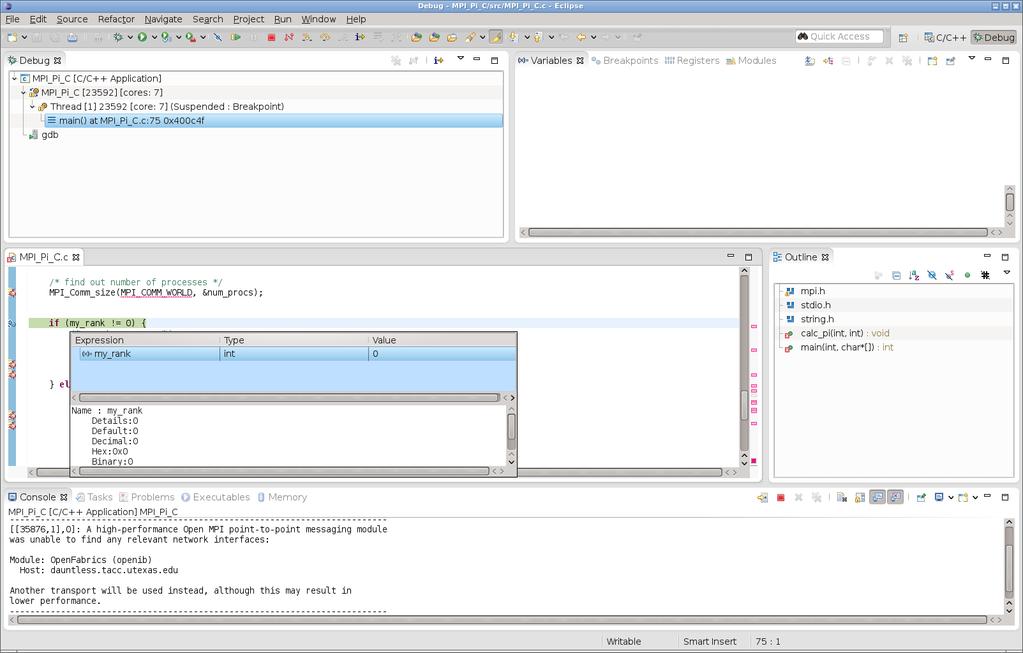
24 Notes on Eclipse PTP Eclipse PTP is FREE Eclipse PTP is part of XSEDE: your tickets about Eclipse PTP will be answered by the Eclipse PTP developers (they are good about tickets) Eclipse PTP is a great tool to debug code locally (i.e. on your own workstation/laptop) before moving to production on XSEDE systems Eclipse PTP supports remote development, with existing configurations for all XSEDE machines including TACC systems Power IDE with refactoring, code completion, static analysis, collaborative code development
25
26
27
28 Debugging: Conclusions You ALWAYS want to debug your code if: o Program exhibits erratic, random behavior when you are not using random o o o variables in control statements (hint: memory corruption/stomping) Program appears to "hang" somewhere: attach a debugger and see "where" it is stuck. Profiling will NOT help with "stuck" program flow Program exits way too fast (and you do not have exit error messages built into your code, which you want to consider) Wrong/bad results: unless you are working with infinite or semi-infinite Cantor sets, or attempting to use GiNaC, you should not be getting NaN's or Inf's in your variables: add conditional watch expressions to halt execution when you encounter these values (or use isnan, isinf functions in C) This is not to say that you cannot debug your code with print statements. Whatever gets your code operating at designed parameters: performance, readability, maintainability, rapid development, informative crashes/bug-free/idiot-proof etc... that is what you want to be doing. Debuggers get you there quicker
Profiling and debugging. Carlos Rosales September 18 th 2009 Texas Advanced Computing Center The University of Texas at Austin
 Profiling and debugging Carlos Rosales carlos@tacc.utexas.edu September 18 th 2009 Texas Advanced Computing Center The University of Texas at Austin Outline Debugging Profiling GDB DDT Basic use Attaching
Profiling and debugging. John Cazes Texas Advanced Computing Center
 Profiling and debugging John Cazes Texas Advanced Computing Center Outline Debugging Profiling GDB DDT Basic use Attaching to a running job Identify MPI problems using Message Queues Catch memory errors
Profiling and debugging. Yaakoub El Khamra Texas Advanced Computing Center
 Profiling and debugging Yaakoub El Khamra Texas Advanced Computing Center Outline Debugging GDB DDT PTP Basic use Attaching to a running job Identify MPI problems using Message Queues Catch memory errors
Debugging with TotalView
 Debugging with TotalView Le Yan HPC Consultant User Services Goals Learn how to start TotalView on Linux clusters Get familiar with TotalView graphic user interface Learn basic debugging functions of TotalView
CSE 351. GDB Introduction
 CSE 351 GDB Introduction Lab 2 Out either tonight or tomorrow Due April 27 th (you have ~12 days) Reading and understanding x86_64 assembly Debugging and disassembling programs Today: General debugging
Data and File Structures Laboratory
 Tools: GDB, Valgrind Assistant Professor Machine Intelligence Unit Indian Statistical Institute, Kolkata August, 2018 1 GDB 2 Valgrind A programmer s experience Case I int x = 10, y = 25; x = x++ + y++;
Debugging with GDB and DDT
 Debugging with GDB and DDT Ramses van Zon SciNet HPC Consortium University of Toronto June 28, 2012 1/41 Ontario HPC Summerschool 2012 Central Edition: Toronto Outline Debugging Basics Debugging with the
Debugging with GDB and DDT
 Debugging with GDB and DDT Ramses van Zon SciNet HPC Consortium University of Toronto June 13, 2014 1/41 Ontario HPC Summerschool 2014 Central Edition: Toronto Outline Debugging Basics Debugging with the
DDT Debugging Techniques
 DDT Debugging Techniques Carlos Rosales carlos@tacc.utexas.edu Scaling to Petascale 2010 July 7, 2010 Debugging Parallel Programs Usual problems Memory access issues Special cases not accounted for in
Welcome. HRSK Practical on Debugging, Zellescher Weg 12 Willers-Bau A106 Tel
 Center for Information Services and High Performance Computing (ZIH) Welcome HRSK Practical on Debugging, 03.04.2009 Zellescher Weg 12 Willers-Bau A106 Tel. +49 351-463 - 31945 Matthias Lieber (matthias.lieber@tu-dresden.de)
Guillimin HPC Users Meeting July 14, 2016
 Guillimin HPC Users Meeting July 14, 2016 guillimin@calculquebec.ca McGill University / Calcul Québec / Compute Canada Montréal, QC Canada Outline Compute Canada News System Status Software Updates Training
Debugging. P.Dagna, M.Cremonesi. May 2015
 Debugging P.Dagna, M.Cremonesi May 2015 Introduction Oneofthemostwidelyusedmethodstofindoutthereasonofa strange behavior in a program is the insertion of printf or write statements in the supposed critical
DDT: A visual, parallel debugger on Ra
 DDT: A visual, parallel debugger on Ra David M. Larue dlarue@mines.edu High Performance & Research Computing Campus Computing, Communications, and Information Technologies Colorado School of Mines March,
COSC 6374 Parallel Computation. Debugging MPI applications. Edgar Gabriel. Spring 2008
 COSC 6374 Parallel Computation Debugging MPI applications Spring 2008 How to use a cluster A cluster usually consists of a front-end node and compute nodes Name of the front-end node: shark.cs.uh.edu You
EE 355 Lab 3 - Algorithms & Control Structures
 1 Introduction In this lab you will gain experience writing C/C++ programs that utilize loops and conditional structures. This assignment should be performed INDIVIDUALLY. This is a peer evaluated lab
Allinea DDT Debugger. Dan Mazur, McGill HPC March 5,
 Allinea DDT Debugger Dan Mazur, McGill HPC daniel.mazur@mcgill.ca guillimin@calculquebec.ca March 5, 2015 1 Outline Introduction and motivation Guillimin login and DDT configuration Compiling for a debugger
Debug for GDB Users. Action Description Debug GDB $debug <program> <args> >create <program> <args>
 Page 1 of 5 Debug for GDB Users Basic Control To be useful, a debugger must be capable of basic process control. This functionally allows the user to create a debugging session and instruct the process
CSE 374 Programming Concepts & Tools
 CSE 374 Programming Concepts & Tools Hal Perkins Fall 2017 Lecture 11 gdb and Debugging 1 Administrivia HW4 out now, due next Thursday, Oct. 26, 11 pm: C code and libraries. Some tools: gdb (debugger)
Using gdb to find the point of failure
 gdb gdb is the GNU debugger on our CS machines. gdb is most effective when it is debugging a program that has debugging symbols linked in to it. With gcc and g++, this is accomplished using the -g option,
Parallel Debugging with TotalView BSC-CNS
 Parallel Debugging with TotalView BSC-CNS AGENDA What debugging means? Debugging Tools in the RES Allinea DDT as alternative (RogueWave Software) What is TotalView Compiling Your Program Starting totalview
CS 270 Systems Programming. Debugging Tools. CS 270: Systems Programming. Instructor: Raphael Finkel
 Debugging Tools CS 270: Systems Programming Instructor: Raphael Finkel Gdb: The Gnu debugger It runs on most computers and operating systems. It allows you to examine a running executable program. It does
Debugging process. The debugging process can be divided into four main steps: 1. Start your program, specifying anything that might affect its
 Debugging Introduction One of the most widely used methods to find out the reason of a strange behavior in a program is the insertion of printf or write statements in the supposed critical area. However
CSE 374 Programming Concepts & Tools. Brandon Myers Winter 2015 Lecture 11 gdb and Debugging (Thanks to Hal Perkins)
") CSE 374 Programming Concepts & Tools Brandon Myers Winter 2015 Lecture 11 gdb and Debugging (Thanks to Hal Perkins) Hacker tool of the week (tags) Problem: I want to find the definition of a function or
CSE 374 Programming Concepts & Tools Brandon Myers Winter 2015 Lecture 11 gdb and Debugging (Thanks to Hal Perkins) Hacker tool of the week (tags) Problem: I want to find the definition of a function or
Exercise Session 6 Computer Architecture and Systems Programming
 Systems Group Department of Computer Science ETH Zürich Exercise Session 6 Computer Architecture and Systems Programming Herbstsemester 2016 Agenda GDB Outlook on assignment 6 GDB The GNU Debugger 3 Debugging..
CSE 410: Systems Programming
 CSE 410: Systems Programming Recitation 4: Introduction to gdb Introduction The GNU Debugger, or gdb, is a powerful symbolic debugger. Symbolic debuggers are available for many languages and platforms,
Lecture 07 Debugging Programs with GDB
 Lecture 07 Debugging Programs with GDB In this lecture What is debugging Most Common Type of errors Process of debugging Examples Further readings Exercises What is Debugging Debugging is the process of
Introduction to debugging. Martin Čuma Center for High Performance Computing University of Utah
 Introduction to debugging Martin Čuma Center for High Performance Computing University of Utah m.cuma@utah.edu Overview Program errors Simple debugging Graphical debugging DDT and Totalview Intel tools
Program Design: Using the Debugger
 rogram Design, February 2, 2004 1 Program Design: Using the Debugger A debugger is an alternative to putting print (printf in C) statements in your program, recompiling and trying to find out what values
Scientific Programming in C IX. Debugging
 Scientific Programming in C IX. Debugging Susi Lehtola 13 November 2012 Debugging Quite often you spend an hour to write a code, and then two hours debugging why it doesn t work properly. Scientific Programming
Programming Studio #9 ECE 190
 Programming Studio #9 ECE 190 Programming Studio #9 Concepts: Functions review 2D Arrays GDB Announcements EXAM 3 CONFLICT REQUESTS, ON COMPASS, DUE THIS MONDAY 5PM. NO EXTENSIONS, NO EXCEPTIONS. Functions
Problem Set 1: Unix Commands 1
 Problem Set 1: Unix Commands 1 WARNING: IF YOU DO NOT FIND THIS PROBLEM SET TRIVIAL, I WOULD NOT RECOMMEND YOU TAKE THIS OFFERING OF 300 AS YOU DO NOT POSSESS THE REQUISITE BACKGROUND TO PASS THE COURSE.
Lab 8. Follow along with your TA as they demo GDB. Make sure you understand all of the commands, how and when to use them.
 Lab 8 Each lab will begin with a recap of last lab and a brief demonstration by the TAs for the core concepts examined in this lab. As such, this document will not serve to tell you everything the TAs
Source level debugging. October 18, 2016
 Source level debugging October 18, 2016 Source level debugging Source debugging is a nice tool for debugging execution problems; it can be particularly useful when working with crashed programs that leave
Debugging and Debugger. Terminology. GNU gcc and gdb. Debugging C programs in Unix and Windows Environments - Part One
 Debugging C programs in Unix and Windows Environments - Part One ICT106 Fundamentals of Computer Systems Eric Li Debugging and Debugger The process of finding bugs in code called Debugging; A must-have
CS2141 Software Development using C/C++ Debugging
 CS2141 Software Development using C/C++ Debugging Debugging Tips Examine the most recent change Error likely in, or exposed by, code most recently added Developing code incrementally and testing along
1. Allowed you to see the value of one or more variables, or 2. Indicated where you were in the execution of a program
 CS0449 GDB Lab What is a debugger? A debugger is a program that helps you find logical mistakes in your programs by running them in a controlled way. Undoubtedly by this point in your programming life,
GDB cheatsheet - page 1
 Running # gdb [core dump] Start GDB (with optional core dump). # gdb --args Start GDB and pass arguments # gdb --pid Start GDB and attach to process. set args
CS/COE 0449 term 2174 Lab 5: gdb
 CS/COE 0449 term 2174 Lab 5: gdb What is a debugger? A debugger is a program that helps you find logical mistakes in your programs by running them in a controlled way. Undoubtedly by this point in your
Debugging. Marcelo Ponce SciNet HPC Consortium University of Toronto. July 15, /41 Ontario HPC Summerschool 2016 Central Edition: Toronto
 Debugging Marcelo Ponce SciNet HPC Consortium University of Toronto July 15, 2016 1/41 Ontario HPC Summerschool 2016 Central Edition: Toronto Outline Debugging Basics Debugging with the command line: GDB
gdbtui - Linux Command
 tui tui - Linux Command -batch -cd= dir -f -b bps -tty= dev -s sym -e prog -se prog -c core cmds -d dir prog core procid]] SYNOPSIS -help-nx-q DESCRIPTION The purpose of a debugger such as GDB is to allow
HPCC - Hrothgar. Getting Started User Guide TotalView. High Performance Computing Center Texas Tech University
 HPCC - Hrothgar Getting Started User Guide TotalView High Performance Computing Center Texas Tech University HPCC - Hrothgar 2 Table of Contents *This user guide is under development... 3 1. Introduction...
Debugging and Profiling
 Debugging and Profiling Nate Woody 5/27/2009 www.cac.cornell.edu 1 Debugging Debugging is a methodical process of finding and reducing the number of bugs, or defects, in a computer program or a piece of
1 A Brief Introduction To GDB
 1 A Brief Introduction To GDB GDB, the GNU Project debugger, allows you to see what is going on inside another program while it executes or what another program was doing at the moment it crashed. GDB
Hands-on Workshop on How To Debug Codes at the Institute
 Hands-on Workshop on How To Debug Codes at the Institute H. Birali Runesha, Shuxia Zhang and Ben Lynch (612) 626 0802 (help) help@msi.umn.edu October 13, 2005 Outline Debuggers at the Institute Totalview
CSCI0330 Intro Computer Systems Doeppner. Lab 02 - Tools Lab. Due: Sunday, September 23, 2018 at 6:00 PM. 1 Introduction 0.
 CSCI0330 Intro Computer Systems Doeppner Lab 02 - Tools Lab Due: Sunday, September 23, 2018 at 6:00 PM 1 Introduction 0 2 Assignment 0 3 gdb 1 3.1 Setting a Breakpoint 2 3.2 Setting a Watchpoint on Local
Tips on Using GDB to Track Down and Stamp Out Software Bugs
 Tips on Using GDB to Track Down and Stamp Out Software Bugs Brett Viren Physics Department MINOS Week In The Woods, 2005 Brett Viren (Brookhaven National Lab) Using GDB to Debug Ely 2005 1 / 34 Outline
ECE/ME/EMA/CS 759 High Performance Computing for Engineering Applications
 ECE/ME/EMA/CS 759 High Performance Computing for Engineering Applications Elements of Program Debugging Dan Negrut, 2017 ECE/ME/EMA/CS 759 UW-Madison Debugging on Euler [with gdb] Slides on gdb include
CS354 gdb Tutorial Written by Chris Feilbach
 CS354 gdb Tutorial Written by Chris Feilbach Purpose This tutorial aims to show you the basics of using gdb to debug C programs. gdb is the GNU debugger, and is provided on systems that
The Dynamic Debugger gdb
 Introduction The Dynamic Debugger gdb This handout introduces the basics of using gdb, a very powerful dynamic debugging tool. No-one always writes programs that execute perfectly every time, and while
Debugging. ICS312 Machine-Level and Systems Programming. Henri Casanova
 Debugging ICS312 Machine-Level and Systems Programming Henri Casanova (henric@hawaii.edu) Debugging Even when written in high-level languages, programs have bugs Recall the thought that when moving away
Using the Debugger. Michael Jantz Dr. Prasad Kulkarni
 Using the Debugger Michael Jantz Dr. Prasad Kulkarni 1 Debugger What is it a powerful tool that supports examination of your program during execution. Idea behind debugging programs. Creates additional
The Eclipse Parallel Tools Platform
 May 1, 2012 Toward an Integrated Development Environment for Improved Software Engineering on Crays Agenda 1. What is the Eclipse Parallel Tools Platform (PTP) 2. Tour of features available in Eclipse/PTP
Performance Metrics (I)
") COSC 6374 Parallel Computation Parallel Metrics and Debugging MPI application Edgar Gabriel Fall 2014 Performance Metrics (I) Strong Scaling: how much faster does a problem run on p processors compared
COSC 6374 Parallel Computation Parallel Metrics and Debugging MPI application Edgar Gabriel Fall 2014 Performance Metrics (I) Strong Scaling: how much faster does a problem run on p processors compared
CNIT 127: Exploit Development. Ch 2: Stack Overflows in Linux
 CNIT 127: Exploit Development Ch 2: Stack Overflows in Linux Stack-based Buffer Overflows Most popular and best understood exploitation method Aleph One's "Smashing the Stack for Fun and Profit" (1996)
Using a debugger. Segmentation fault? GDB to the rescue!
 Using a debugger Segmentation fault? GDB to the rescue! But first... Let's talk about the quiz Let's talk about the previous homework assignment Let's talk about the current homework assignment K findkey(v
Development Environment & Linux Guide
 Development Environment & Linux Guide Juwon Lee(jwlee@archi.snu.ac.kr) School of Computer Science and Engineering Seoul National University Development Environment MobaXterm Provide Linux-like environment
TotalView. Debugging Tool Presentation. Josip Jakić
 TotalView Debugging Tool Presentation Josip Jakić josipjakic@ipb.ac.rs Agenda Introduction Getting started with TotalView Primary windows Basic functions Further functions Debugging parallel programs Topics
Embedded Software TI2726 B. 3. C tools. Koen Langendoen. Embedded Software Group
 Embedded Software 3. C tools TI2726 B Koen Langendoen Embedded Software Group C development cycle 1. [Think] 2. Edit 3. Compile 4. Test 5. Debug 6. Tune UNIX toolbox 2. vi, emacs, gedit 3. gcc, make 4.
Debugging at Scale Lindon Locks
 Debugging at Scale Lindon Locks llocks@allinea.com Debugging at Scale At scale debugging - from 100 cores to 250,000 Problems faced by developers on real systems Alternative approaches to debugging and
We first learn one useful option of gcc. Copy the following C source file to your
 Lecture 5 p.1 Faculty of Computer Science, Dalhousie University CSCI 2132 Software Development Lab 5: gcc and gdb tools 10-Oct-2018 Location: Teaching Labs Time: Thursday Instructor: Vlado Keselj Lab 5:
Reviewing gcc, make, gdb, and Linux Editors 1
 Reviewing gcc, make, gdb, and Linux Editors 1 Colin Gordon csgordon@cs.washington.edu University of Washington CSE333 Section 1, 3/31/11 1 Lots of material borrowed from 351/303 slides Colin Gordon (University
12. Debugging. Overview. COMP1917: Computing 1. Developing Programs. The Programming Cycle. Programming cycle. Do-it-yourself debugging
 COMP1917 12s2 Debugging 1 COMP1917: Computing 1 12. Debugging Overview Programming cycle Do-it-yourself debugging Debugging withgdb Nastier bugs Memory leaks COMP1917 12s2 Debugging 2 Developing Programs
Lab6 GDB debugging. Conventions. Department of Computer Science and Information Engineering National Taiwan University
 Lab6 GDB debugging 1 / 15 Learn how to perform source-level debugging with GDB. 2 / 15 Host Machine OS: Windows Target Machine Raspberry Pi (2 or 3) Build Machine A computer with a SD card slot OS: Ubuntu
Laboratory 1 Semester 1 11/12
 CS2106 National University of Singapore School of Computing Laboratory 1 Semester 1 11/12 MATRICULATION NUMBER: In this lab exercise, you will get familiarize with some basic UNIX commands, editing and
Section 1: Tools. Contents CS162. January 19, Make More details about Make Git Commands to know... 3
 CS162 January 19, 2017 Contents 1 Make 2 1.1 More details about Make.................................... 2 2 Git 3 2.1 Commands to know....................................... 3 3 GDB: The GNU Debugger
18-600: Recitation #3
 18-600: Recitation #3 Bomb Lab & GDB Overview September 12th, 2017 1 Today X86-64 Overview Bomb Lab Introduction GDB Tutorial 2 3 x86-64: Register Conventions Arguments passed in registers: %rdi, %rsi,
Software Development With Emacs: The Edit-Compile-Debug Cycle
 Software Development With Emacs: The Edit-Compile-Debug Cycle Luis Fernandes Department of Electrical and Computer Engineering Ryerson Polytechnic University August 8, 2017 The Emacs editor permits the
DEBUGGING ON FERMI PREPARING A DEBUGGABLE APPLICATION GDB. GDB on front-end nodes
 DEBUGGING ON FERMI Debugging your application on a system based on a BG/Q architecture like FERMI could be an hard task due to the following problems: the core files generated by a crashing job on FERMI
Debugging Techniques. CEFET Engineering Week
 Debugging Techniques CEFET Engineering Week Petrópolis, May 10 th 2017 Luís Tarrataca 1 Luís Tarrataca CEFET Engineering Week (Luís Tarrataca 8:00): Debugging Techniques Task 1 It is expected that course
GDB 1 GDB 2 GDB. Fortran Pascal GDB 4. hoge.c. Fig. 1. calc.c. Fig GDB. GDB Debian. # apt-get install gdb
 2003 advanced seminar Intelligent Systems Design Lab. 1 GDB 2003 3 31 : GDB GDB GDB 1 GDB GDB ( ) Free Software Foundation(FSF) GDB 5.3 C,C++ 1 Fortran Pascal GDB 4 GDB 2 GDB Fig. 1 hoge.c calc.c GDB Fig.
LAB #8. GDB can do four main kinds of things (plus other things in support of these) to help you catch bugs in the act:
 to help you catch bugs in the act:") LAB #8 Each lab will begin with a brief demonstration by the TAs for the core concepts examined in this lab. As such, this document will not serve to tell you everything the TAs will in the demo. It is
LAB #8 Each lab will begin with a brief demonstration by the TAs for the core concepts examined in this lab. As such, this document will not serve to tell you everything the TAs will in the demo. It is
Jackson State University Department of Computer Science CSC / Advanced Information Security Spring 2013 Lab Project # 5
 Jackson State University Department of Computer Science CSC 439-01/539-02 Advanced Information Security Spring 2013 Lab Project # 5 Use of GNU Debugger (GDB) for Reverse Engineering of C Programs in a
SU 2017 May 18/23 LAB 3 Bitwise operations, Program structures, Functions (pass-by-value), local vs. global variables. Debuggers
, local vs. global variables. Debuggers") SU 2017 May 18/23 LAB 3 Bitwise operations, Program structures, Functions (pass-by-value), local vs. global variables. Debuggers 1. Problem A Pass-by-value, and trace a program with debugger 1.1 Specification
SU 2017 May 18/23 LAB 3 Bitwise operations, Program structures, Functions (pass-by-value), local vs. global variables. Debuggers 1. Problem A Pass-by-value, and trace a program with debugger 1.1 Specification
Debugging for the hybrid-multicore age (A HPC Perspective) David Lecomber CTO, Allinea Software
 David Lecomber CTO, Allinea Software") Debugging for the hybrid-multicore age (A HPC Perspective) David Lecomber CTO, Allinea Software david@allinea.com Agenda What is HPC? How is scale affecting HPC? Achieving tool scalability Scale in practice
Debugging for the hybrid-multicore age (A HPC Perspective) David Lecomber CTO, Allinea Software david@allinea.com Agenda What is HPC? How is scale affecting HPC? Achieving tool scalability Scale in practice
Debugging HPC Applications. David Lecomber CTO, Allinea Software
 Debugging HPC Applications David Lecomber CTO, Allinea Software david@allinea.com Agenda Bugs and Debugging Debugging parallel applications Debugging OpenACC and other hybrid codes Debugging for Petascale
Chapter - 17 Debugging and Optimization. Practical C++ Programming Copyright 2003 O'Reilly and Associates Page 1
 Chapter - 17 Debugging and Optimization Practical C++ Programming Copyright 2003 O'Reilly and Associates Page 1 Debugging Techniques Divide and conquer Debug only code Debug Command Line Switch Note: Use
COSC 4397 Parallel Computation. Debugging and Performance Analysis of Parallel MPI Applications
 COSC 4397 Parallel Computation Debugging and Performance Analysis of Parallel MPI Applications Edgar Gabriel Spring 2006 Edgar Gabriel Debugging sequential applications Several ways how to debug a sequential
SGI Altix Getting Correct Code Reiner Vogelsang SGI GmbH
 SGI Altix Getting Correct Code Reiner Vogelsang SGI GmbH reiner@sgi.com Module Objectives After completing the module, you will able to Find caveats and hidden errors in application codes Handle debuggers
Your code must have been compiled with the -g compiler option. Example:
 ddd Tips This provides some helpful information about the Unix ddd debugger. with more detailed information: There are other resources available gnu ddd manual matloff ddd information Contents Prerequisites...
Laboratory Assignment #4 Debugging in Eclipse CDT 1
 Lab 4 (10 points) November 20, 2013 CS-2301, System Programming for Non-majors, B-term 2013 Objective Laboratory Assignment #4 Debugging in Eclipse CDT 1 Due: at 11:59 pm on the day of your lab session
Supplement: Visual C++ Debugging
 Supplement: Visual C++ Debugging For Introduction to C++ Programming By Y. Daniel Liang Note: The screen shots are taken from VC++ 2010. It is the same for the later version. 1 Introduction The debugger
IBM i Debugger. Overview Service Entry Points Debugger Functions Attach to an IBM i Job Launch Configurations and Settings
 1 IBM i Debugger IBM i Debugger Overview Service Entry Points Debugger Functions Attach to an IBM i Job Launch Configurations and Settings 2 Integrated Debugger - Overview RPG, COBOL, CL, C, and C++ IBM
Princeton University COS 217: Introduction to Programming Systems GDB Tutorial and Reference
 Princeton University COS 217: Introduction to Programming Systems GDB Tutorial and Reference Part 1: Tutorial This tutorial describes how to use a minimal subset of the gdb debugger. For more information
Project #1: Tracing, System Calls, and Processes
 Project #1: Tracing, System Calls, and Processes Objectives In this project, you will learn about system calls, process control and several different techniques for tracing and instrumenting process behaviors.
LAB #8. Last Survey, I promise!!! Please fill out this really quick survey about paired programming and information about your declared major and CS.
 LAB #8 Each lab will begin with a brief demonstration by the TAs for the core concepts examined in this lab. As such, this document will not serve to tell you everything the TAs will in the demo. It is
Programming in C S c o t t S c h r e m m e r
 Programming in C S c o t t S c h r e m m e r Outline Introduction Data Types and structures Pointers, arrays and dynamic memory allocation Functions and prototypes input/output comparisons compiling/makefiles/debugging
CMPSC 311- Introduction to Systems Programming Module: Debugging
 CMPSC 311- Introduction to Systems Programming Module: Debugging Professor Patrick McDaniel Fall 2016 Debugging Often the most complicated and time-consuming part of developing a program is debugging.
Review of Scientific Programming in C and Fortran. Michael McLennan Software Architect HUBzero Platform for Scientific Collaboration
 Review of Scientific Programming in C and Fortran Michael McLennan Software Architect HUBzero Platform for Scientific Collaboration Monte Carlo Simulator Simulate by randomly generating thousands of tracks?
MPI Runtime Error Detection with MUST
 MPI Runtime Error Detection with MUST At the 27th VI-HPS Tuning Workshop Joachim Protze IT Center RWTH Aachen University April 2018 How many issues can you spot in this tiny example? #include #include
CMPT 300. Operating Systems. Brief Intro to UNIX and C
 CMPT 300 Operating Systems Brief Intro to UNIX and C Outline Welcome Review Questions UNIX basics and Vi editor Using SSH to remote access Lab2(4214) Compiling a C Program Makefile Basic C/C++ programming
Software Engineering Testing and Debugging Debugging
 Software Engineering Testing and Debugging Debugging Prof. Dr. Peter Thiemann Universität Freiburg 13.07.2009 Today s Topic Last Lecture Bug tracking Program control Design for Debugging Input simplification
Software Engineering
 Software Engineering Lecture 12: Testing and Debugging Debugging Peter Thiemann University of Freiburg, Germany 13.06.2013 Today s Topic Last Lecture Bug tracking Program control Design for Debugging Input
GDB Linux GNU Linux Distribution. gdb gcc g++ -g gdb EB_01.cpp
 B Linux GDB GDB Linux GNU GPL Linux Distribution Linux E-B.1 gcc g++ -g EB_01.cpp EB_01.cpp E/EB/EB_01.cpp 1 2 3 4 5 6 7 8 9 10 11 12 13 14 15 16 17 18 19 /**** :EB_01.cpp : *****/ #include
Today s Topic. Software Engineering Testing and Debugging Debugging. Today s Topic. The Main Steps in Systematic Debugging
 Today s Topic Software Engineering Testing and Debugging Debugging Prof. Dr. Peter Thiemann Last Lecture Bug tracking Program control Design for Debugging Input simplification Universität Freiburg 22.06.2011
CMPSC 311- Introduction to Systems Programming Module: Debugging
 CMPSC 311- Introduction to Systems Programming Module: Debugging Professor Patrick McDaniel Fall 2014 Debugging Often the most complicated and time-consuming part of developing a program is debugging.
Debugging Your CUDA Applications With CUDA-GDB
 Debugging Your CUDA Applications With CUDA-GDB Outline Introduction Installation & Usage Program Execution Control Thread Focus Program State Inspection Run-Time Error Detection Tips & Miscellaneous Notes
The First Real Bug. gdb. Computer Organization I McQuain
 The First Real Bug 1 Debugging vs Testing 2 Software testing is any activity aimed at evaluating an attribute or capability of a program and determining whether it meets its specified results All about
XSEDE New User Tutorial
 April 2, 2014 XSEDE New User Tutorial Jay Alameda National Center for Supercomputing Applications XSEDE Training Survey Make sure you sign the sign in sheet! At the end of the module, I will ask you to
Computer Science II Lab 3 Testing and Debugging
 Computer Science II Lab 3 Testing and Debugging Introduction Testing and debugging are important steps in programming. Loosely, you can think of testing as verifying that your program works and debugging
Basic functions of a debugger
 UNIVERSITY OF CALIFORNIA Department of Electrical Engineering and Computer Sciences Computer Science Division CS61B Spring 1998 P. N. Hilfinger Simple Use of GDB A debugger is a program that runs other