Matlab for Engineers
|
|
|
- Helen Wood
- 6 years ago
- Views:
Transcription

1 Matlab for Engineers Alistair Johnson 31st May 2012 Centre for Doctoral Training in Healthcare Innovation Institute of Biomedical Engineering Department of Engineering Science University of Oxford Supported by the RCUK Digital Economy Programme grant number EP/G036861/1
2 Overview Commenting your code Functions overview Function types Function Input/Output Input parsing Memory efficiency Statistics Available stats in MATLAB Useful GUIs Plotting Help
3 Commenting your code
4 Commenting Commenting is vital for not only others to understand your code (i.e. supervisor), but for yourself later Commenting your code is like cleaning your bathroom you never want to do it, but it really does create a more pleasant experience for you and your guests. Of course - commenting properly will never lead to this situation you should comment your code as you write it, not after.
5 Compare:
6 Compare:
7 Commenting new files TODO:... add syntax to the header comment... add examples to the header comment... describe the inputs... describe the outputs... copyright and licensing... don't forget SI units where needed! Provided function: newfun.m Try it out now!
8 Function Basics Function Types and Scope Function Input/Output Help files
9 Function Types and Scope Primary Function Subfunction Nested Function Overloaded Function Private Function Anonymous Function
10 Function Types and Scope Primary Function Subfunction Nested Function Overloaded Function Private Function Anonymous Function
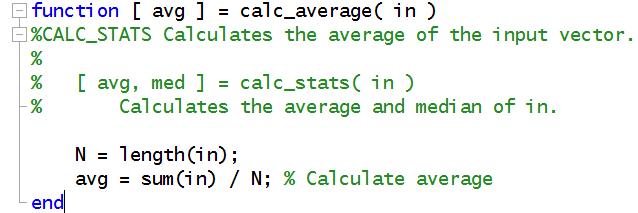
11 Primary Function Basic function type Requires first line to be function definition line
12 Primary Function
13 Why use a Primary Function? Functions are useful to: Easily re-run code with different inputs Keep code modular Keep code neat!
14 Subfunction Functions embedded within a primary function Appear after primary function's body
15 Why a subfunction? Useful for functions which parse input arguments Initializing values (say a vector of coefficients) Repeated calculations used only in the above function
16 Nested Function Function within another function Inherits the workspace of the parent function Cannot be written inside program control statements (e. g., if, switch, try...) Can nest functions within functions
17 Nested Function
18 Why a Nested Function?
19 Overloaded Functions When two functions must have different functionalities for different types of inputs Each function must go in a class path Example: ~/home/alistair/@double/calc_average.m ~/home/alistair/@int32/calc_average.m
20 Overloaded Functions
21 Why an Overloaded Function? Want a function to behave differently if given, e.g., a char or cell input Only really needed if you plan on releasing a robust toolbox of some sort..

22 Private Function Located in a sub-folder named private Identical to primary function Only visible to functions in the parent folder Sub-folder private should NOT be in the MATLAB path Example:

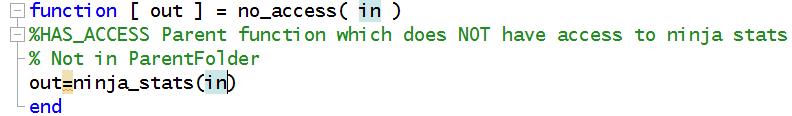
23 Private Function Example Execution:
24 Why a Private Function? Prevents MATLAB functions from calling the function you wrote (e.g., you wrote a function called 'predict') Desirable to have non-standard behaviour for some of your functions
25 Anonymous Function Defined in-line fhandle expression Useful for quick function handles to pass to other functions fcn x.^2; y=cellfun(@(x) x.^2, X);
26 Why use an Anonymous Function? When you want to write a quick function ex7_anonymous When you are using cellfun, arrayfun, etc We will go over this later
27 Function Basics Function Types and Scope Function Input/Output
28 Function Input/Output nargin, nargout Give the number of input/output arguments Useful for argument checking
29 Variable Function Input varargin All inputs combined into a cell array
30 Variable Function Output varargout
31 Input parser MATLAB has an inputparser class which is useful for parsing input arguments... as you might have guessed. inpparserexample.m is an example MATLAB function which uses the main features of the input parser
32 Input parser inpparserexample.m inputs are: required optional parameter-value pairs
33

34 Saving memory Though your 8GB of memory should handle most things fine - best practice is to not be wasteful


35 Saving memory 2D grayscale 2D colour 2D time 3D For those doing medical imaging - memory can become a real concern! 8 bytes x 256 x 256 = 0.5 MB 8 bytes x 256 x 256 x 3 = 1.5 MB 8 bytes x 256 x 256 x 3 x 60 = 90 MB 8 bytes x 256 x 256 x 3 x 60 x 80 = 7200 MB
36 Saving memory Take advantage of copy-on-write behaviour Say you called a function: output = f(x) If you modify x in any way MATLAB copies the array If you do not modify x MATLAB uses the original x
37 Saving memory Take advantage of in-place operations If... You have a function which modifies a large data array You do not care about the input afterward Then... You should call the function as such: x = f(x) MATLAB will not produce unneeded copies
38 Saving memory If... Then... You modify parts of an input, but not all of it You should make the input a structure, and only modify some fields Example: ex7_2_savingmemory
39 Saving memory If you have large data arrays Avoid using large cell arrays with small individual elements each cell has ~80 bytes overhead Preallocate biggest arrays first Consider using nested functions to save passing data to a function that modifies it MATLAB uses a heap - don't worry about the details, just do this Be careful leaving your MATLAB running for too long (~days), Windows will fragment the memory
40 Statistics Almost all of you will need to use rudimentary statistics eventually e.g. t-test, ks-test,... MATLAB is here to make life easy!

41 Statistics Which to choose? Is my data normally distributed? [h,p] = jbtest(data)
42 Type of Data Goal Measurement (from Gaussian Population) Rank, Score, or Measurement (from Non- Gaussian Population) Binomial (Two Possible Outcomes) Describe one group Mean, SD mu = mean(data) sigma = std(data) Median, interquartile range med = median(data) quant = iqr(data) Proportion prop = mean(data) Compare one group to a hypothetical value One-sample t test Wilcoxon test p = signrank(data,val) Chi-square or Binomial test ** [h,p]=vartest(data,var) Compare two unpaired groups e.g., diabetics vs non-diabetics Unpaired t test Mann-Whitney test p = ranksum(data1,data2) Fisher's test [h,p]=vartest2(data1, DATA2) Compare two paired groups e.g., diabetics before and after treatment Paired t test [h,p] = ttest(data1,data2) Wilcoxon test p = signrank(data1,data2) McNemar's test File Exchange Compare three or more unmatched groups One-way ANOVA p = anova1(data) Kruskal-Wallis test p = kruskalwallis(data1) Chi-square test File Exchange Compare three or more matched groups Repeated measures ANOVA p = anovan(data,groups) Friedman test p = friedman(data,reps) Cochrane Q** File Exchange Quantify association between two variables Pearson correlation c = corr(data1,data2,... 'type','pearson') Spearman correlation c = corr(data1,data2,... 'type','spearman') Contingency coefficients** File Exchange [h,p] = ttest(data, VAL) [h,p] = ttest2(data1,data2)
43

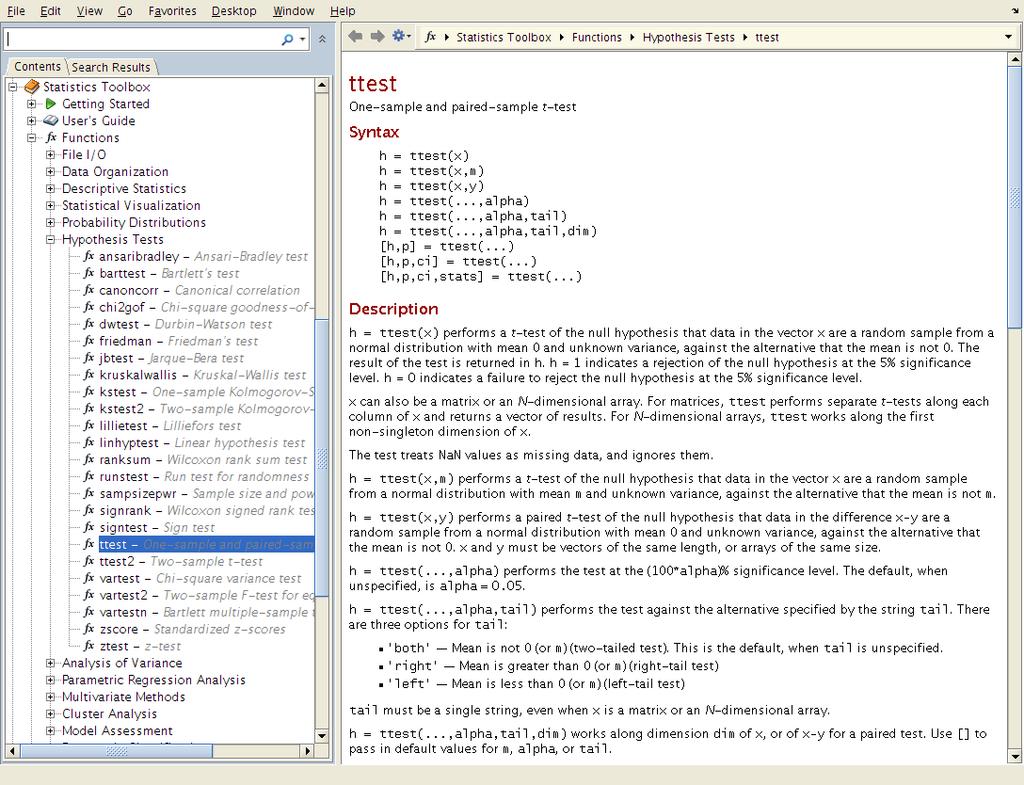
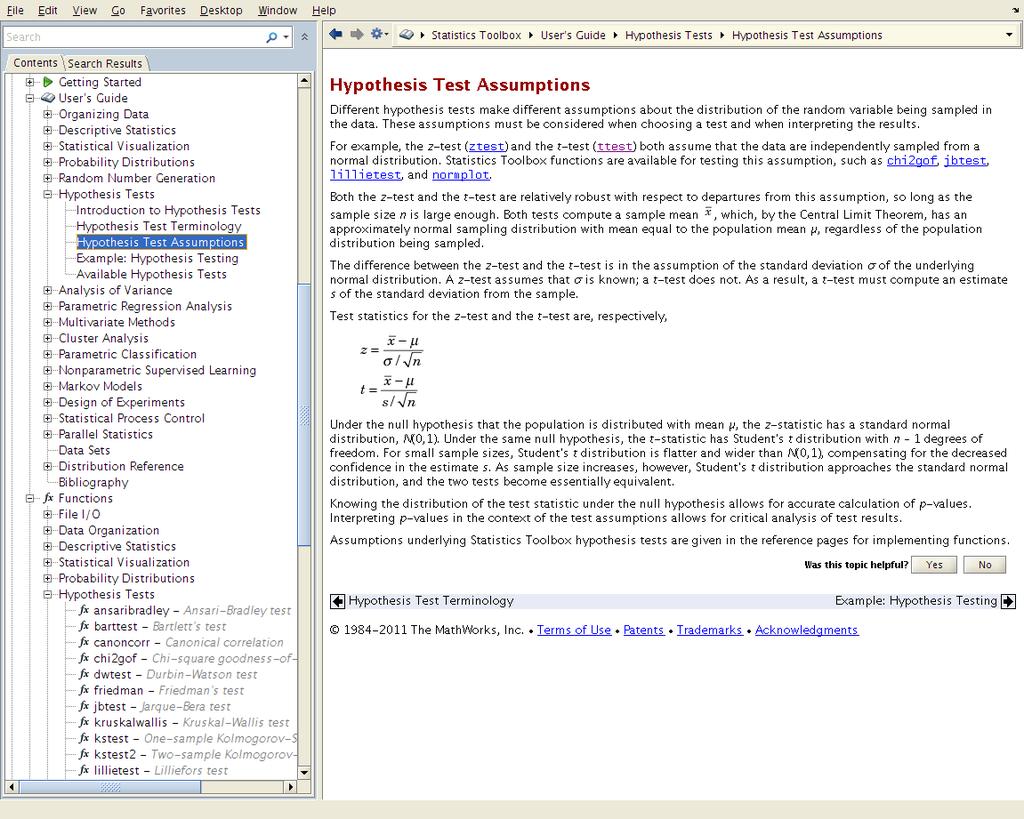
44 More info with help files MATLAB Help is, put simply, amazing

45 Help files Always be sure to check the user's guide!
46

47 Statistics Many available GUIs!
48 Plotting You will inevitably have to graph something for your project While excel is nice for plots (I'm lying - it really isn't), MATLAB really excels at visualization
49 The basics Plotting functions you will use: plot scatter bar stem All of them are very similar - let's look at scatter
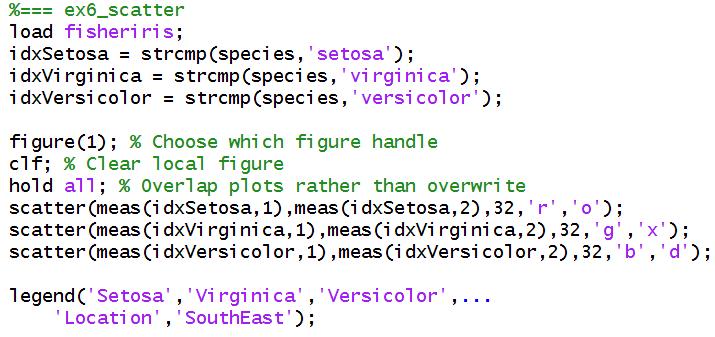
50 Scatter
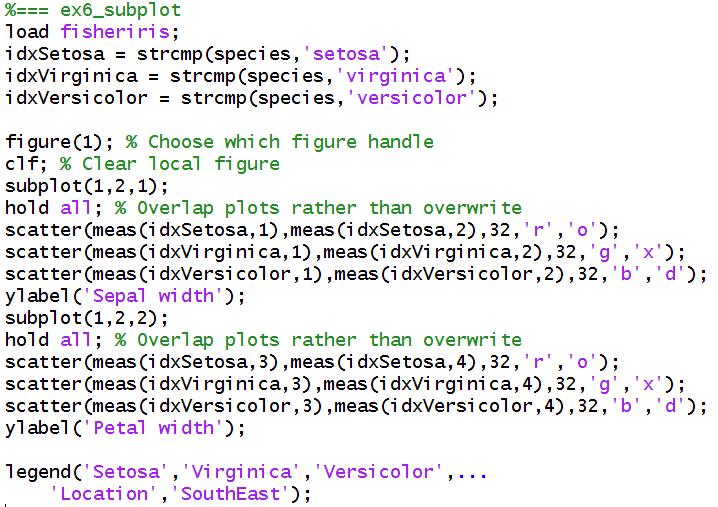
51 Subplots
52 Setting axes If you show multiple plots - consistent axes are a must axis([xmin xmax ymin ymax]); ex6_3_axes

53 Setting axes axis([xmin xmax ymin ymax]);
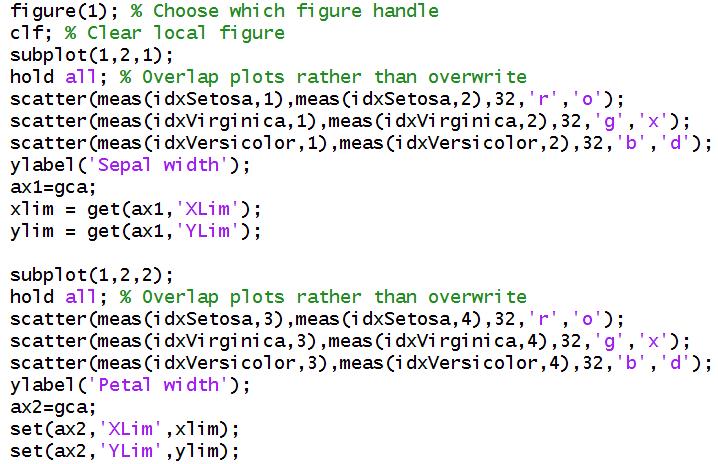
54 Axes properties
55 Axes properties

56 Linking axes

57 Tick Labels

58 Font sizes!
FreeJSTAT for Windows. Manual
 FreeJSTAT for Windows Manual (c) Copyright Masato Sato, 1998-2018 1 Table of Contents 1. Introduction 3 2. Functions List 6 3. Data Input / Output 7 4. Summary Statistics 8 5. t-test 9 6. ANOVA 10 7. Contingency
Nuts and Bolts Research Methods Symposium
 Organizing Your Data Jenny Holcombe, PhD UT College of Medicine Nuts & Bolts Conference August 16, 3013 Topics to Discuss: Types of Variables Constructing a Variable Code Book Developing Excel Spreadsheets
One way ANOVA when the data are not normally distributed (The Kruskal-Wallis test).
.") One way ANOVA when the data are not normally distributed (The Kruskal-Wallis test). Suppose you have a one way design, and want to do an ANOVA, but discover that your data are seriously not normal? Just
One way ANOVA when the data are not normally distributed (The Kruskal-Wallis test). Suppose you have a one way design, and want to do an ANOVA, but discover that your data are seriously not normal? Just
Bluman & Mayer, Elementary Statistics, A Step by Step Approach, Canadian Edition
 Bluman & Mayer, Elementary Statistics, A Step by Step Approach, Canadian Edition Online Learning Centre Technology Step-by-Step - Minitab Minitab is a statistical software application originally created
Organizing Your Data. Jenny Holcombe, PhD UT College of Medicine Nuts & Bolts Conference August 16, 3013
 Organizing Your Data Jenny Holcombe, PhD UT College of Medicine Nuts & Bolts Conference August 16, 3013 Learning Objectives Identify Different Types of Variables Appropriately Naming Variables Constructing
Why is Statistics important in Bioinformatics?
 Why is Statistics important in Bioinformatics? Random processes are inherent in evolution and in sampling (data collection). Errors are often unavoidable in the data collection process. Statistics helps
Product Catalog. AcaStat. Software
 Product Catalog AcaStat Software AcaStat AcaStat is an inexpensive and easy-to-use data analysis tool. Easily create data files or import data from spreadsheets or delimited text files. Run crosstabulations,
Index. Bar charts, 106 bartlett.test function, 159 Bottles dataset, 69 Box plots, 113
 Index A Add-on packages information page, 186 187 Linux users, 191 Mac users, 189 mirror sites, 185 Windows users, 187 aggregate function, 62 Analysis of variance (ANOVA), 152 anova function, 152 as.data.frame
SPSS: AN OVERVIEW. V.K. Bhatia Indian Agricultural Statistics Research Institute, New Delhi
 SPSS: AN OVERVIEW V.K. Bhatia Indian Agricultural Statistics Research Institute, New Delhi-110012 The abbreviation SPSS stands for Statistical Package for the Social Sciences and is a comprehensive system
STATS PAD USER MANUAL
 STATS PAD USER MANUAL For Version 2.0 Manual Version 2.0 1 Table of Contents Basic Navigation! 3 Settings! 7 Entering Data! 7 Sharing Data! 8 Managing Files! 10 Running Tests! 11 Interpreting Output! 11
User Defined Functions
 User Defined Functions 120 90 1 0.8 60 Chapter 6 150 0.6 0.4 30 0.2 180 0 210 330 240 270 300 Objectives Create and use MATLAB functions with both single and multiple inputs and outputs Learn how to store
Interval Estimation. The data set belongs to the MASS package, which has to be pre-loaded into the R workspace prior to use.
 Interval Estimation It is a common requirement to efficiently estimate population parameters based on simple random sample data. In the R tutorials of this section, we demonstrate how to compute the estimates.
SECTION 2: PROGRAMMING WITH MATLAB. MAE 4020/5020 Numerical Methods with MATLAB
 SECTION 2: PROGRAMMING WITH MATLAB MAE 4020/5020 Numerical Methods with MATLAB 2 Functions and M Files M Files 3 Script file so called due to.m filename extension Contains a series of MATLAB commands The
GraphPad Prism Features
 GraphPad Prism Features GraphPad Prism 4 is available for both Windows and Macintosh. The two versions are very similar. You can open files created on one platform on the other platform with no special
Matlab for Engineers
 Matlab for Engineers Alistair Johnson 31st May 2012 Centre for Doctoral Training in Healthcare Innovation Institute of Biomedical Engineering Department of Engineering Science University of Oxford Supported
Minitab 17 commands Prepared by Jeffrey S. Simonoff
 Minitab 17 commands Prepared by Jeffrey S. Simonoff Data entry and manipulation To enter data by hand, click on the Worksheet window, and enter the values in as you would in any spreadsheet. To then save
1 >> Lecture 3 2 >> 3 >> -- Functions 4 >> Zheng-Liang Lu 169 / 221
 1 >> Lecture 3 2 >> 3 >> -- Functions 4 >> Zheng-Liang Lu 169 / 221 Functions Recall that an algorithm is a feasible solution to the specific problem. 1 A function is a piece of computer code that accepts
The ctest Package. January 3, 2000
 R objects documented: The ctest Package January 3, 2000 bartlett.test....................................... 1 binom.test........................................ 2 cor.test.........................................
MINITAB Release Comparison Chart Release 14, Release 13, and Student Versions
 Technical Support Free technical support Worksheet Size All registered users, including students Registered instructors Number of worksheets Limited only by system resources 5 5 Number of cells per worksheet
Data Management - Summary statistics - Graphics Choose a dataset to work on, maybe use it already
 Exercises Day 1 Data Management - Summary statistics - Graphics Choose a dataset to work on, maybe use it already Day 2 Inference introduction R Data Management - Summary statistics - Graphics Days 3 and
Question Points Score Total 100
 Name Signature General instructions: You may not ask questions during the test. If you believe that there is something wrong with a question, write down what you think the question is trying to ask and
SPSS Modules Features
 SPSS Modules Features Core System Functionality (included in every license) Data access and management Data Prep features: Define Variable properties tool; copy data properties tool, Visual Bander, Identify
SPSS: AN OVERVIEW. SEEMA JAGGI Indian Agricultural Statistics Research Institute Library Avenue, New Delhi
 : AN OVERVIEW SEEMA JAGGI Indian Agricultural Statistics Research Institute Library Avenue, New Delhi-110 012 seema@iasri.res.in 1. Introduction The abbreviation SPSS stands for Statistical Package for
The Power and Sample Size Application
 Chapter 72 The Power and Sample Size Application Contents Overview: PSS Application.................................. 6148 SAS Power and Sample Size............................... 6148 Getting Started:
FUNCTIONS ( WEEK 5 ) DR. USMAN ULLAH SHEIKH DR. MUSA MOHD MOKJI DR. MICHAEL TAN LONG PENG DR. AMIRJAN NAWABJAN DR. MOHD ADIB SARIJARI
 DR. USMAN ULLAH SHEIKH DR. MUSA MOHD MOKJI DR. MICHAEL TAN LONG PENG DR. AMIRJAN NAWABJAN DR. MOHD ADIB SARIJARI") FUNCTIONS SKEE1022 SCIENTIFIC PROGRAMMING ( WEEK 5 ) DR. USMAN ULLAH SHEIKH DR. MUSA MOHD MOKJI DR. MICHAEL TAN LONG PENG DR. AMIRJAN NAWABJAN DR. MOHD ADIB SARIJARI OBJECTIVES Create Function 1) Create
FUNCTIONS SKEE1022 SCIENTIFIC PROGRAMMING ( WEEK 5 ) DR. USMAN ULLAH SHEIKH DR. MUSA MOHD MOKJI DR. MICHAEL TAN LONG PENG DR. AMIRJAN NAWABJAN DR. MOHD ADIB SARIJARI OBJECTIVES Create Function 1) Create
WolStat: A new statistics package for the behavioral and social sciences
 Behavior Research Methods 2008, 40 (I), 94-101 doi: 10.3758/13RM40.1.94 WolStat: A new statistics package for the behavioral and social sciences ALLEN H. WOLACH Illinois Institute of Technology, Chicago,
Table Of Contents. Table Of Contents
 Statistics Table Of Contents Table Of Contents Basic Statistics... 7 Basic Statistics Overview... 7 Descriptive Statistics Available for Display or Storage... 8 Display Descriptive Statistics... 9 Store
JMP 10 Student Edition Quick Guide
 JMP 10 Student Edition Quick Guide Instructions presume an open data table, default preference settings and appropriately typed, user-specified variables of interest. RMC = Click Right Mouse Button Graphing
The results section of a clinicaltrials.gov file is divided into discrete parts, each of which includes nested series of data entry screens.
 OVERVIEW The ClinicalTrials.gov Protocol Registration System (PRS) is a web-based tool developed for submitting clinical trials information to ClinicalTrials.gov. This document provides step-by-step instructions
StatCalc User Manual. Version 9 for Mac and Windows. Copyright 2018, AcaStat Software. All rights Reserved.
 StatCalc User Manual Version 9 for Mac and Windows Copyright 2018, AcaStat Software. All rights Reserved. http://www.acastat.com Table of Contents Introduction... 4 Getting Help... 4 Uninstalling StatCalc...
Want to Do a Better Job? - Select Appropriate Statistical Analysis in Healthcare Research
 Want to Do a Better Job? - Select Appropriate Statistical Analysis in Healthcare Research Liping Huang, Center for Home Care Policy and Research, Visiting Nurse Service of New York, NY, NY ABSTRACT The
CDA6530: Performance Models of Computers and Networks. Chapter 4: Using Matlab for Performance Analysis and Simulation
 CDA6530: Performance Models of Computers and Networks Chapter 4: Using Matlab for Performance Analysis and Simulation Objective Learn a useful tool for mathematical analysis and simulation Interpreted
Table of Contents. Introduction.*.. 7. Part /: Getting Started With MATLAB 5. Chapter 1: Introducing MATLAB and Its Many Uses 7
 MATLAB Table of Contents Introduction.*.. 7 About This Book 1 Foolish Assumptions 2 Icons Used in This Book 3 Beyond the Book 3 Where to Go from Here 4 Part /: Getting Started With MATLAB 5 Chapter 1:
Matlab Advanced Programming. Matt Wyant University of Washington
 Matlab Advanced Programming Matt Wyant University of Washington Matlab as a programming Language Strengths (as compared to C/C++/Fortran) Fast to write -no type declarations needed Memory allocation/deallocation
MATLAB for Engineers
 Centre for Doctoral Training in Healthcare Innovation Institute of Biomedical Engineering Department of Engineering Science University of Oxford Supported by the RCUK Digital Economy Programme grant number
Base package The Base subscription includes the following features:
 IBM SPSS Statistics Subscription: Base, add-ons and features 1 2 3 Base package The Base subscription includes the following features: Data access and management Compare two data files for compatibility
Statistical Pattern Recognition
 Statistical Pattern Recognition Features and Feature Selection Hamid R. Rabiee Jafar Muhammadi Spring 2014 http://ce.sharif.edu/courses/92-93/2/ce725-2/ Agenda Features and Patterns The Curse of Size and
1 >> Lecture 3 2 >> 3 >> -- Functions 4 >> Zheng-Liang Lu 172 / 225
 1 >> Lecture 3 2 >> 3 >> -- Functions 4 >> Zheng-Liang Lu 172 / 225 Functions The first thing of the design of algorithms is to divide and conquer. A large and complex problem would be solved by couples
Minitab 18 Feature List
 Minitab 18 Feature List * New or Improved Assistant Measurement systems analysis * Capability analysis Graphical analysis Hypothesis tests Regression DOE Control charts * Graphics Scatterplots, matrix
STAT - Edit Scroll up the appropriate list to highlight the list name at the very top Press CLEAR, followed by the down arrow or ENTER
 Entering/Editing Data Use arrows to scroll to the appropriate list and position Enter or edit data, pressing ENTER after each (including the last) Deleting Data (One Value at a Time) Use arrows to scroll
Fathom Dynamic Data TM Version 2 Specifications
 Data Sources Fathom Dynamic Data TM Version 2 Specifications Use data from one of the many sample documents that come with Fathom. Enter your own data by typing into a case table. Paste data from other
Total Number of Students in US (millions)
") The goal of this technology assignment is to graph a formula on your calculator and in Excel. This assignment assumes that you have a TI 84 or similar calculator and are using Excel 2007. The formula you
The goal of this technology assignment is to graph a formula on your calculator and in Excel. This assignment assumes that you have a TI 84 or similar calculator and are using Excel 2007. The formula you
Subject. Creating a diagram. Dataset. Importing the data file. Descriptive statistics with TANAGRA.
 Subject Descriptive statistics with TANAGRA. The aim of descriptive statistics is to describe the main features of a collection of data in quantitative terms 1. The visualization of the whole data table
Eksamen ERN4110, 6/ VEDLEGG SPSS utskrifter til oppgavene (Av plasshensyn kan utskriftene være noe redigert)
") Eksamen ERN4110, 6/9-2018 VEDLEGG SPSS utskrifter til oppgavene (Av plasshensyn kan utskriftene være noe redigert) 1 Oppgave 1 Datafila I SPSS: Variabelnavn Beskrivelse Kjønn Kjønn (1=Kvinne, 2=Mann) Studieinteresse
Eksamen ERN4110, 6/9-2018 VEDLEGG SPSS utskrifter til oppgavene (Av plasshensyn kan utskriftene være noe redigert) 1 Oppgave 1 Datafila I SPSS: Variabelnavn Beskrivelse Kjønn Kjønn (1=Kvinne, 2=Mann) Studieinteresse
Introduction to Data Science. Introduction to Data Science with Python. Python Basics: Basic Syntax, Data Structures. Python Concepts (Core)
") Introduction to Data Science What is Analytics and Data Science? Overview of Data Science and Analytics Why Analytics is is becoming popular now? Application of Analytics in business Analytics Vs Data
Introduction to Data Science What is Analytics and Data Science? Overview of Data Science and Analytics Why Analytics is is becoming popular now? Application of Analytics in business Analytics Vs Data
CDA5530: Performance Models of Computers and Networks. Chapter 8: Using Matlab for Performance Analysis and Simulation
 CDA5530: Performance Models of Computers and Networks Chapter 8: Using Matlab for Performance Analysis and Simulation Objective Learn a useful tool for mathematical analysis and simulation Interpreted
Spreadsheet View and Basic Statistics Concepts
 Spreadsheet View and Basic Statistics Concepts GeoGebra 3.2 Workshop Handout 9 Judith and Markus Hohenwarter www.geogebra.org Table of Contents 1. Introduction to GeoGebra s Spreadsheet View 2 2. Record
Lecture 6 MATLAB programming (4) Dr.Qi Ying
 Dr.Qi Ying") Lecture 6 MATLAB programming (4) Dr.Qi Ying Objectives User-defined Functions Anonymous Functions Function name as an input argument Subfunctions and nested functions Arguments persistent variable Anonymous
Lecture 6 MATLAB programming (4) Dr.Qi Ying Objectives User-defined Functions Anonymous Functions Function name as an input argument Subfunctions and nested functions Arguments persistent variable Anonymous
APPENDIX. Appendix 2. HE Staining Examination Result: Distribution of of BALB/c
 APPENDIX Appendix 2. HE Staining Examination Result: Distribution of of BALB/c mice nucleus liver cells changes in percents between control group and intervention groups. Descriptives Groups Statistic
MegaStat User s Guide
 MegaStat User s Guide for Mac Excel 2016 Copyright 2017 by J. B. Orris Table of Contents 1. Basic Procedures... 2 Buttons... 4 Data Selection... 5 Entering values... 6 Data Labels... 6 Output... 7 Repeat
Statistical Pattern Recognition
 Statistical Pattern Recognition Features and Feature Selection Hamid R. Rabiee Jafar Muhammadi Spring 2013 http://ce.sharif.edu/courses/91-92/2/ce725-1/ Agenda Features and Patterns The Curse of Size and
Nonparametric Methods
 1 Excel Manual Nonparametric Methods Chapter 15 In this chapter, Excel is used more as an organizer; the actual statistics will performed by hand. Excel is used to do the simple task of ranking data, determining
Flow Control and Functions
 Flow Control and Functions Script files If's and For's Basics of writing functions Checking input arguments Variable input arguments Output arguments Documenting functions Profiling and Debugging Introduction
IBM SPSS Statistics Traditional License packages and features
 IBM SPSS Statistics Traditional License packages and features 1 2 3 The includes the following features: Data access and management Compare two data files for compatibility Data prep features: Define Variable
Table of Contents. Help/Information Help System System Information About MegaStat... 11
 MegaStat User s Guide Windows version Copyright 2017 by J. B. Orris Table of Contents 1. Basic Procedures... 2 Buttons... 4 Data Selection... 5 Entering values... 6 Data Labels... 6 Output... 7 Repeat
Learn What s New. Statistical Software
 Statistical Software Learn What s New Upgrade now to access new and improved statistical features and other enhancements that make it even easier to analyze your data. The Assistant Data Customization
STATA 13 INTRODUCTION
 STATA 13 INTRODUCTION Catherine McGowan & Elaine Williamson LONDON SCHOOL OF HYGIENE & TROPICAL MEDICINE DECEMBER 2013 0 CONTENTS INTRODUCTION... 1 Versions of STATA... 1 OPENING STATA... 1 THE STATA
CDA6530: Performance Models of Computers and Networks. Chapter 4: Using Matlab for Performance Analysis and Simulation
 CDA6530: Performance Models of Computers and Networks Chapter 4: Using Matlab for Performance Analysis and Simulation Objective Learn a useful tool for mathematical analysis and simulation Interpreted
CHAPTER 8 ANFIS MODELING OF FLANK WEAR 8.1 AISI M2 HSS TOOLS
 CHAPTER 8 ANFIS MODELING OF FLANK WEAR 8.1 AISI M2 HSS TOOLS Control surface as shown in Figs. 8.1 8.3 gives the interdependency of input, and output parameters guided by the various rules in the given
Statistical Pattern Recognition
 Statistical Pattern Recognition Features and Feature Selection Hamid R. Rabiee Jafar Muhammadi Spring 2012 http://ce.sharif.edu/courses/90-91/2/ce725-1/ Agenda Features and Patterns The Curse of Size and
Correlation. January 12, 2019
 Correlation January 12, 2019 Contents Correlations The Scattterplot The Pearson correlation The computational raw-score formula Survey data Fun facts about r Sensitivity to outliers Spearman rank-order
Data needs to be prepped for loading into matlab.
 Outline Preparing data sets CTD Data from Tomales Bay Clean up Binning Combined Temperature Depth plots T S scatter plots Multiple plots on a single figure What haven't you learned in this class? Preparing
Technical Support Minitab Version Student Free technical support for eligible products
 Technical Support Free technical support for eligible products All registered users (including students) All registered users (including students) Registered instructors Not eligible Worksheet Size Number
Ivy s Business Analytics Foundation Certification Details (Module I + II+ III + IV + V)
") Ivy s Business Analytics Foundation Certification Details (Module I + II+ III + IV + V) Based on Industry Cases, Live Exercises, & Industry Executed Projects Module (I) Analytics Essentials 81 hrs 1. Statistics
Ivy s Business Analytics Foundation Certification Details (Module I + II+ III + IV + V) Based on Industry Cases, Live Exercises, & Industry Executed Projects Module (I) Analytics Essentials 81 hrs 1. Statistics
Written by Donna Hiestand-Tupper CCBC - Essex TI 83 TUTORIAL. Version 3.0 to accompany Elementary Statistics by Mario Triola, 9 th edition
 TI 83 TUTORIAL Version 3.0 to accompany Elementary Statistics by Mario Triola, 9 th edition Written by Donna Hiestand-Tupper CCBC - Essex 1 2 Math 153 - Introduction to Statistical Methods TI 83 (PLUS)
Excel Primer CH141 Fall, 2017
 Excel Primer CH141 Fall, 2017 To Start Excel : Click on the Excel icon found in the lower menu dock. Once Excel Workbook Gallery opens double click on Excel Workbook. A blank workbook page should appear
SAS/STAT 13.1 User s Guide. The Power and Sample Size Application
 SAS/STAT 13.1 User s Guide The Power and Sample Size Application This document is an individual chapter from SAS/STAT 13.1 User s Guide. The correct bibliographic citation for the complete manual is as
Choosing the Right Procedure
 3 CHAPTER 1 Choosing the Right Procedure Functional Categories of Base SAS Procedures 3 Report Writing 3 Statistics 3 Utilities 4 Report-Writing Procedures 4 Statistical Procedures 6 Available Statistical
Lab of COMP 406 Introduction of Matlab (III) Programming and Scripts
 Programming and Scripts") Lab of COMP 406 Introduction of Matlab (III) Programming and Scripts Teaching Assistant: Pei-Yuan Zhou Contact: cspyzhou@comp.polyu.edu.hk Lab 3: 26 Sep., 2014 1 Open Matlab 2012a Find the Matlab under
Lab of COMP 406 Introduction of Matlab (III) Programming and Scripts Teaching Assistant: Pei-Yuan Zhou Contact: cspyzhou@comp.polyu.edu.hk Lab 3: 26 Sep., 2014 1 Open Matlab 2012a Find the Matlab under
Choosing the Right Procedure
 3 CHAPTER 1 Choosing the Right Procedure Functional Categories of Base SAS Procedures 3 Report Writing 3 Statistics 3 Utilities 4 Report-Writing Procedures 4 Statistical Procedures 5 Efficiency Issues
Introduction to Matlab
 Introduction to Matlab By:Mohammad Sadeghi *Dr. Sajid Gul Khawaja Slides has been used partially to prepare this presentation Outline: What is Matlab? Matlab Screen Basic functions Variables, matrix, indexing
Nonparametric Testing
 Nonparametric Testing in Excel By Mark Harmon Copyright 2011 Mark Harmon No part of this publication may be reproduced or distributed without the express permission of the author. mark@excelmasterseries.com
Statistical Package for the Social Sciences INTRODUCTION TO SPSS SPSS for Windows Version 16.0: Its first version in 1968 In 1975.
 Statistical Package for the Social Sciences INTRODUCTION TO SPSS SPSS for Windows Version 16.0: Its first version in 1968 In 1975. SPSS Statistics were designed INTRODUCTION TO SPSS Objective About the
Computational Finance
 Computational Finance Introduction to Matlab Marek Kolman Matlab program/programming language for technical computing particularly for numerical issues works on matrix/vector basis usually used for functional
Chemical Engineering 541
 Chemical Engineering 541 Computer Aided Design Methods Matlab Tutorial 1 Overview 2 Matlab is a programming language suited to numerical analysis and problems involving vectors and matricies. Matlab =
Department of Chemical Engineering ChE-101: Approaches to Chemical Engineering Problem Solving MATLAB Tutorial Vb
 Department of Chemical Engineering ChE-101: Approaches to Chemical Engineering Problem Solving MATLAB Tutorial Vb Making Plots with Matlab (last updated 5/29/05 by GGB) Objectives: These tutorials are
10 M-File Programming
 MATLAB Programming: A Quick Start Files that contain MATLAB language code are called M-files. M-files can be functions that accept arguments and produce output, or they can be scripts that execute a series
Chapter 1 Getting Started
 Chapter 1 Getting Started The C# class Just like all object oriented programming languages, C# supports the concept of a class. A class is a little like a data structure in that it aggregates different
Getting Started with MegaStat
 Getting Started with MegaStat J. B. Orris Butler University Copyright 2005 by J. B. Orris Table of Contents 1. Basic Procedures... 2 Buttons... 3 Data Selection... 3 Data Labels... 5 Output... 5 Repeat
An introduction to plotting data
 An introduction to plotting data Eric D. Black California Institute of Technology February 25, 2014 1 Introduction Plotting data is one of the essential skills every scientist must have. We use it on a
EOSC 473/573 Matlab Tutorial R. Pawlowicz with changes by M. Halverson
 EOSC 473/573 Matlab Tutorial R. Pawlowicz with changes by M. Halverson February 12, 2008 Getting help 1. Local On-line help (a) text-based help: >> help (b) GUI-help >> helpwin (c) Browser-based
1. Basic Steps for Data Analysis Data Editor. 2.4.To create a new SPSS file
 1 SPSS Guide 2009 Content 1. Basic Steps for Data Analysis. 3 2. Data Editor. 2.4.To create a new SPSS file 3 4 3. Data Analysis/ Frequencies. 5 4. Recoding the variable into classes.. 5 5. Data Analysis/
INTRODUCTION TO MATLAB Part2 - Programming UNIVERSITY OF SHEFFIELD. July 2018
 INTRODUCTION TO MATLAB Part2 - Programming UNIVERSITY OF SHEFFIELD CiCS DEPARTMENT Deniz Savas & Mike Griffiths July 2018 Outline MATLAB Scripts Relational Operations Program Control Statements Writing
Advanced Programming Techniques in MATLAB
 Advanced Programming Techniques in MATLAB 1 Agenda MATLAB and memory What you as a programmer should know Passing arrays How structures use memory Functions of all types Introduction/Review of MATLAB function
MegaStat User s Guide
 MegaStat User s Guide J. B. Orris Butler University Copyright 2015 by J. B. Orris Table of Contents 1. Basic Procedures... 2 Buttons... 4 Data Selection... 5 Entering values... 6 Data Labels... 6 Output...
static CS106L Spring 2009 Handout #21 May 12, 2009 Introduction
 CS106L Spring 2009 Handout #21 May 12, 2009 static Introduction Most of the time, you'll design classes so that any two instances of that class are independent. That is, if you have two objects one and
Name: Username: I. 20. Section: II. p p p III. p p p p Total 100. CMSC 202 Section 06 Fall 2015
 CMSC 202 Section 06 Fall 2015 Computer Science II Midterm Exam I Name: Username: Score Max Section: (check one) 07 - Sushant Athley, Tuesday 11:30am 08 - Aishwarya Bhide, Thursday 11:30am 09 - Phanindra
A Web Application to Visualize Trends in Diabetes across the United States
 A Web Application to Visualize Trends in Diabetes across the United States Final Project Report Team: New Bee Team Members: Samyuktha Sridharan, Xuanyi Qi, Hanshu Lin Introduction This project develops
a. divided by the. 1) Always round!! a) Even if class width comes out to a, go up one.
 Always round!! a) Even if class width comes out to a, go up one.") Probability and Statistics Chapter 2 Notes I Section 2-1 A Steps to Constructing Frequency Distributions 1 Determine number of (may be given to you) a Should be between and classes 2 Find the Range a The
Probability and Statistics Chapter 2 Notes I Section 2-1 A Steps to Constructing Frequency Distributions 1 Determine number of (may be given to you) a Should be between and classes 2 Find the Range a The
SLStats.notebook. January 12, Statistics:
 Statistics: 1 2 3 Ways to display data: 4 generic arithmetic mean sample 14A: Opener, #3,4 (Vocabulary, histograms, frequency tables, stem and leaf) 14B.1: #3,5,8,9,11,12,14,15,16 (Mean, median, mode,
GRADE CENTRE BEST PRACTICE FOR A4L
 GRADE CENTRE BEST PRACTICE FOR A4L Overview A large number of reports use information from the Grade Centre to draw correlations between activity and student success (see appendix). This document serves
NAME: BEST FIT LINES USING THE NSPIRE
 NAME: BEST FIT LINES USING THE NSPIRE For this portion of the activity, you will be using the same data sets you just completed where you visually estimated the line of best fit..) Load the data sets into
2) familiarize you with a variety of comparative statistics biologists use to evaluate results of experiments;
 familiarize you with a variety of comparative statistics biologists use to evaluate results of experiments;") A. Goals of Exercise Biology 164 Laboratory Using Comparative Statistics in Biology "Statistics" is a mathematical tool for analyzing and making generalizations about a population from a number of individual
A. Goals of Exercise Biology 164 Laboratory Using Comparative Statistics in Biology "Statistics" is a mathematical tool for analyzing and making generalizations about a population from a number of individual
INSTRUCTIONS FOR USING MICROSOFT EXCEL PERFORMING DESCRIPTIVE AND INFERENTIAL STATISTICS AND GRAPHING
 APPENDIX INSTRUCTIONS FOR USING MICROSOFT EXCEL PERFORMING DESCRIPTIVE AND INFERENTIAL STATISTICS AND GRAPHING (Developed by Dr. Dale Vogelien, Kennesaw State University) ** For a good review of basic
Data Handling. Moving from A to A* Calculate the numbers to be surveyed for a stratified sample (A)
") Moving from A to A* A* median, quartiles and interquartile range from a histogram (A*) Draw histograms from frequency tables with unequal class intervals (A) Calculate the numbers to be surveyed for a
Moving from A to A* A* median, quartiles and interquartile range from a histogram (A*) Draw histograms from frequency tables with unequal class intervals (A) Calculate the numbers to be surveyed for a
Unit 7 Statistics. AFM Mrs. Valentine. 7.1 Samples and Surveys
 Unit 7 Statistics AFM Mrs. Valentine 7.1 Samples and Surveys v Obj.: I will understand the different methods of sampling and studying data. I will be able to determine the type used in an example, and
MATLAB Introduction. Contents. Introduction to Matlab. Published on Advanced Lab (
 Published on Advanced Lab (http://experimentationlab.berkeley.edu) Home > References > MATLAB Introduction MATLAB Introduction Contents 1 Introduction to Matlab 1.1 About Matlab 1.2 Prepare Your Environment
PROGRAMMING AND ENGINEERING COMPUTING WITH MATLAB Huei-Huang Lee SDC. Better Textbooks. Lower Prices.
 PROGRAMMING AND ENGINEERING COMPUTING WITH MATLAB 2018 Huei-Huang Lee SDC P U B L I C AT I O N S Better Textbooks. Lower Prices. www.sdcpublications.com Powered by TCPDF (www.tcpdf.org) Visit the following
Overview. Lecture 13: Graphics and Visualisation. Graphics & Visualisation 2D plotting. Graphics and visualisation of data in Matlab
 Overview Lecture 13: Graphics and Visualisation Graphics & Visualisation 2D plotting 1. Plots for one or multiple sets of data, logarithmic scale plots 2. Axis control & Annotation 3. Other forms of 2D
Exploring Data. This guide describes the facilities in SPM to gain initial insights about a dataset by viewing and generating descriptive statistics.
 This guide describes the facilities in SPM to gain initial insights about a dataset by viewing and generating descriptive statistics. 2018 by Minitab Inc. All rights reserved. Minitab, SPM, SPM Salford