How does Map Algebra work?
|
|
|
- Wesley Harper
- 6 years ago
- Views:
Transcription
1 Map Algebra
2 How does Map Algebra work? Map Algebra uses math-like expressions containing operators and functions with raster data. Map Algebra operators, which are relational, Boolean, logical, combinatorial, and bitwise, work with one or more inputs to develop new values. Functions perform specialized tasks, such as computing slope from elevation, and they usually return numeric values. You don't have to be a programmer to know how to use operators and functions effectively, you just have to be taught how to use them.
.")
3 Map Algebra Map Algebra is an analysis language based loosely on the map algebra concepts presented by Dr. Dana Tomlin in his book entitled Geographic Information Systems and Cartographic Modeling (Tomlin, 1990). Map Algebra is a high-level computational language used for performing cartographic spatial analysis using raster data. Simply put, Map Algebra is math applied to rasters, a practice that's possible because rasters are geographically referenced arrays of numbers. If you stack rasters on top of each other as if they were a mathematical sandwich, you can perform simple arithmetic to the most sophisticated algorithms with them. You probably know more about Map Algebra operators than you think. Map Algebra operators are generally the same operators found on scientific calculators. The operators used most often (arithmetic, relational, Boolean, and logical) are also the simplest. Two less commonly used operators are combinatorial and bitwise.

4 Map Algebra Arithmetic operators Arithmetic operators allow addition, subtraction, multiplication, and division. For example, three rasters measuring three different types of fire risk could be added to create an overall risk analysis raster. Arithmetic operators can also be used to convert values from one measurement to another (e.g., feet x = meters). 1 3 = 2 4 x

5 Map Algebra Relational operators Relational operators allow you to build logical tests, returning values of true (1) and false (0). For example, this type of operator can be used to find vegetation "equal to" Sierra-type mixed coniferous forest. You can ether use the Relational Operator (=,<,>) of the Abbreviation (EQ,LT, GT) 1 3 = 2 4 EQ
6 Map Algebra Boolean operators Boolean operators such as "and", "or", and "not" allow you to chain logical tests. Like relational operators, Boolean operators return values of true and false. For example, you could find all slopes that are "greater-than" 45 degrees "and" that have an elevation that is "greaterthan" 5000 meters. Slope = AND Elevation

7 Map Algebra Logical operators The logical operators DIFF, IN, and OVER, also allow you to build logical tests on a cell-by-cell basis, but are implemented with specific rules. A DIFF B: If a cell value in raster A and raster B are different, the cell value in raster A is returned. If the cell values are the same, the value zero is returned. A IN {value list): If a cell value in raster A is in the value list, the cell value in raster A is returned. Otherwise, NoData is returned. A OVER B: If a cell value in raster A is not equal to zero, the cell value is raster A is returned. Otherwise, the cell value in raster B is returned. 1 3 A = 2 4 DIFF B 2 5

8 Understanding logical values Logical values simply keep track of the values, true and false. In Map Algebra, any non-zero input value is considered to be a logical true, and zero is considered a logical false. Some Map Algebra operators and functions evaluate input cell values and return logical 1 values (true) and logical 0 values (false). The relational and Boolean operators all return logical values. In this example, cells are evaluated as to whether their value is greater than 15. The value 1, or logical true, is assigned to those cells that are greater than 15. The value 0, or logical false, is assigned to all other cells.
9 Map Algebra Combinatorial Combinatorial operators combine the attributes of multiple input rasters. These operators find all unique combinations of values and assign a unique ID to each, which is then returned to the output grid. The output VAT will have the Value fields from all the input grids. operators

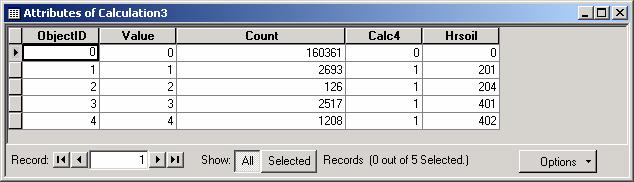
10 CAND Operator
11 Map Algebra Functions The term "functions" might sound like programmers' speak, but whether you realize it or not, you've probably already used them. In the previous module, you derived hillshade, slope, and aspect rasters using choices on the Surface Analysis menu. These choices are simply dialogs that implement Map Algebra functions programs that perform specific tasks, such as calculating slope. While you can do a lot through the Spatial Analyst user interface, many more functions are available through Map Algebra. Functions are the major element of the Map Algebra language, and there are over a hundred of them. The ArcGIS online help system provides a listing of all of the functions and a help topic for each. Here is where you can find a description of what the function does, as well as its syntax. Most of the functionality available from the Spatial Analyst toolbar are also available as Map Algebra functions.
12 Map Algebra Functions Examples ASPECT: identifies the direction of maximum rate of change in z value from each cell. BOUNDARYCLEAN: smoothes the boundary between zones by expanding and shrinking the boundary. CON: performs one or more conditional if/else evaluations. EQUALTO: evaluates, on a cell-by-cell basis, the number of times in an argument list that the input grid values are equal to the value specified by the first argument. GREATERTHAN: evaluates, on a cell-by-cell basis, the number of times in an argument list that the input grid values are greater than the value specified by the first argument. HILLSHADE: creates a shaded relief grid from a grid by considering the sun illumination angle and shadows. INT: converts input floating-point values to integer values through truncation. ISNULL: returns 1 if the input value is NODATA, and 0 if it is not. LESSTHAN: evaluates, on a cell-by-cell basis, the number of times in an argument list that the input grid values are less than the value specified by the first argument. MEAN: uses multiple input grids to determine the mean value on a cell-by-cell basis. MERGE: merges multiple, possibly non-adjacent input grids into a single grid based upon order of input. MOSAIC: merges multiple adjacent continuous grids and performs interpolation in the overlapping areas. NIBBLE: replaces areas in a grid corresponding to a mask, with the values of the nearest neighbors. REGIONGROUP: records for each cell in the output the identity of the connected region to which it belongs. A unique number is assigned to each region. SETNULL: returns NODATA if the evaluation of the input condition is TRUE ; if it FALSE, returns the value specified by the second input argument. SLICE: slices (or changes) a range of values of the input cells by specified ranges, zones of equal area, or zones with equal intervals. SLOPE: identifies the rate of maximum change in z value from each cell. ZONALAREA: calculates the area of each zone in the input grid.
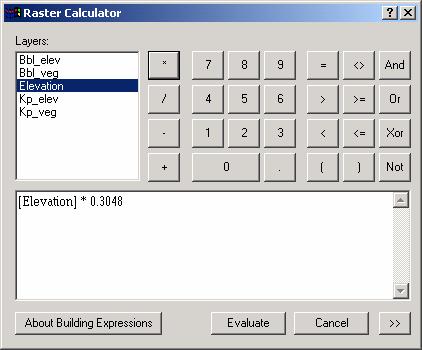
13 Building Map Algebra Expressions You build expressions in the Raster Calculator by typing directly into the expression box, clicking layers in the Layers list, and clicking buttons on the keypad. When you click an element it is added to the expression in the expression box. If you specify an output grid name in your expression (e.g., NewElev = ), a permanent grid will be created in your working directory. If you do not specify an output name, a grid will be written to your working directory, but the grid will be temporary. Output grids are either integer or floating point, depending on the expression
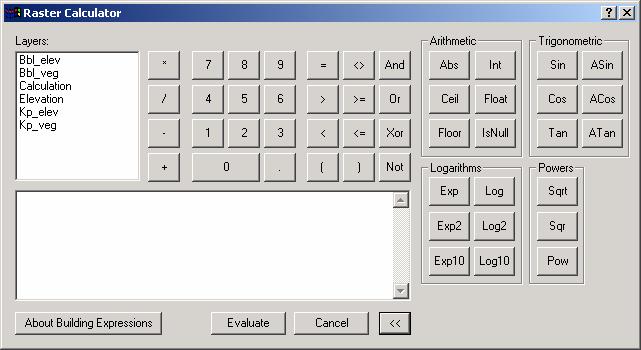
14 Raster Calculator

15 Building Expressions Help

16 Building Map Algebra Expressions

17 Building Map Algebra Expressions

18 Building Map Algebra Functions


19 Building Map Algebra Functions

20 Working with NoData Similar to logical values, NoData values also influence the evaluation of expressions. The NoData value is the only non-zero value that is not interpreted as a true condition. This special value indicates that there is no information associated with the cell. In general, a Map Algebra expression will return NoData for a cell if any of the corresponding input cells have NoData. In general, Map Algebra expressions assign the value NoData to the output cell if any corresponding input cell is NoData.
21 Summary While you can do a lot from the Spatial Analyst user interface, most of the power of the Spatial Analyst is found within Map Algebra, which you can access through the Raster Calculator dialog. You can construct a Map Algebra expression using the dialog buttons and controls, or by typing directly into the expression box. The expression processes when you click Evaluate. Map Algebra is the analysis language for Spatial Analyst. It has a simple syntax similar to any algebra. The inputs to an expression may be as simple as a single raster layer or shapefile, or as complex as a compound expression using many operators, functions, and input data. With Map Algebra, not only can you access functions not available in the user interface, you can also build complex expressions and process them as a single command. For instance, you can calculate the sine of an input raster dataset or raster layer and add that to two other input raster datasets or raster layers. Like all languages, Map Algebra is defined by rules. By understanding the basic rules, you will be able to use Spatial Analyst in new ways.
Working with Map Algebra
 Working with Map Algebra While you can accomplish much with the Spatial Analyst user interface, you can do even more with Map Algebra, the analysis language of Spatial Analyst. Map Algebra expressions
Lesson 4A overview. Introduction to Map Algebra (4A) Map Algebra functions (4B)
 Map Algebra functions (4B)") Map Algebra Lesson 4A overview Introduction to Map Algebra (4A) Language components Syntax and rules Objects Operators Commands Exercise 5A Map Algebra functions (4B) Function syntax Local functions Focal
Map Algebra Lesson 4A overview Introduction to Map Algebra (4A) Language components Syntax and rules Objects Operators Commands Exercise 5A Map Algebra functions (4B) Function syntax Local functions Focal
Map Math and StaMsMcs
 Map Math and StaMsMcs A. Michelle Lawing Ecosystem Science and Management Texas A&M University College StaMon, TX 77843 alawing@tamu.edu ObjecMves What is "Map Algebra or Map Math Images are data DescripMve
RASTER ANALYSIS GIS Analysis Winter 2016
 RASTER ANALYSIS GIS Analysis Winter 2016 Raster Data The Basics Raster Data Format Matrix of cells (pixels) organized into rows and columns (grid); each cell contains a value representing information.
Module 7 Raster operations
 Introduction Geo-Information Science Practical Manual Module 7 Raster operations 7. INTRODUCTION 7-1 LOCAL OPERATIONS 7-2 Mathematical functions and operators 7-5 Raster overlay 7-7 FOCAL OPERATIONS 7-8
ENGRG Introduction to GIS
 ENGRG 59910 Introduction to GIS Michael Piasecki April 3, 2014 Lecture 11: Raster Analysis GIS Related? 4/3/2014 ENGRG 59910 Intro to GIS 2 1 Why we use Raster GIS In our previous discussion of data models,
RASTER ANALYSIS GIS Analysis Fall 2013
 RASTER ANALYSIS GIS Analysis Fall 2013 Raster Data The Basics Raster Data Format Matrix of cells (pixels) organized into rows and columns (grid); each cell contains a value representing information. What
Cell based GIS. Introduction to rasters
 Week 9 Cell based GIS Introduction to rasters topics of the week Spatial Problems Modeling Raster basics Application functions Analysis environment, the mask Application functions Spatial Analyst in ArcGIS
GEOGRAPHIC INFORMATION SYSTEMS Lecture 24: Spatial Analyst Continued
 GEOGRAPHIC INFORMATION SYSTEMS Lecture 24: Spatial Analyst Continued Spatial Analyst - Spatial Analyst is an ArcGIS extension designed to work with raster data - in lecture I went through a series of demonstrations
Watershed Sciences 4930 & 6920 GEOGRAPHIC INFORMATION SYSTEMS
 HOUSEKEEPING Watershed Sciences 4930 & 6920 GEOGRAPHIC INFORMATION SYSTEMS CONTOURS! Self-Paced Lab Due Friday! WEEK SIX Lecture RASTER ANALYSES Joe Wheaton YOUR EXCERCISE Integer Elevations Rounded up
RASTER ANALYSIS S H A W N L. P E N M A N E A R T H D A T A A N A LY S I S C E N T E R U N I V E R S I T Y O F N E W M E X I C O
 RASTER ANALYSIS S H A W N L. P E N M A N E A R T H D A T A A N A LY S I S C E N T E R U N I V E R S I T Y O F N E W M E X I C O TOPICS COVERED Spatial Analyst basics Raster / Vector conversion Raster data
Getting Started with Spatial Analyst. Steve Kopp Elizabeth Graham
 Getting Started with Spatial Analyst Steve Kopp Elizabeth Graham Workshop Overview Fundamentals of using Spatial Analyst What analysis capabilities exist and where to find them How to build a simple site
Getting Started with Spatial Analyst. Steve Kopp Elizabeth Graham
 Getting Started with Spatial Analyst Steve Kopp Elizabeth Graham Spatial Analyst Overview Over 100 geoprocessing tools plus raster functions Raster and vector analysis Construct workflows with ModelBuilder,
Using GIS to Site Minimal Excavation Helicopter Landings
 Using GIS to Site Minimal Excavation Helicopter Landings The objective of this analysis is to develop a suitability map for aid in locating helicopter landings in mountainous terrain. The tutorial uses
Geographic Information Systems (GIS) Spatial Analyst [10] Dr. Mohammad N. Almasri. [10] Spring 2018 GIS Dr. Mohammad N. Almasri Spatial Analyst
![Geographic Information Systems (GIS) Spatial Analyst [10] Dr. Mohammad N. Almasri. [10] Spring 2018 GIS Dr. Mohammad N. Almasri Spatial Analyst](/thumbs/80/81171101.jpg "Geographic Information Systems (GIS) Spatial Analyst [10] Dr. Mohammad N. Almasri. [10] Spring 2018 GIS Dr. Mohammad N. Almasri Spatial Analyst") Geographic Information Systems (GIS) Spatial Analyst [10] Dr. Mohammad N. Almasri 1 Preface POINTS, LINES, and POLYGONS are good at representing geographic objects with distinct shapes They are less good
Geographic Information Systems (GIS) Spatial Analyst [10] Dr. Mohammad N. Almasri 1 Preface POINTS, LINES, and POLYGONS are good at representing geographic objects with distinct shapes They are less good
Raster Data. James Frew ESM 263 Winter
 Raster Data 1 Vector Data Review discrete objects geometry = points by themselves connected lines closed polygons attributes linked to feature ID explicit location every point has coordinates 2 Fields
Field-Scale Watershed Analysis
 Conservation Applications of LiDAR Field-Scale Watershed Analysis A Supplemental Exercise for the Hydrologic Applications Module Andy Jenks, University of Minnesota Department of Forest Resources 2013
Raster Data Model & Analysis
 Topics: 1. Understanding Raster Data 2. Adding and displaying raster data in ArcMap 3. Converting between floating-point raster and integer raster 4. Converting Vector data to Raster 5. Querying Raster
Suitability Modeling with GIS
 Developed and Presented by Juniper GIS 1/33 Course Objectives What is Suitability Modeling? The Suitability Modeling Process Cartographic Modeling GIS Tools for Suitability Modeling Demonstrations of Models
Combine Yield Data From Combine to Contour Map Ag Leader
 Combine Yield Data From Combine to Contour Map Ag Leader Exporting the Yield Data Using SMS Program 1. Data format On Hard Drive. 2. Start program SMS Basic. a. In the File menu choose Open. b. Click on
Lab 10: Raster Analyses
 Lab 10: Raster Analyses What You ll Learn: Spatial analysis and modeling with raster data. You will estimate the access costs for all points on a landscape, based on slope and distance to roads. You ll
By Colin Childs, ESRI Education Services. Catalog
 s resolve many traditional raster management issues By Colin Childs, ESRI Education Services Source images ArcGIS 10 introduces Catalog Mosaicked images Sources, mosaic methods, and functions are used
Lecture 20 - Chapter 8 (Raster Analysis, part1)
") GEOL 452/552 - GIS for Geoscientists I Lecture 20 - Chapter 8 (Raster Analysis, part) 4 lectures on rasters - but won t cover everything (Raster GIS course: Geol 588: GIS II (Spring 20) Today: Raster data,
GEOL 452/552 - GIS for Geoscientists I Lecture 20 - Chapter 8 (Raster Analysis, part) 4 lectures on rasters - but won t cover everything (Raster GIS course: Geol 588: GIS II (Spring 20) Today: Raster data,
Lab 12: Sampling and Interpolation
 Lab 12: Sampling and Interpolation What You ll Learn: -Systematic and random sampling -Majority filtering -Stratified sampling -A few basic interpolation methods Data for the exercise are in the L12 subdirectory.
ArcGIS Enterprise Building Raster Analytics Workflows. Mike Muller, Jie Zhang
 ArcGIS Enterprise Building Raster Analytics Workflows Mike Muller, Jie Zhang Introduction and Context Raster Analytics What is Raster Analytics? The ArcGIS way to create and execute spatial analysis models
Delineating Watersheds from a Digital Elevation Model (DEM)
") Delineating Watersheds from a Digital Elevation Model (DEM) (Using example from the ESRI virtual campus found at http://training.esri.com/courses/natres/index.cfm?c=153) Download locations for additional
Delineating Watersheds from a Digital Elevation Model (DEM) (Using example from the ESRI virtual campus found at http://training.esri.com/courses/natres/index.cfm?c=153) Download locations for additional
Making Yield Contour Maps Using John Deere Data
 Making Yield Contour Maps Using John Deere Data Exporting the Yield Data Using JDOffice 1. Data Format On Hard Drive 2. Start program JD Office. a. From the PC Card menu on the left of the screen choose
+ = Spatial Analysis of Raster Data. 2 =Fault in shale 3 = Fault in limestone 4 = no Fault, shale 5 = no Fault, limestone. 2 = fault 4 = no fault
 Spatial Analysis of Raster Data 0 0 1 1 0 0 1 1 1 0 1 1 1 1 1 1 2 4 4 4 2 4 5 5 4 2 4 4 4 2 5 5 4 4 2 4 5 4 3 5 4 4 4 2 5 5 5 3 + = 0 = shale 1 = limestone 2 = fault 4 = no fault 2 =Fault in shale 3 =
Masking Lidar Cliff-Edge Artifacts
 Masking Lidar Cliff-Edge Artifacts Methods 6/12/2014 Authors: Abigail Schaaf is a Remote Sensing Specialist at RedCastle Resources, Inc., working on site at the Remote Sensing Applications Center in Salt
Map Analysis of Raster Data I 3/8/2018
 Map Analysis of Raster Data I /8/8 Spatial Analysis of Raster Data What is Spatial Analysis? = shale = limestone 4 4 4 4 5 5 4 4 4 4 5 5 4 4 4 5 4 5 4 4 4 5 5 5 + = = fault =Fault in shale 4 = no fault
Lab 11: Terrain Analyses
 Lab 11: Terrain Analyses What You ll Learn: Basic terrain analysis functions, including watershed, viewshed, and profile processing. There is a mix of old and new functions used in this lab. We ll explain
Raster GIS applications Columns
 Raster GIS applications Columns Rows Image: cell value = amount of reflection from surface Thematic layer: cell value = category or measured value - In both cases, there is only one value per cell (in
Lab 12: Sampling and Interpolation
 Lab 12: Sampling and Interpolation What You ll Learn: -Systematic and random sampling -Majority filtering -Stratified sampling -A few basic interpolation methods Videos that show how to copy/paste data
GEOG 487 Lesson 8: Step-by-Step Activity
 GEOG 487 Lesson 8: Step-by-Step Activity Part I: Review the Relevant Data Layers and Organize the Map Document In Part I, we will review the starting datasets and organize the map document for analysis.
GeoEarthScope NoCAL San Andreas System LiDAR pre computed DEM tutorial
 GeoEarthScope NoCAL San Andreas System LiDAR pre computed DEM tutorial J Ramón Arrowsmith Chris Crosby School of Earth and Space Exploration Arizona State University ramon.arrowsmith@asu.edu http://lidar.asu.edu
Pond Distance and Habitat for use in Wildlife Modeling
 Pond Distance and Habitat for use in Wildlife Modeling These instructions enable you to aggregate layers within a study area, calculate new fields, and create new data out of existing data, for use in
What s New in Imagery in ArcGIS. Presented by: Christopher Patterson Date: September 12, 2017
 What s New in Imagery in ArcGIS Presented by: Christopher Patterson Date: September 12, 2017 Agenda Ortho Mapping Elevation extraction Drone2Map Raster Analytics ArcGIS is a Comprehensive Imagery System
Lab 10: Raster Analyses
 Lab 10: Raster Analyses What You ll Learn: Spatial analysis and modeling with raster data. You will estimate the access costs for all points on a landscape, based on slope and distance to roads. You ll
Beyond The Vector Data Model - Part Two
 Beyond The Vector Data Model - Part Two Introduction Spatial Analyst Extension (Spatial Analysis) What is your question? Selecting a method of analysis Map Algebra Who is the audience? What is Spatial
Raster GIS applications
 Raster GIS applications Columns Rows Image: cell value = amount of reflection from surface DEM: cell value = elevation (also slope/aspect/hillshade/curvature) Thematic layer: cell value = category or measured
Spatial Analysis with Raster Datasets
 Spatial Analysis with Raster Datasets Francisco Olivera, Ph.D., P.E. Srikanth Koka Lauren Walker Aishwarya Vijaykumar Keri Clary Department of Civil Engineering April 21, 2014 Contents Brief Overview of
Basics of Using LiDAR Data
 Conservation Applications of LiDAR Basics of Using LiDAR Data Exercise #2: Raster Processing 2013 Joel Nelson, University of Minnesota Department of Soil, Water, and Climate This exercise was developed
Mapping Distance and Density
 Mapping Distance and Density Distance functions allow you to determine the nearest location of something or the least-cost path to a particular destination. Density functions, on the other hand, allow
Lab 10: Raster Analyses
 Lab 10: Raster Analyses What You ll Learn: Spatial analysis and modeling with raster data. You will estimate the access costs for all points on a landscape, based on slope and distance to roads. You ll
Introduction to the Image Analyst Extension. Mike Muller, Vinay Viswambharan
 Introduction to the Image Analyst Extension Mike Muller, Vinay Viswambharan What is the Image Analyst Extension? The Image Analyst Extension (IA) is an application extension which extends ArcGIS Pro with
GEOG 487 Lesson 7: Step- by- Step Activity
 GEOG 487 Lesson 7: Step- by- Step Activity Part I: Review the Relevant Data Layers and Organize the Map Document In Part I, we will review the data and organize the map document for analysis. 1. Unzip
Data Assembly, Part II. GIS Cyberinfrastructure Module Day 4
 Data Assembly, Part II GIS Cyberinfrastructure Module Day 4 Objectives Continuation of effective troubleshooting Create shapefiles for analysis with buffers, union, and dissolve functions Calculate polygon
17/07/2013 RASTER DATA STRUCTURE GIS LECTURE 4 GIS DATA MODELS AND STRUCTURES RASTER DATA MODEL& STRUCTURE TIN- TRIANGULAR IRREGULAR NETWORK
 RASTER DATA STRUCTURE GIS LECTURE 4 GIS DATA MODELS AND STRUCTURES Space is subdivided into regular grids of square grid cells or other forms of polygonal meshes known as picture elements (pixels) the
Raster Analysis and Functions. David Tenenbaum EEOS 465 / 627 UMass Boston
 Raster Analysis and Functions Local Functions By-cell operations Operated on by individual operators or by coregistered grid cells from other themes Begin with each target cell, manipulate through available
Distributed Image Analysis Using the ArcGIS API for Python
 Distributed Image Analysis Using the ArcGIS API for Python Jie Zhang, Elizabeth Graham The ArcGIS Platform Is a Comprehensive Imagery Platform System of Engagement System of Insight Professional Imagery
Lecture 21 - Chapter 8 (Raster Analysis, part2)
") GEOL 452/552 - GIS for Geoscientists I Lecture 21 - Chapter 8 (Raster Analysis, part2) Today: Digital Elevation Models (DEMs), Topographic functions (surface analysis): slope, aspect hillshade, viewshed,
GEOL 452/552 - GIS for Geoscientists I Lecture 21 - Chapter 8 (Raster Analysis, part2) Today: Digital Elevation Models (DEMs), Topographic functions (surface analysis): slope, aspect hillshade, viewshed,
CRC Website and Online Book Materials Page 1 of 16
 Page 1 of 16 Appendix 2.3 Terrain Analysis with USGS DEMs OBJECTIVES The objectives of this exercise are to teach readers to: Calculate terrain attributes and create hillshade maps and contour maps. use,
Exercise 4: Extracting Information from DEMs in ArcMap
 Exercise 4: Extracting Information from DEMs in ArcMap Introduction This exercise covers sample activities for extracting information from DEMs in ArcMap. Topics include point and profile queries and surface
Lab 11: Terrain Analyses
 Lab 11: Terrain Analyses What You ll Learn: Basic terrain analysis functions, including watershed, viewshed, and profile processing. There is a mix of old and new functions used in this lab. We ll explain
Geoprocessing and georeferencing raster data
 Geoprocessing and georeferencing raster data Raster conversion tools Geoprocessing tools ArcCatalog tools ESRI Grid GDB Raster Raster Dataset Raster Catalog Erdas IMAGINE TIFF ArcMap - raster projection
Copyright The McGraw-Hill Companies, Inc. Permission required for reproduction or display.
 CHAPTER 12 RASTER DATA ANALYSIS 12.1 Data Analysis Environment Box 12.1 How to Make an Analysis Mask 12.2 Local Operations 12.2.1 Local Operations with a Single Raster 12.2.2 Reclassification 12.2.3 Local
Part 6b: The effect of scale on raster calculations mean local relief and slope
 Part 6b: The effect of scale on raster calculations mean local relief and slope Due: Be done with this section by class on Monday 10 Oct. Tasks: Calculate slope for three rasters and produce a decent looking
Raster Analysis and Image Processing in ArcGIS Enterprise
 Raster Analysis and Image Processing in ArcGIS Enterprise Vinay Viswambharan, Jie Zhang Overview Patterns of use - Introduction to image processing and analysis in ArcGIS - Client/Server side processing
RiparianZone = buffer( River, 100 Feet )
") GIS Analysts perform spatial analysis when they need to derive new data from existing data. In GIS I, for example, you used the vector approach to derive a riparian buffer feature (output polygon) around
GIS Analysts perform spatial analysis when they need to derive new data from existing data. In GIS I, for example, you used the vector approach to derive a riparian buffer feature (output polygon) around
Using GIS To Estimate Changes in Runoff and Urban Surface Cover In Part of the Waller Creek Watershed Austin, Texas
 Using GIS To Estimate Changes in Runoff and Urban Surface Cover In Part of the Waller Creek Watershed Austin, Texas Jordan Thomas 12-6-2009 Introduction The goal of this project is to understand runoff
GEOGRAPHIC INFORMATION SYSTEMS Lecture 25: 3D Analyst
 GEOGRAPHIC INFORMATION SYSTEMS Lecture 25: 3D Analyst 3D Analyst - 3D Analyst is an ArcGIS extension designed to work with TIN data (triangulated irregular network) - many of the tools in 3D Analyst also
THE TOOLS OF AUTOMATED GENERALIZATION AND BUILDING GENERALIZATION IN AN ArcGIS ENVIRONMENT
 Vol. XIX, 2011, No. 1, 1 7, DOI: 10.2478/v10189-011-0001-4 V. DROPPOVÁ THE TOOLS OF AUTOMATED GENERALIZATION AND BUILDING GENERALIZATION IN AN ArcGIS ENVIRONMENT Veronika Droppová email: veronika.droppova@gmail.com
Creating raster DEMs and DSMs from large lidar point collections. Summary. Coming up with a plan. Using the Point To Raster geoprocessing tool
 Page 1 of 5 Creating raster DEMs and DSMs from large lidar point collections ArcGIS 10 Summary Raster, or gridded, elevation models are one of the most common GIS data types. They can be used in many ways
GEO 465/565 - Lab 7 Working with GTOPO30 Data in ArcGIS 9
 GEO 465/565 - Lab 7 Working with GTOPO30 Data in ArcGIS 9 This lab explains how work with a Global 30-Arc-Second (GTOPO30) digital elevation model (DEM) from the U.S. Geological Survey. This dataset can
Blacksburg, VA July 24 th 30 th, 2010 Georeferencing images and scanned maps Page 1. Georeference
 George McLeod Prepared by: With support from: NSF DUE-0903270 in partnership with: Geospatial Technician Education Through Virginia s Community Colleges (GTEVCC) Georeference The process of defining how
Ex. 4: Locational Editing of The BARC
 Ex. 4: Locational Editing of The BARC Using the BARC for BAER Support Document Updated: April 2010 These exercises are written for ArcGIS 9.x. Some steps may vary slightly if you are working in ArcGIS
Tutorial 18: 3D and Spatial Analyst - Creating a TIN and Visual Analysis
 Tutorial 18: 3D and Spatial Analyst - Creating a TIN and Visual Analysis Module content 18.1. Creating a TIN 18.2. Spatial Analyst Viewsheds, Slopes, Hillshades and Density. 18.1 Creating a TIN Sometimes
v Working with Rasters SMS 12.1 Tutorial Requirements Raster Module Map Module Mesh Module Time minutes Prerequisites Overview Tutorial
 v. 12.1 SMS 12.1 Tutorial Objectives This tutorial teaches how to import a Raster, view elevations at individual points, change display options for multiple views of the data, show the 2D profile plots,
Improved Applications with SAMB Derived 3 meter DTMs
 Improved Applications with SAMB Derived 3 meter DTMs Evan J Fedorko West Virginia GIS Technical Center 20 April 2005 This report sums up the processes used to create several products from the Lorado 7
Geographic Surfaces. David Tenenbaum EEOS 383 UMass Boston
 Geographic Surfaces Up to this point, we have talked about spatial data models that operate in two dimensions How about the rd dimension? Surface the continuous variation in space of a third dimension
A Second Look at DEM s
 A Second Look at DEM s Overview Detailed topographic data is available for the U.S. from several sources and in several formats. Perhaps the most readily available and easy to use is the National Elevation
Automating Distributed Raster Analysis using the Image Server REST API. Jie Zhang Zikang Zhou Demo Theater 2 - Oasis 1
 Automating Distributed Raster Analysis using the Image Server REST API Jie Zhang Zikang Zhou Demo Theater 2 - Oasis 1 What is Distributed Raster Analysis? From 10.5, ArcGIS has a new way to create and
Lab 18c: Spatial Analysis III: Clip a raster file using a Polygon Shapefile
 Environmental GIS Prepared by Dr. Zhi Wang, CSUF EES Department Lab 18c: Spatial Analysis III: Clip a raster file using a Polygon Shapefile These instructions enable you to clip a raster layer in ArcMap
Raster Analytics in Image Server: An Introduction. Mike Muller
 Raster Analytics in Image Server: An Introduction Mike Muller Introduction and Context The ArcGIS Platform and ArcGIS Image Server enable access to imagery and analysis through a wide range of integrated
Stream network delineation and scaling issues with high resolution data
 Stream network delineation and scaling issues with high resolution data Roman DiBiase, Arizona State University, May 1, 2008 Abstract: In this tutorial, we will go through the process of extracting a stream
Spatial Calculation of Locus Allele Frequencies Using ArcView 3.2
 Spatial Calculation of Locus Allele Frequencies Using ArcView 3.2 This instruction set applies to calculating allele frequency from point data of DNA analysis results within ArcView 3.2. To calculate the
Hillshade Example. Custom product generation with elevation data
 Hillshade Example Custom product generation with elevation data Version 1.0 Mark Lucas 22 May 2005 Overview Performing Artificial Shading based on Elevation OSSIM and ImageLinker provide many capabilities
BASICS OF SPATIAL MODELER etraining
 Introduction BASICS OF SPATIAL MODELER etraining Describes the Spatial Modeler workspace and functions and shows how to run Spatial Models. Software Data Spatial Modeler N/A Transcript 0:10 Thank you for
Operators. Java operators are classified into three categories:
 Operators Operators are symbols that perform arithmetic and logical operations on operands and provide a meaningful result. Operands are data values (variables or constants) which are involved in operations.
Chapter 4. Operations on Data
 Chapter 4 Operations on Data 1 OBJECTIVES After reading this chapter, the reader should be able to: List the three categories of operations performed on data. Perform unary and binary logic operations
Terms and definitions * keep definitions of processes and terms that may be useful for tests, assignments
 Lecture 1 Core of GIS Thematic layers Terms and definitions * keep definitions of processes and terms that may be useful for tests, assignments Lecture 2 What is GIS? Info: value added data Data to solve
Unit 3. Operators. School of Science and Technology INTRODUCTION
 INTRODUCTION Operators Unit 3 In the previous units (unit 1 and 2) you have learned about the basics of computer programming, different data types, constants, keywords and basic structure of a C program.
Final project: Lecture 21 - Chapter 8 (Raster Analysis, part2) GEOL 452/552 - GIS for Geoscientists I
 GEOL 452/552 - GIS for Geoscientists I") GEOL 452/552 - GIS for Geoscientists I Lecture 21 - Chapter 8 (Raster Analysis, part2) Talk about class project (copy follow_along_data\ch8a_class_ex into U:\ArcGIS\ if needed) Catch up with lecture 20
GEOL 452/552 - GIS for Geoscientists I Lecture 21 - Chapter 8 (Raster Analysis, part2) Talk about class project (copy follow_along_data\ch8a_class_ex into U:\ArcGIS\ if needed) Catch up with lecture 20
GIS LAB 8. Raster Data Applications Watershed Delineation
 GIS LAB 8 Raster Data Applications Watershed Delineation This lab will require you to further your familiarity with raster data structures and the Spatial Analyst. The data for this lab are drawn from
Tools, Tips, and Workflows Exporting Final Product LP360
 LP360 Support Revision 1.0 l Final products can be exported from LIDAR data using either LP360 command line executables or the LP360 Export Wizard. Some export functions and resulting products include,
Reality Check: Processing LiDAR Data. A story of data, more data and some more data
 Reality Check: Processing LiDAR Data A story of data, more data and some more data Red River of the North Red River of the North Red River of the North Red River of the North Introduction and Background
Surface Analysis. Data for Surface Analysis. What are Surfaces 4/22/2010
 Surface Analysis Cornell University Data for Surface Analysis Vector Triangulated Irregular Networks (TIN) a surface layer where space is partitioned into a set of non-overlapping triangles Attribute and
LAB #7 Creating TIN and 3D scenes (ArcScene) GISC, UNIVERSITY OF CALIFORNIA BERKELEY
 GISC, UNIVERSITY OF CALIFORNIA BERKELEY") LAB #7 Creating TIN and 3D scenes (ArcScene) GISC, UNIVERSITY OF CALIFORNIA BERKELEY The purpose of this laboratory is to introduce and explore surface data analysis using a vector data model: TIN. We
LAB #7 Creating TIN and 3D scenes (ArcScene) GISC, UNIVERSITY OF CALIFORNIA BERKELEY The purpose of this laboratory is to introduce and explore surface data analysis using a vector data model: TIN. We
IF YOU SAVED THE ArcMAP PROJECT FROM LAB#2 OPEN IT!
 Lab #4 Working with Fireatlas Regions in ArcInfo and ArcGIS NR506 Advanced GIS Applications in Fire Ecology and Management Objectives Understanding the Regions concept in GIS Learn a few regions commands
Raster Analysis. Overview Neighborhood Analysis Overlay Cost Surfaces. Arthur J. Lembo, Jr. Salisbury University
 Raster Analysis Overview Neighborhood Analysis Overlay Cost Surfaces Why we use Raster GIS In our previous discussion of data models, we indicated that Raster GIS is often used because: Raster is better
Layer Variables for RSF-type Modelling Applications
 Layer Variables for RSF-type Modelling Applications These instructions for ArcGIS 9.x enable you to create expressions for use in Spatial Analyst s Raster Calculator that result in output grids of continuous
Terrain Analysis. Using QGIS and SAGA
 Terrain Analysis Using QGIS and SAGA Tutorial ID: IGET_RS_010 This tutorial has been developed by BVIEER as part of the IGET web portal intended to provide easy access to geospatial education. This tutorial
Class #2. Data Models: maps as models of reality, geographical and attribute measurement & vector and raster (and other) data structures
 data structures") Class #2 Data Models: maps as models of reality, geographical and attribute measurement & vector and raster (and other) data structures Role of a Data Model Levels of Data Model Abstraction GIS as Digital
Class #2 Data Models: maps as models of reality, geographical and attribute measurement & vector and raster (and other) data structures Role of a Data Model Levels of Data Model Abstraction GIS as Digital
Raster: The Other GIS Data
 Raster_The_Other_GIS_Data.Docx Page 1 of 11 Raster: The Other GIS Data Objectives Understand the raster format and how it is used to model continuous geographic phenomena. Understand how projections &
v SMS Tutorials Working with Rasters Prerequisites Requirements Time Objectives
 v. 12.2 SMS 12.2 Tutorial Objectives Learn how to import a Raster, view elevations at individual points, change display options for multiple views of the data, show the 2D profile plots, and interpolate
Lecture 9. Raster Data Analysis. Tomislav Sapic GIS Technologist Faculty of Natural Resources Management Lakehead University
 Lecture 9 Raster Data Analysis Tomislav Sapic GIS Technologist Faculty of Natural Resources Management Lakehead University Raster Data Model The GIS raster data model represents datasets in which square
The Reference Library Generating Low Confidence Polygons
 GeoCue Support Team In the new ASPRS Positional Accuracy Standards for Digital Geospatial Data, low confidence areas within LIDAR data are defined to be where the bare earth model might not meet the overall
Raster Data. James Frew ESM 263 Winter
 Raster Data 1 Vector Data Review discrete objects geometry = points by themselves connected lines closed polygons agributes linked to feature ID explicit localon every point has coordinates 2 Fields in
Python - Raster Analysis
 Esri International User Conference San Diego, California Technical Workshops July 2012 Python - Raster Analysis Kevin M. Johnston Ryan DeBruyn The problem that is being addressed You have a complex modeling
I CALCULATIONS WITHIN AN ATTRIBUTE TABLE
 Geology & Geophysics REU GPS/GIS 1-day workshop handout #4: Working with data in ArcGIS You will create a raster DEM by interpolating contour data, create a shaded relief image, and pull data out of the