Instruction Manual for SilvAssist for ArcGIS
|
|
|
- Evelyn McCormick
- 6 years ago
- Views:
Transcription


1 Instruction Manual for SilvAssist for ArcGIS Version 2.0
2 Table of Contents Introduction..II Preparing to use SilvAssist..1-3 Plot Allocator Menu Definitions and Use General Use and Setup Auto Grid Generation Custom Grid Generation Simple Grid Generation Random Grid Generation Azimuth Options Plot Loader Spatial Overlay Waypoint Converter Reporting and Analytics I
3 Introduction In this instruction manual, we will be working from several assumptions. Users have an understanding of ESRI GeoDatabases (GDB). The tool does not operate with shapefiles, so users should load their shapefiles into ESRI personal geodatabases. For tools to work correctly, there several items users should be aware of: 1. Polygon datasets which are involved in area calculations or grid allocations plots are projected, e.g. the have units in feet or meters not decimal degrees. 2. Inventory data is processed in TCruise and output using the LandMark Export DLL. This output format is an Access database. One can still use the allocator without having TCruise, but all reporting is dependent on data from TCruise. 3. If there are too many layers in the map, or layers with various projection systems, you may get errors. It is best to use a new map (mxd) with only the layers being used in analysis. 4. ArcMap should not be in an edit session while using tools. A demo geodatbase which can be used for training is provided with your installer. It is located here: C:\Program Files\SilvAssist\Geodatabases\Demo Additionally, this manual is for Version 2.0 as shown on the toolbar in ArcMap. If there are issues with your install, please contact your Authorized LandMark Systems Business Partner. This manual and all its contents are the property of F4 Tech. Copying and/or distribution of material contained herein without expressed written permission, is strictly prohibited. II
4 Preparing to Use SilvAssist To utilize the SilvAssist Toolbar, open ArcGIS and right click on the toolbar as shown below. Navigate to the LandMark Systems SilvAssist 2.0 menu option and left click You should now see the SilvAssist Toolbar enabled

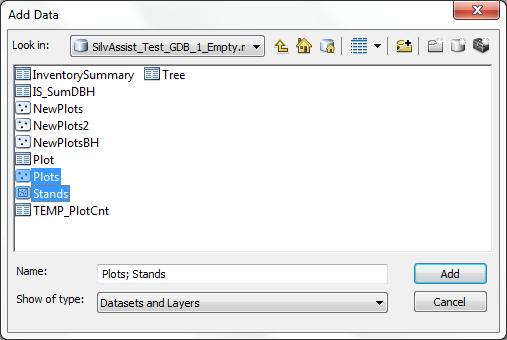
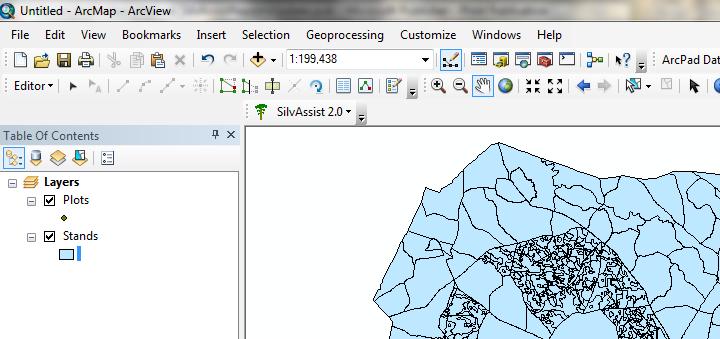
5 We will then open and existing GDB, in this example we will choose the SilvAssist_Test_GDB_1_Empty.mdb. choose the Plots and Stands layers to add to the project

6 Polygon Selection SilvAssist 2.0 Instruction Manual Preparing to Use SilvAssist Before we can generate Plots in a polygon, we must first select the polygon(s) in which we wish to generate plots. SilvAssist can generate plots across a layer, but for this instruction manual, we will use selected polygons by using the Select Tool and selecting the polygons by left clicking. To choose multiple polygons, use the select tool and hold the Ctrl and Shift keys as you left click on the polygons.
7 Menu Definitions & Use Plot Allocator: Use this tool to generate plot grids with many customizable/advanced options. Requirements- Polygon Layer, Point Layer with correct schema (can create if not present) For samples: The demo dataset contains a Plots layer with the necessary fields. There are many options for generating grids in SilvAssist. This section will go over each option. First, we will begin with the Plot Allocator.

8 Plot Allocator SilvAssist 2.0 Instruction Manual Choose the stand layer that contains the polygon you wish to use for grid generation. Since we are generating a grid for selected polygons we will choose to check the option for Use Selected Features and then select Next >>.

9 Plot Allocator SilvAssist 2.0 Instruction Manual Next, choose which point layer plots will be written to, and the starting PlotID. One can also create a plot layer here if one does not exist. The allocator will designate a starting plot ID if plot layer has existing records. Plot ID s must be unique. Please use caution specifying your own Plot ID to not create duplicates.

10 Plot Allocator Choose Grid Type SilvAssist 2.0 Instruction Manual SilvAssist offers four (4) grid generation options: Auto, Custom, Simple or Random. The descriptions for each method are described in the help box; you may see this by hitting the Show Help >> button. The first example will use the Auto Grid Type. For a description and instruction of the use of the Custom Grid Generation, please go to page 13; Simple Grid Generation, please go to page 19; Random Grid Generation, please go to page 25.
11 Plot Allocator Auto Grid Type Generation SilvAssist 2.0 Instruction Manual The purpose of the Auto Grid Generator is to offer a quick way to generate a predetermined number of plots. This method should be used for polygons where the number of desired plots is known. The number of plots can be read from a field in the polygon layer, or input on the form below. SilvAssist will generate the number of plots, with the desired ratio and fit the plots to the polygon. If we had a 1 acre polygon selected and used this method, SilvAssist would attempt to place 25 proportionally distributed plots into the 1 acre polygon. However, for this example, the polygon is larger and will create a more reasonable grid for 25 plots.
12 Plot Allocator Auto Grid Type Generation SilvAssist 2.0 Instruction Manual BUFFER: SilvAssist allows the user to enter a buffer, if desired. This pushes plots away from polygon perimeters. Warning: doing this may bias sampling. It is of value when stands do not have roads delineated out. If not, leave the field blank and SilvAssist will default to a buffer of 0. In this example, we will use 5 meters as the buffer distance. AZIMUTH: Azimuth for grids can be specified at this point. Without entry, SilvAssist can assign no Azimuth by defaulting to 0 and 90 planes (N/S, E/W). SilvAssist can also run the plots along the long axis of the polygon or read the azimuth from a field in the polygon layer.
13 Plot Allocator Auto Grid Type Generation Spatial Overlay Options SilvAssist 2.0 Instruction Manual Spatial Overlay: Used to push attributes from polygons into the points (plots) being allocated. Doing stand id is the most common and critical. This sets up a relationship between stands and plots which is useful in reporting. **this functionality is also available as a stand alone tool: Spatial Overlay tool (p. 47)
14 Plot Allocator Auto Grid Type Generation Review and Run SilvAssist 2.0 Instruction Manual SilvAssist Plot Allocator is now ready to process the grids with the settings established in the previous dialog boxes. Review the settings, and if necessary, make corrections by going back. If settings are correct, proceed by selecting Run.

, the start number (1), the end")
15 Plot Allocator SilvAssist 2.0 Instruction Manual Auto Grid Type Generation Confirmation and Results Review Once the processing is complete, a confirmation dialog box will appear, showing the number of plots generated (in this example 75), the start number (1), the end number (75) and the layer to which they were written (Plots).
16 Plot Allocator Custom Grid Generation SilvAssist 2.0 Instruction Manual We will now look at another option for generating grids/plots using SilvAssist. In the previous example, we used the Auto method for generating a grid. In this example, we will look at the Custom method for grid generation. For consistency, we have cleared the previous grid generated from the plots layer so that we can look at the same three polygons and compare the differences in the methods used to generate the grids. The first two dialog boxes will appear the same and require the same information.
17 Plot Allocator Custom Grid Generation The Custom Grid option allows you to specify the grid units and the spacing between plots. The spacing numbers entered will use the grid units you specify. Once these are entered, press the Next >> button.
18 Plot Allocator Custom Grid Generation SilvAssist 2.0 Instruction Manual BUFFER: SilvAssist allows the user to enter a buffer, if desired. Warning: doing this may bias sampling. In this example, we will use 5 meters as the buffer distance. AZIMUTH: The azimuth for the grids can also be determined at this point. SilvAssist can assigned no Azimuth, which would essentially default to 0 and 90 planes (N/S, E/W). SilvAssist can also run the plots along the long axis of the polygon or read the azimuth from a field in the polygon layer.
19 Plot Allocator Custom Grid Generation Spatial Overlay: Used to push attributes from polygons into the points (plots) being allocated. Doing stand id is the most common. This sets up a relationship between stands and plots which is useful in reporting. **this functionality is also available as a stand alone tool: Spatial Overlay tool (p. 47)
20 Plot Allocator Custom Grid Generation SilvAssist Plot Allocator is now ready to process the grids with the settings established in the previous dialog boxes. At this point review the settings and if all appears to be correct, proceed by selecting Run.
21 Plot Allocator Custom Grid Generation Confirmation and Results Review SilvAssist 2.0 Instruction Manual Once the processing is complete, a confirmation dialog box will appear, showing the number of plots generated (in this example 2516), the start number (1), the end number (2516) and the layer to which they were written (Plots).
22 Plot Allocator Simple Grid Generation SilvAssist 2.0 Instruction Manual We will now look at another option for generating grids/plots using SilvAssist. In the previous example, we used the Custom method for generating a grid. In this example, we will look at the Simple method for grid generation. The purpose of the simple grid is to place a grid across the selected polygons, as if the boundaries between the polygons don t exist. This process will take longer to produce a grid than the others. Note: a faster way to do this is to use a compartment or property boundary polygon to do allocation. For consistency, we have cleared the previous grid generated from the plots table so that we can look at the same four polygons and compare the differences in the methods used to generate the grids. The first two dialog boxes will appear the same and require the same information.

23 Plot Allocator Simple Grid Generation The Simple Grid option allows you to specify the grid units and the spacing between plots. Once these are entered, press the Next >> button.

24 Plot Allocator Simple Grid Generation The Simple Grid Options do not allow buffering and therefore this option is grayed out, as shown above. The azimuth options are the same as the Auto and Custom options.
25 Plot Allocator Simple Grid Generation Spatial Overlay: Used to push attributes from polygons into the points (plots) being allocated. Doing stand id is the most common. This sets up a relationship between stands and plots which is useful in reporting. **this functionality is also available as a stand alone tool: Spatial Overlay tool (p. 47)

26 Plot Allocator Simple Grid Generation SilvAssist Plot Allocator is now ready to process the grids with the settings established in the previous dialog boxes. At this point review the settings and if all appears to be correct, proceed by selecting Run.
, the start number (1), the end number (2574) and the layer to which they were written (Plots).")
27 Plot Allocator Simple Grid Generation Once the processing is complete, a confirmation dialog box will appear, showing the number of plots generated (in this example 2574), the start number (1), the end number (2574) and the layer to which they were written (Plots).
28 Plot Allocator Random Grid Generation A new enhancement to the Plot Allocator is the Random Grid Generator. Simply select

29 Plot Allocator Random Grid Generation After selecting the random option in the drop list, a couple of settings become available. First, choose how you d like the number of plots to be determined. You can either read from a field in the polygon layer or you can enter the number of plots. In this example we will enter 27 plots to be created in random locations. You also have the ability to enter a minimum distance from between plots. This distance will use the units of your data, that is, meters or feet. Be careful with this option. A value too high will result in a grid that cannot be calculated. For this example, we will leave as 1.
30 Plot Allocator Random Grid Generation Enter the polygon buffer and azimuth options as with other grid generation options. For this example we will enter none. Note, a random grid does not have an azimuth, it is Random. Entering a value here may not be prudent.


31 Plot Allocator Random Grid Generation Once we set the spatial overlay and verify our parameters, we are ready to generate the random grid.

32 Plot Allocator Random Grid Generation Congratulations! You have just created a random grid using SilvAssist 2.0.
33 Plot Allocator Azimuth Options In the previous examples, the Azimuth Option was selected as None for all grid generations. We would like to show you the effects of utilizing the azimuth options. Note: this feature may allow grids to fit better in irregular shaped polygons, and allow for efficiencies due to less lines within a polygon. We will generate a custom grid with the exact same settings as the example starting on page 13. However, we will now choose to change the azimuth to run along the long line of the axis, as shown below.
34 Plot Allocator Azimuth Options Azimuth None - Automated Azimuth Along Long Axis
35 The desired Azimuth can also be input from a table or as a value across all stands selected. To illustrate the azimuth determination from a polygon field, we ve created a field in our Stands layer called Azimuth and entered random numbers for 3 sample polygons. Plot Allocator Azimuth Options
36 Plot Allocator Azimuth Options The resulting grids are generated using the values from the Azimuth Field, as shown above.
37 Plot Loader Tool The Plot Loader Tool was developed to streamline the process of bringing forest inventory data into the Geodatabase, which ultimately allows the user to maintain all of their data in one central repository. A new enhancement for the Plot Loader Tool in SilvAssist 2.0 is loading of tree grade data for use in grade reports. Note: this tool sets up table relationship keys so that reports and statistics produced from the toolbar will work. One must use this tool in order for other toolbar functions to work. Feature classes and tables involved are Stands feature class, Plots feature class (spatial), Plot and Tree tables (from T-Cruise). Stands and Plots feature classes are related by the StandID field; Plots feature class and Plot table are related to each other by PlotID and to Tree and TreeGrdVol tables by PlotID (in Plots and Plot) to Treeindex (in Tree and TreeGrdVol). Requirements- LandMarkExport.mdb (created by TCruise when the user has the LandMarkExportRNF.dll* enabled),polygon Layer,Point Layer. *For more information regarding the LandMarkExportRNF.dll for TCruise, please contact your local LandMark Systems Business Partner.
.")
38 Plot Loader Tool First, start by selecting the Plots feature class that will be used to set up the relates for the load. You can also create a new plots feature class (this will be covered later in this section). You will then select the Plot ID field in the Plots feature class that will be used to set up the relates for the load.


39 Plot Loader Tool Next, Select the Stands feature class and Stand ID field within the Stands feature class that will be used to set up the relates.


40 Plot Loader Tool You will now need to select the LandMark Export database that will be used for the load. You can do this by either clicking the browse button and navigate to the LandMark Export file......or dragging and dropping the file from your file explorer.


41 Plot Loader Tool Multiple LandMark Export databases can be loaded in a single run. You can also remove a file from the load if you selected an incorrect file by highlighting the file in the list and clicking on Remove.


42 Plot Loader Tool Other options for the load include to run the spatial overlay for the Plots feature class, over-write the Plots features/plot and Tree tables from a previous load, and create a custom load tag for records in the Plots feature class. The spatial overlay is only necessary if any changes have been made to Stand ID s or stand boundaries. The over-write is used if data was corrected and re-run in TCruise and you wanted to over-write an original load. The custom load tag is to identify records in the tables that are associated with a particular load. If there is a mistake in the load, the records can be deleted by load tag after a load is If you are not grading trees in TCruise, you can turn off the loading of the tree grade volume table by selecting Additional Options above. Just un-check the Grade Table box and choose Save. Note: the tree grade volume table is necessary for the grade reports covered in a later section.

43 Plot Loader Tool After all settings are correct, click on Run. A status window will be displayed while the run is processing and a success window will pop up when the load is complete. The status window will show you a count of the Plot and Tree records from the LandMark Export database that were read, loaded, and/or rejected. Upon loading, plots spatial features are flagged with a Y in the plot feature class Active field. This is to indicate to reporting tools that volume reports can be created with the plots and their tree data. Plots with loaded data must have this Y value in the active field in order for the reports to function properly.

.")

44 Plot Loader Tool If there are any errors in the data to be loaded from the LandMark Export database (i.e. duplicate plot id s, plots missing plot id s, plots missing lat./long.), a message box will pop up indicating that there are errors and you will be prompted to designate a folder to save the error log (text file). You will need to navigate to this folder and open the error log to see a list of the errors that need to be corrected to successfully load the data. Note: plots which have no latitude or longitude values will not be loaded.
.")
45 Plot Loader Tool Another option in the plot loader is to create a new plots feature class if one currently does not exist. When the loader is run, the plots will be spatially rendered from the Lat./Long. coordinates in the LandMark Export database. First, select the geodatabase to create the new Plots feature class in (either from the current ArcMap project or from the file explorer). You can use the browse button or drag and drop the file from your file explorer.
46 Plot Loader Tool You may select a feature dataset to create the new Plots feature class in if one exists in the geodatabase. You will then need to name the new Plots feature class. After all settings are correct, click on Create.
47 Plot Loader Tool Another option in the plot loader is to Manage Inventory Data. This is used to delete data that has been loaded to the geodatabase. The first step is to designate the Plots and Stands feature classes and ID fields that were used to set up the relationships for the load. Next, click on Manage Inventory Data.

48 Plot Loader Tool You will have the option to delete by PlotID, StandID, or LoadName. Next, select the specific records you would like to delete from the All Items box and use the >> button to move the selected ID s to the Items to Delete box. If you have made any errors, you can select the records from the Items to Delete box and use the << button to move them back to remove them. You also have the option to delete the spatial Plots from the Plots feature class. If this box is unchecked, only the records from the Plot and Tree tables will be deleted.


49 Plot Loader Tool You will receive a confirmation prompt to verify that you want to delete the selected records. Click on Yes to continue or No to abort. You will then receive a prompt indicating what was deleted.

50 Spatial Overlay The Spatial Overlay tool transfers stand attributes to plots (points). This should be done if stands were split or a stand boundary has changed. It is especially important to run an overlay if your stand id s have been changed. The overlay tool maintains the database relationships (through location) that allow SilvAssist to relate stands to plots and trees. Notice in the example below, the StandID is 0, which does not match the actual StandID for the polygon (1184)
 or run all.")
51 Spatial Overlay The Spatial Overlay tool will guide you through the process of assigning Stand information to Point layers. Answer the questions as they present themselves. You can choose to overlay using selected Plot features (points) or run all. In this example, all will be run.


52 Spatial Overlay Enter the From Polygon and To Point options as shown above and press the Set Items button. You can choose many fields, such as Stratum, etc. You can even have the field dynamically created in the Point layer by selecting Create as New Field When ready, select the Run button to process.


53 Spatial Overlay When the processor has finished, you will receive a confirmation that the Overlay has successfully completed. PlotID 2311 before the Spatial Overlay tool PlotID 2311 after the Spatial Overlay tool

54 Choose the Point Layer you wish to have converted to a Waypoint file. Again, you can choose individual points or choose to create a waypoint file from all points in the layer. Waypoint Converter The Waypoint Converter converts point features created by the Plot Allocator into a useable waypoint file compatible with Trimble Forestry Automation s SOLO Forest and SOLO Field. The waypoint file is required in the LandMark Systems patented RTI tool when using SOLO Forest or SOLO Field. Before utilizing this utility, make sure your point layer has a PLOTID Field. StandID and Cruise ID Fields are optional.


55 Waypoint Converter Next, choose the output directory and name the waypoint file. In the example below, we have chosen to write the file to My Documents\TestingDataSets\DataSets and we named the file SilvAssist_Sample.way. Press Save to continue the process.


56 Waypoint Converter Choose Run when you are ready to create the Waypoint file. Once the process is complete, you will receive the Complete confirmation dialog box indicating such.


57 Waypoint Converter By loading the Waypoint file into SOLO you can also verify its compatibility with your SOLO Project. ArcGIS SOLO Forest

58 Reporting and Analytics SilvAssist 2.0 Instruction Manual Using SilvAssist Reports In order for all reports in SilvAssist to work properly, the Plot Loader must have been used to load the cruise data into the geodatabase. In order for volumes to be reported or statistics to be calculated, a relationship must be established between the plots and the volumes created by TCruise. It is, also, important to be sure your assigning of polygon id s to plots is correct. This can be accomplished using the spatial overlay tool. After inventory data has been loaded into the geodatabase with the Plot Loader tool, we can generate reports from this data. Note, all reports use data which is active as indicated by a Y in the plot feature class Active field. Once that is complete, we can begin by selecting a few stands for which we want to see reports. By using the Select tool on the ArcGIS toolbar and pressing and holding Ctrl and Shift, you can select multiple polygons for which to report.

59 Reporting and Analytics SilvAssist 2.0 Instruction Manual Using SilvAssist Reports Now that your stands are selected, select the Reporting and Analytics button on the SilvAssist Toolbar Enter the information as it pertains to your dataset. Once this is entered, SilvAssist Reports will default to this on the next reports run. Notice, in this example that we have opted to use the three polygons we selected. We can also Group the reports by a field in the GeoDatabase. In this example we will choose to group by StandID which is the default if you do not choose anything here.

60 Reporting and Analytics SilvAssist 2.0 Instruction Manual Using SilvAssist Reports Next, we will set up the necessary information for our reports to use, such as stumpage values and company information. First, lets press the Company Information button and enter the information in the dialog box. Press Save when finished.

61 Reporting and Analytics SilvAssist 2.0 Instruction Manual Using SilvAssist Reports In order to obtain value reports we must enter stumpage values for each of our products. Press the Stumpage Values button. In order to speed up the process, you can press the Show based on feature selection only button to list only the products pertaining to the polygons selected. Next enter the pricing and units. Once entered, press the Next Record button to save and move to the next product. Once all pricing is entered, you can press the Save and then Exit buttons.

62 Reporting and Analytics SilvAssist 2.0 Instruction Manual Using SilvAssist Reports Finally we will assign our Groups to Classes. This will provide reports by tree classes. In this example, we are assigning all Pine products to the Pine Class as well as Hardwood products to the Hardwood Class. Classes can be anything, broad tree classes, sawmills, etc. This is an easy way to combine species groups to a higher level.

63 Reporting and Analytics SilvAssist 2.0 Instruction Manual Crystal Reports We are now ready to choose the report type. Press Next to select which report you wish to generate. In this example we will choose the Crystal Reports. You can also double click on the Report type you want to go to. The list of available Crystal Reports are now presented. Choose the report you wish to generate and press Run. You can also double click on the Report you want to run.


64 Reporting and Analytics SilvAssist 2.0 Instruction Manual Crystal Reports You will now be prompted to enter information regarding the report, such as labels and volume parameters. Once you have entered the parameters, press finish to generate the reports.

65 Reporting and Analytics SilvAssist 2.0 Instruction Manual Crystal Reports The reports are now generated with your custom header information. Report pages by stand Id s can be toggled by using the quick navigation bar on the left of the screen
66 Reporting and Analytics SilvAssist 2.0 Instruction Manual Excel Pivot Reports Again, the Excel Pivot Reports rely on loading T-Cruise data using the Plot Loader tool (p. 34). The process for generating the excel pivot reports is the same for the Crystal Reports generator. However, we will choose the Report Type of Excel Pivot Reports, as shown above.

67 Reporting and Analytics SilvAssist 2.0 Instruction Manual Excel Pivot Reports You are now offered the opportunity to name the reports as well as Exclude Non-merchantable timber in the report. The Report Image is pulled from the logo you specified in the Company Information Setup. When you are ready to generate the report, press Run.


68 Reporting and Analytics SilvAssist 2.0 Instruction Manual Excel Pivot Reports Stand and Stock data is output two ways, an Excel document such as above, and a geodatabase table described on the next page. To see the source data for the pivot tables, right click worksheets and select unhide. The advantages of pivot tables is that data can be copied or pasted into other documents, or further manipulated as a custom report. By using Excel, you can go to Pivot Table options and see the available fields by selecting Field List. As seen from the screen shot above, there are many options for summarizing data.

69 Reporting and Analytics SilvAssist 2.0 Instruction Manual Excel Pivot Reports Stand and Stock data is also written to a geodatabase table, LMS_StandStock This table offer several options, to mention a couple: -Set up one to many relates to stands on stand id -Summarized (rt. Click in ArcMap tables) by stand id to get volumes which can be joined to stands for symbolizing in stand layer

70 Reporting and Analytics SilvAssist 2.0 Instruction Manual Excel Pivot Reports Please note, if you choose to view the data for all stands, the reports will sum the average per acre data, thus causing an incorrect report. Total volumes will report correctly.
.")

71 Reporting and Analytics SilvAssist 2.0 Instruction Manual Statistic Reports Again, the Statistic Reports rely on loading T-Cruise data using the Plot Loader tool (p. 34). Choose the Statistic Reports and press Next. Set the parameters for which you want to see the statistics generated, such as Stats Field, Stats Unit, Percent Confidence Level, and Allowable Error. The Stat Sub Level will output stats by lower level groupings within a geographic area such as Classes, Species Groups, and Products. You can select all sublevels, no sublevels, or any sequence of sublevels you want to output.


 or to exclude a certain group")
72 Reporting and Analytics SilvAssist 2.0 Instruction Manual Statistic Reports Constraints are used to exclude certain tree records from the calculations. There are a few default constraints such as: Product Not Submerch, Product Not Cull, Group is Pine, and Group is Hardwood. The default setting is to not include Submerch or Cull. You may remove any constraint by selecting the item in the constraint list and choosing the Remove button. There are also advanced constraints, you may access this by choosing the Advanced button. The options are to constrain by GroupName, ProductName, or DBH. If you choose GroupName or ProductName, you will be given the option to only include a certain group (Is) or to exclude a certain group (Not). You can then choose the groups you want to include or exclude from the dropdown list for the Value. If you choose DBH, you can choose from any number of numeric operators to include or exclude certain DBH values. You can then type a DBH value into the value box. You can also specify a range of DBH values by specifying multiple DBH constraints (such as dbh >12 and dbh <15).


73 Reporting and Analytics SilvAssist 2.0 Instruction Manual Statistic Reports The reports are generated and written to an Excel document. In an effort to help foresters better understand statistics, we also include a Metadata tab in each Statistics report that clarifies the data.

74 Reporting and Analytics SilvAssist 2.0 Instruction Manual Grouping and Concatenation Users can report and calculate statistics based on groups of stands. This is done using fields in a stand or polygon feature class. This function allows you to generate stratified reports and calculate statistics based on an existing stratification or attribute field. For instance, if you had Logging Conditions as a field in stands and wanted to know the amount of volume by various logging conditions, this tool would report inventory data by each condition. In the first example, we will make a simple choice and choose Stratum and Broad Type as the fields to group by. Simply enable Concatenation and select the grouping fields. Press the Build Concat button to start the grouping. Note, if your data contains coded domains, the outputs will show the codes, not the descriptions.
75 3059 Highland Oaks Terrace Tallahassee, FL For additional Support options, tips or post a question: see our online community at Or on the SilvAssist product page:
SilvAssist 3.5 Instruction Manual Instruction Manual for the SilvAssist Toolbar For ArcGIS. Version 3.5
 Instruction Manual for the SilvAssist Toolbar For ArcGIS Version 3.5 1 2 Contents Introduction... 5 Preparing to Use SilvAssist... 6 Polygon Selection... 6 Plot Allocator... 7 Requirements:... 7 Operation...
Select the Parks within Forest Acres
 Select the Parks within Forest Acres TASKS RESULT 1. Add the county boundary, municipalities and parks (pts.) layers to your map 2. Save your map (.mxd) to your desktop Your map should look something like
Introduction to Solo Forest
 Introduction to Solo Forest Project Settings Collecting Data Office Procedures - Exporting Shapefiles - Syncing with the PC - Transferring files Opening Solo Forest To open Solo Forest, select Start >
Appendix Z Basic ArcMap and GDSE Tools
 Appendix Z Basic ArcMap and GDSE Tools Introduction IFMAP has been developed within ESRI s ArcMap interface. As such, the application is inherently map-based. Although a user can enter tabular data through
The Timber Cruise Suite
 HAGLOF MANAGEMENT SYSTEMS The Timber Cruise Suite Timber Cruise and Haglof Management Systems: a comprehensive integrated forest analysis solution 2011 01 28 User s Guide for the Timber Cruise Suite in
GIS LAB 1. Basic GIS Operations with ArcGIS. Calculating Stream Lengths and Watershed Areas.
 GIS LAB 1 Basic GIS Operations with ArcGIS. Calculating Stream Lengths and Watershed Areas. ArcGIS offers some advantages for novice users. The graphical user interface is similar to many Windows packages
Working with Attribute Data and Clipping Spatial Data. Determining Land Use and Ownership Patterns associated with Streams.
 GIS LAB 3 Working with Attribute Data and Clipping Spatial Data. Determining Land Use and Ownership Patterns associated with Streams. One of the primary goals of this course is to give you some hands-on
Create a personal geodatabase
 Create a personal geodatabase To create a personal geodatabase that corresponds to the same release as the ArcGIS for Desktop client you are using, follow these steps: 1. In ArcCatalog, right-click the
Display Layers in Geosoft 3D View
 Use the New 2D/3D Workflow features in Target for ArcGIS In Target for ArcGIS version 3.5, there are three new interconnected features that make integrating 2D and 3D data in plan and section maps easier.
Normal Cruise Techniques
 Normal Cruise Techniques Intro to TCruiseCE Collecting data for a Form Class Cruise Collecting data for a Profile Function Cruise Transferring Cruise Data to the PC Calculating Volumes in TCruise Office
Data Assembly, Part II. GIS Cyberinfrastructure Module Day 4
 Data Assembly, Part II GIS Cyberinfrastructure Module Day 4 Objectives Continuation of effective troubleshooting Create shapefiles for analysis with buffers, union, and dissolve functions Calculate polygon
Basic Tasks in ArcGIS 10.3.x
 Basic Tasks in ArcGIS 10.3.x This guide provides instructions for performing a few basic tasks in ArcGIS 10.3.1, such as adding data to a map document, viewing and changing coordinate system information,
for ArcSketch Version 1.1 ArcSketch is a sample extension to ArcGIS. It works with ArcGIS 9.1
 ArcSketch User Guide for ArcSketch Version 1.1 ArcSketch is a sample extension to ArcGIS. It works with ArcGIS 9.1 ArcSketch allows the user to quickly create, or sketch, features in ArcMap using easy-to-use
FOR 240 Lab 8 Assignment Using GPS to Collect Spatial Data of Forest Management Introduction to Computing in Natural Resources
 FOR 240 Lab 8 Assignment Using GPS to Collect Spatial Data of Forest Management Introduction to Computing in Natural Resources In this lab, we are going to use the GPS to collect timber cruising data.
1. To create a new project, start the FIA BioSum Manager application and select <File><New Project> (see Figure 2.1).
.") 2. Database The Database module is the first step in the BioSum workflow. This section describes how to navigate the BioSum menu, create a new project, open an existing project, add and delete forest inventory
2. Database The Database module is the first step in the BioSum workflow. This section describes how to navigate the BioSum menu, create a new project, open an existing project, add and delete forest inventory
Tutorial: Geodatabase Developed for i-tree Eco Full Inventory
 Tutorial: Geodatabase Developed for i-tree Eco Full Inventory Acknowledgement This project was supported by the Urban & Community Forestry Program of the U.S. Forest Service, Department of Agriculture
Table of Contents. 1. Prepare Data for Input. CVEN 2012 Intro Geomatics Final Project Help Using ArcGIS
 Table of Contents 1. Prepare Data for Input... 1 2. ArcMap Preliminaries... 2 3. Adding the Point Data... 2 4. Set Map Units... 3 5. Styling Point Data: Symbology... 4 6. Styling Point Data: Labels...
Biodiversity Interactive Map
 Powered by MapShare Biodiversity Interactive Map (BIM) User Tips The Biodiversity Interactive Map (BIM) is accessible via the Department of Environment and Primary Industries (DEPI) website at www.depi.vic.gov.au.
1. Start ArcMap by going to the Start menu > All Programs > ArcGIS > ArcMap.
 Learning ArcGIS: Introduction to ArcMap 10.1 The Map Document Feature Manipulation Navigating ArcMap Map Documents, Layers, and Features Shapes, Location, and Attribute Data Symbology Zoom, Pan and Map
Name: Date: June 27th, 2011 GIS Boot Camps For Educators Lecture_3
 Name: Date: June 27th, 2011 GIS Boot Camps For Educators Lecture_3 Practical: Creating and Editing Shapefiles Using Straight, AutoComplete and Cut Polygon Tools Use ArcCatalog to copy data files from:
OziExplorer Training and Help Manual for Use with Soil Resource Stewardship Monitoring Checklist: Cutblock-Level
 for Use with Soil Resource Stewardship Monitoring Checklist: Cutblock-Level Stéphane Dubé, Soil Scientist MOFR Northern Interior Forest Region May 2009 Version 2 Starting up This section will describe
Downloading Census Data from American Factfinder2 for use in ArcGIS
 Downloading Census Data from American Factfinder2 for use in ArcGIS Written by Barbara Parmenter, revised November 18, 2011 OBTAINING DATA FROM AMERICAN FACTFINDER2... 1 PREPARING AMERICAN FACTFINDER DATA
Appendix 2: Random Plots Workbook: Unstratified Sample
 Appendix 2: Random Plots Workbook: Unstratified Sample These instructions will help users of all skill levels create a random sample of i-tree Eco plot centers, plot areas, and the associated i-tree Eco-required
Greenville County Internet Mapping System User s Guide
 Greenville County Internet Mapping System User s Guide Version 2.0 Greenville County Geographic Information Systems May 30, 2006 Table of Contents NAVIGATING TO THE ONLINE MAPPING APPLICATIONS...- 3 -
1 MAPLE EXCEL MACRO TECH NOTE JOEL HYING
 1 MAPLE EXCEL MACRO TECH NOTE Purpose : To explain how to view historical trend data in Microsoft Excel recorded from the Maple Silver Series touchscreen. The Maple touchscreen records the historical data
OziExplorer Training and Help Manual for Use with Soil Resource Stewardship Monitoring Checklist: Cutblock-Level
 OziExplorer Training and Help Manual for Use with Soil Resource Stewardship Monitoring Checklist: Cutblock-Level Stéphane Dubé, Soil Scientist MOFR Northern Interior Forest Region May 2009 Version 2 Starting
Calculate a Distance Matrix of Locations along River Network
 Calculate a Distance Matrix of Locations along River Network These instructions enable you to measure the length of line segments between points, which is much more useful than simple straight-line distances
ArcGIS Extension User's Guide
 ArcGIS Extension 2010 - User's Guide Table of Contents OpenSpirit ArcGIS Extension 2010... 1 Installation ( ArcGIS 9.3 or 9.3.1)... 3 Prerequisites... 3 Installation Steps... 3 Installation ( ArcGIS 10)...
QUICK START GUIDE. SOLO Forest
 QUICK START GUIDE SOLO Forest Software Installation 1. For PC installation, run the.msi file. 2. For Mobile device installation, copy the.cab file onto the device 3. Run the.cab file Starting the Program
Installation 3. PerTrac Reporting Studio Overview 4. The Report Design Window Overview 8. Designing the Report (an example) 13
 13") Contents Installation 3 PerTrac Reporting Studio Overview 4 The Report Design Window Overview 8 Designing the Report (an example) 13 PerTrac Reporting Studio Charts 14 Chart Editing/Formatting 17 PerTrac
Contents Installation 3 PerTrac Reporting Studio Overview 4 The Report Design Window Overview 8 Designing the Report (an example) 13 PerTrac Reporting Studio Charts 14 Chart Editing/Formatting 17 PerTrac
GIS LAB 8. Raster Data Applications Watershed Delineation
 GIS LAB 8 Raster Data Applications Watershed Delineation This lab will require you to further your familiarity with raster data structures and the Spatial Analyst. The data for this lab are drawn from
How to Create a Tile Package
 United States Department of Agriculture Digital Mobile Sketch Mapping (DMSM) How to Create a Tile Package (TPK) Forest Service Introduction A tile package (.tpk) allows you to use a set of packaged tiles
TRAINING GUIDE. GIS Editing Tools for ArcGIS Desktop
 TRAINING GUIDE GIS Editing Tools for ArcGIS Desktop Editing Tools for ArcGIS Desktop Lucity GIS contains an editor extension that tracks edits made to the Lucity GIS geodatabase and ensures that those
User Manual. Administrator s guide for mass managing VirtueMart products. using. VM Mass Update 1.0
 User Manual Administrator s guide for mass managing VirtueMart products using VM Mass Update 1.0 The ultimate product management solution for VirtueMart! Contents Product Overview... 3 Feature List...
Creating and Displaying Multi-Layered Cross Sections in Surfer 11
 Creating and Displaying Multi-Layered Cross Sections in Surfer 11 The ability to create a profile in Surfer has always been a powerful tool that many users take advantage of. The ability to combine profiles
Geographical Information Systems Institute. Center for Geographic Analysis, Harvard University. LAB EXERCISE 1: Basic Mapping in ArcMap
 Harvard University Introduction to ArcMap Geographical Information Systems Institute Center for Geographic Analysis, Harvard University LAB EXERCISE 1: Basic Mapping in ArcMap Individual files (lab instructions,
A GIS SAMPLING ASSISTANT PROGRAM FOR FOREST INVENTORY POINT/PLOT SCHEMES
 A GIS SAMPLING ASSISTANT PROGRAM FOR FOREST INVENTORY POINT/PLOT SCHEMES Donald J. Lipscomb, Research Specialist Department of Forestry and Natural Resources Clemson University, Clemson, S.C. 29634 Dr.
Exercise Enumeration Areas
 Exercise Enumeration Areas 2007 In this exercise you will work with an existing file geodatabase and create new enumeration areas within the established larger census area maintaining geographic integrity
Data Import and Quality Control in Geochemistry for ArcGIS
 Data Import and Quality Control in Geochemistry for ArcGIS This Data Import and Quality Control in Geochemistry for ArcGIS How-To Guide will demonstrate how to create a new geochemistry project, import
Answer the following general questions: 1. What happens when you right click on an icon on your desktop? When you left double click on an icon?
 Name: Date: June 27th, 2011 GIS Boot Camps For Educators Practical: Explore ArcGIS 10 Desktop Tools and functionality Day_1 Lecture 1 Sources: o ArcGIS Desktop help o ESRI website o Getting to Know ArcGIS
ArcCatalog or the ArcCatalog tab in ArcMap ArcCatalog or the ArcCatalog tab in ArcMap ArcCatalog or the ArcCatalog tab in ArcMap
 ArcGIS Procedures NUMBER OPERATION APPLICATION: TOOLBAR 1 Import interchange file to coverage 2 Create a new 3 Create a new feature dataset 4 Import Rasters into a 5 Import tables into a PROCEDURE Coverage
Exercise 1: An Overview of ArcMap and ArcCatalog
 Exercise 1: An Overview of ArcMap and ArcCatalog Introduction: ArcGIS is an integrated collection of GIS software products for building a complete GIS. ArcGIS enables users to deploy GIS functionality
Streamlining Editing Workflows. Amber Bethell
 Streamlining Editing Workflows Amber Bethell Workflow for solving geographic problems Ask a question Create or acquire data Validate and update data Analyze data Create cartographic product Act upon knowledge
ArcMap Editing Tips and Tricks. Sean Jones
 ArcMap Editing Tips and Tricks Sean Jones Overview Topics - Tuning your editing map - Creating features - Editing features and attributes - Aligning and editing coincident features - Addins Format - Software
Extracting RESULTs Information from the Land & Resource Data Warehouse (LRDW)
") Extracting RESULTs Information from the Land & Resource Data Warehouse (LRDW) The following instructions will illustrate how to extract inventory Results information from the Land & Resource data Warehouse
Extracting RESULTs Information from the Land & Resource Data Warehouse (LRDW) The following instructions will illustrate how to extract inventory Results information from the Land & Resource data Warehouse
Extracting Inventory History Information from the Land & Resource Data Warehouse (LRDW)
") Extracting Inventory History Information from the Land & Resource Data Warehouse (LRDW) The following instructions will illustrate how to extract inventory history information from the Land & Resource
Extracting Inventory History Information from the Land & Resource Data Warehouse (LRDW) The following instructions will illustrate how to extract inventory history information from the Land & Resource
Hands-on GIS Project Watershed land use changes Smart Growth?
 Hands-on GIS Project Watershed land use changes 1995 2007 Smart Growth? Introduction New Jersey smart growth strategies aim at growing communities in a way that preserves open spaces, minimizes pollution
Intro to GIS (requirements: basic Windows computer skills and a flash drive)
") Introduction to GIS Intro to GIS (requirements: basic Windows computer skills and a flash drive) Part 1. What is GIS. 1. System: hardware (computers, devices), software (proprietary or free), people. 2.
Introduction to GIS Intro to GIS (requirements: basic Windows computer skills and a flash drive) Part 1. What is GIS. 1. System: hardware (computers, devices), software (proprietary or free), people. 2.
Downloading 2010 Census Data
 Downloading 2010 Census Data These instructions cover downloading the Census Tract polygons and the separate attribute data. After that, the attribute data will need additional formatting in Excel before
Editing Parcel Fabrics Tutorial
 Editing Parcel Fabrics Tutorial Copyright 1995-2010 Esri All rights reserved. Table of Contents Tutorial: Getting started with parcel fabric editing...................... 3 Tutorial: Creating new parcels
Making ArcGIS Work for You. Elizabeth Cook USDA-NRCS GIS Specialist Columbia, MO
 Making ArcGIS Work for You Elizabeth Cook USDA-NRCS GIS Specialist Columbia, MO 1 Topics Using ArcMap beyond the Toolkit buttons GIS data formats Attributes and what you can do with them Calculating Acres
Downloading Census Data from American Factfinder for use in ArcGIS
 Downloading Census Data from American Factfinder for use in ArcGIS Written by Barbara Parmenter, revised September 24 2013 OBTAINING DATA FROM AMERICAN FACTFINDER (AFF)... 1 PREPARING AMERICAN FACTFINDER
GIS IN ECOLOGY: ANALYZING VECTOR DATA
 GIS IN ECOLOGY: ANALYZING VECTOR DATA Contents Introduction... 3 Tools and Functionality for Vector Data... 3 Course Data Sources... 4 Instructions for Copying the Course Dataset... 4 Tasks... 4 Getting
From Non-Spatial Data to Spatial Data. Geocoding & Georeferencing in ArcGIS
 03-Geocoding & Georeferencing In Arcgis.Doc Page 1 of 10 From Non-Spatial Data to Spatial Data. Geocoding & Georeferencing in ArcGIS Objectives Upon completion of this tutorial, you should be able to perform
Getting to Know ModelBuilder
 Getting to Know ModelBuilder Offered by Shane Bradt through the UNH Cooperative Extension Geospatial Technologies Training Center Developed by Sandy Prisloe and Cary Chadwick at the Geospatial Technology
Step. Step 2. Step 3. Step 4 12/14/2016. Step 1: Run a Custom Query in DIMA
 Creating an Attributed Shapefile from DIMA This tutorial describes the process of extracting data from DIMA into a point shapefile. The process assumes that you know how to run a data report (see the AIM
GIS IN ECOLOGY: CREATING RESEARCH MAPS
 GIS IN ECOLOGY: CREATING RESEARCH MAPS Contents Introduction... 2 Elements of Cartography... 2 Course Data Sources... 3 Tasks... 3 Establishing the Map Document... 3 Laying Out the Map... 5 Exporting Your
Chapter 7. A Quick Tour of ArcGIS Pro
 Chapter 7 A Quick Tour of ArcGIS Pro Skills you will learn: This tutorial is intended to get you going using ArcGIS Pro, a new desktop application that is part of ArcGIS Desktop. A separate tutorial gives
Tutorial 1: Finding and Displaying Spatial Data Using ArcGIS
 Tutorial 1: Finding and Displaying Spatial Data Using ArcGIS This tutorial will introduce you to the following: Websites where you may browse to find geospatial information Identifying spatial data, usable
TRAINING GUIDE. Mobile for Administrators Part 3 - GIS
 TRAINING GUIDE Mobile for Administrators Part 3 - GIS Mobile for Administrators - GIS One of the critical components of mobile is GIS, and it can also be the most complex. The mobile GIS maps are designed
Introduction to GIS & Mapping: ArcGIS Desktop
 Introduction to GIS & Mapping: ArcGIS Desktop Your task in this exercise is to determine the best place to build a mixed use facility in Hudson County, NJ. In order to revitalize the community and take
Exercise 4: Import Tabular GPS Data and Digitizing
 Exercise 4: Import Tabular GPS Data and Digitizing You can create NEW GIS data layers by digitizing on screen with an aerial photograph or other image as a back-drop. You can also digitize using imported
QSalesData User Guide
 QSalesData User Guide Updated: 11/10/11 Installing the QSalesData Software... 2 Licensing the QSalesData Product... 3 Build QSalesData fields in ACT Step 2 of Install Checklist... 4 Adding the QB Data
Explore some of the new functionality in ArcMap 10
 Explore some of the new functionality in ArcMap 10 Scenario In this exercise, imagine you are a GIS analyst working for Old Dominion University. Construction will begin shortly on renovation of the new
LAB 1: Introduction to ArcGIS 8
 LAB 1: Introduction to ArcGIS 8 Outline Introduction Purpose Lab Basics o About the Computers o About the software o Additional information Data ArcGIS Applications o Starting ArcGIS o o o Conclusion To
Geocoding Reference USA data in ArcMap 9.3
 Tufts GIS Tip Sheet Geocoding Reference USA data in ArcMap 9.3 Written by Barbara Parmenter Revised 3/1/2011 In this exercise, you will map businesses or services for a town in the Boston metropolitan
Lab 1: Exploring ArcMap and ArcCatalog In this lab, you will explore the ArcGIS applications ArcCatalog and ArcMap. You will learn how to use
 Lab 1: Exploring ArcMap and ArcCatalog In this lab, you will explore the ArcGIS applications ArcCatalog and ArcMap. You will learn how to use ArcCatalog to find maps and data and how to display maps in
Mn/DOT MnCMAT Crash Analysis Application Help
 Mn/DOT MnCMAT Crash Analysis Application Contents Login... 5 User Login Dialog... 5 Login... 5 Request Access Dialog... 5 Forgotten Password Dialog... 6 Create/Open Project... 7 Create/Open Project Dialog...
How to calculate population and jobs within ½ mile radius of site
 How to calculate population and jobs within ½ mile radius of site Caltrans Project P359, Trip Generation Rates for Transportation Impact Analyses of Smart Growth Land Use Projects SECTION PAGE Population
Pictometry for ArcGIS Desktop Local Release Notes
 Version 10.4 The Desktop - Local 10.4 extension is compatible with ArcGIS Desktop 10.4. Version 10.3.2 This extension includes a new installer, which allows you to select a location (other than Program
HOW TO MAP YOUR STEW: A
 HOW TO MAP YOUR STEW: A multi-approach guide to creating and incorporating the geographic components of your STEW-MAP survey February 2018 version Krista Heinlen and Michelle Johnson Congratulations! You
Impossible Solutions, Inc. JDF Ticket Creator & DP2 to Indigo scripts Reference Manual Rev
 Impossible Solutions, Inc. JDF Ticket Creator & DP2 to Indigo scripts Reference Manual Rev. 06.29.09 Overview: This reference manual will cover two separate applications that work together to produce a
Creating a Smaller Data Set from a Larger Data Set Vector Data
 Creating a Smaller Data Set from a Larger Data Set Vector Data Written by Barbara Parmenter, revised by Carolyn Talmadge January 16, 2015 USING THE SELECTION METHOD QUICK METHOD BY CREATING A LAYER FILE...
Creating and Editing a New Shapefile
 Creating and Editing a New Shapefile Written by Barbara Parmenter, revised October, 0 CREATING AND EDITING A NEW SHAPEFILE... CREATING THE GEOGRAPHIC FEATURE (POINT, LINE, OR POLYGON)... CREATING THE ATTRIBUTE
The SMF Pro add-in allows the import and treatment of point files coming from GPS and representing machinery movements. The GPS in the machinery must
 SMF PRO VERSION 10.0.3 TOOLBAR FOR ARCGIS 9.2 OR HIGHER FOREST MACHINE MOVEMENT MONITORING QUICK REFERENCE GUIDE JANUARY 9 T H 2012 TABLE OF CONTENTS 1. ADD-IN DESCRIPTION...2 1.1. General description...2
Geocoding vs. Add XY Data using Reference USA data in ArcMap
 Geocoding vs. Add XY Data using Reference USA data in ArcMap 10.4.1 Written by Barbara Parmenter. Revised by Carolyn Talmadge 2/27/2017 GETTING BUSINESS DATA FROM REFERENCE USA BY NAICS AND CITY... 2 MODIFY
OBIEE. Oracle Business Intelligence Enterprise Edition. Rensselaer Business Intelligence Finance Author Training
 OBIEE Oracle Business Intelligence Enterprise Edition Rensselaer Business Intelligence Finance Author Training TABLE OF CONTENTS INTRODUCTION... 1 USER INTERFACE... 1 HOW TO LAUNCH OBIEE... 1 TERMINOLOGY...
PISCES Installation and Getting Started 1
 This document will walk you through the PISCES setup process and get you started accessing the suite of available tools. It will begin with what options to choose during the actual installation and the
Doc #: IDI06-11F Rev: 1.3 Issued: 22/02/18. Well Seeker PRO How To Guide Rev 1.3. Page 1 of 26
 Well Seeker PRO How To Guide Rev 1.3 Page 1 of 26 Contents 1.0 - Getting Started... 4 1.1 - Display... 4 2.0 - Creating a new Well... 5 2.1 - Unit Selection... 5 2.2 - New Instant Plan / Survey... 6 2.3
Working with International Census Data in GIS
 Working with International Census Data in GIS Updated February 23, 2015 Table of Contents SETTING UP... 1 DATA SOURCES... 1 TABULAR CENSUS DATA... 2 2001 Tabular Census Data... 5 GEOGRAPHIC DATA... 5 JOINING
CHEMICAL SAFETY EMS SOFTWARE. Accumulation Inventory
 CHEMICAL SAFETY EMS SOFTWARE Accumulation Inventory The Accumulation Inventory Database is used to track waste materials stored in specially designated Accumulation Areas. The total quantity of waste currently
4. If you are prompted to enable hardware acceleration to improve performance, click
 Exercise 1a: Creating new points ArcGIS 10 Complexity: Beginner Data Requirement: ArcGIS Tutorial Data Setup About creating new points In this exercise, you will use an aerial photograph to create a new
INTRODUCTION TO GIS WORKSHOP EXERCISE
 111 Mulford Hall, College of Natural Resources, UC Berkeley (510) 643-4539 INTRODUCTION TO GIS WORKSHOP EXERCISE This exercise is a survey of some GIS and spatial analysis tools for ecological and natural
MAPLOGIC CORPORATION. GIS Software Solutions. Getting Started. With MapLogic Layout Manager
 MAPLOGIC CORPORATION GIS Software Solutions Getting Started With MapLogic Layout Manager Getting Started with MapLogic Layout Manager 2011 MapLogic Corporation All Rights Reserved 330 West Canton Ave.,
Exercise 5: Import Tabular GPS Data and Digitizing
 Exercise 5: Import Tabular GPS Data and Digitizing You can create NEW GIS data layers by digitizing on screen with an aerial photograph or other image as a back-drop. You can also digitize using imported
Introduction to Distance Sampling. Automated Survey Design Exercises
 Introduction to Distance Sampling Automated Survey Design Exercises 1. Point transect survey of North-eastern Mexico Reviewing the data Extract and open the project MexicoUnPrj from the archive MexicoUnPrj.zip.
Basic Excel. Helen Mills OME-RESA
 Basic Excel Helen Mills OME-RESA Agenda Introduction- Highlight Basic Components of Microsoft Excel Entering & Formatting Data, Numbers, & Tables Calculating Totals & Summaries Using Formulas Conditional
Spatial Data Standards for Facilities, Infrastructure, and Environment (SDSFIE)
") Spatial Data Standards for Facilities, Infrastructure, and Environment (SDSFIE) Migration Workflow User Guide Version 1.0 (01 August 2018) Prepared For: US Army Corps of Engineers 2018 Revision History
Spatial Data Standards for Facilities, Infrastructure, and Environment (SDSFIE) Migration Workflow User Guide Version 1.0 (01 August 2018) Prepared For: US Army Corps of Engineers 2018 Revision History
Contents. Batch & Import Guide. Batch Overview 2. Import 157. Batch and Import: The Big Picture 2 Batch Configuration 11 Batch Entry 131
 Batch & Import Guide Last Updated: 08/10/2016 for ResearchPoint 4.91 Contents Batch Overview 2 Batch and Import: The Big Picture 2 Batch Configuration 11 Batch Entry 131 Import 157 Configure Import File
TRAINING GUIDE. Tablet: Cradle to Mobile GIS
 TRAINING GUIDE Tablet: Cradle to Mobile GIS Tablet Cradle to Mobile One of the critical components of mobile is the GIS piece, and also can be the most complex. The mobile GIS maps are designed to consume
SUM - This says to add together cells F28 through F35. Notice that it will show your result is
 COUNTA - The COUNTA function will examine a set of cells and tell you how many cells are not empty. In this example, Excel analyzed 19 cells and found that only 18 were not empty. COUNTBLANK - The COUNTBLANK
Spatial Data Standards for Facilities, Infrastructure, and Environment (SDSFIE)
") Spatial Data Standards for Facilities, Infrastructure, and Environment (SDSFIE) Model Builder User Guide Version 1.3 (24 April 2018) Prepared For: US Army Corps of Engineers 2018 Revision History Model
Spatial Data Standards for Facilities, Infrastructure, and Environment (SDSFIE) Model Builder User Guide Version 1.3 (24 April 2018) Prepared For: US Army Corps of Engineers 2018 Revision History Model
Contents Part I: Background Information About This Handbook... 2 Excel Terminology Part II: Advanced Excel Tasks...
 Version 3 Updated November 29, 2007 Contents Contents... 3 Part I: Background Information... 1 About This Handbook... 2 Excel Terminology... 3 Part II:... 4 Advanced Excel Tasks... 4 Export Data from
Office of Geographic Information Systems
 Office of Geographic Information Systems Print this Page Fall 2012 - Working With Layers in the New DCGIS By Kent Tupper The new version of DCGIS has access to all the same GIS information that our old
Light Speed with Excel
 Work @ Light Speed with Excel 2018 Excel University, Inc. All Rights Reserved. http://beacon.by/magazine/v4/94012/pdf?type=print 1/64 Table of Contents Cover Table of Contents PivotTable from Many CSV
Step #1 Tract Information
 TCruise Template Setup and Editing Step #1 Tract Info 7-1 Step #2 Active Cruise Parameters 7-2 Step #3 Species Groups 7-2 Step #4 Products by Group Name 7-3 Step #5 Group Specifications 7-3 Step #6 Stumpage
Beginner s Guide to Microsoft Excel 2002
 Beginner s Guide to Microsoft Excel 2002 Microsoft Excel lets you create spreadsheets, which allow you to make budgets, track inventories, calculate profits, and design charts and graphs. 1. Open Start
Rev. C 11/09/2010 Downers Grove Public Library Page 1 of 41
 Table of Contents Objectives... 3 Introduction... 3 Excel Ribbon Components... 3 Office Button... 4 Quick Access Toolbar... 5 Excel Worksheet Components... 8 Navigating Through a Worksheet... 8 Making
GIS Basics for Urban Studies
 GIS Basics for Urban Studies Date: March 21, 2018 Contacts: Mehdi Aminipouri, Graduate Peer GIS Faciliator, SFU Library (maminipo@sfu.ca) Keshav Mukunda, GIS & Map Librarian Librarian for Geography (kmukunda@sfu.ca)
Data Assembling Topics:
 Topics: 1. GPX to Shape file 2. Data conversion with FME 3. Create a polygon feature 4. Merging /Appending data into a new dataset 5. Reproject data from one coordinate system to another 6. Data clipping