Creating Population Tree Charts (Using SAS/GRAPH Software) Robert E. Allison, Jr. and Dr. Moon W. Suh College of Textiles, N. C.
|
|
|
- Teresa Rice
- 6 years ago
- Views:
Transcription
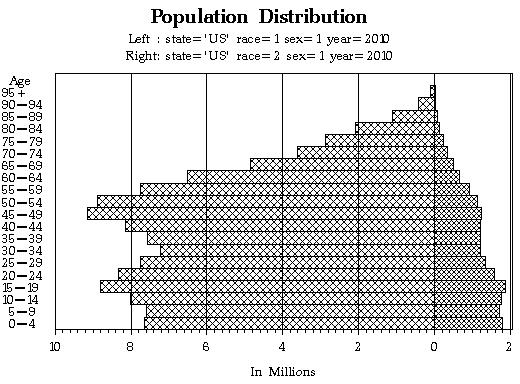
1 SESUG 1994 Creating Population Tree Charts (Using SAS/GRAPH Software) Robert E. Allison, Jr. and Dr. Moon W. Suh College of Textiles, N. C. State University ABSTRACT This paper describes a SAS program that can be used to generate tree charts of US population data (or projections) to compare any year/state/sex/race combination on the left side of the tree against any year/state/sex/race combination on the right side. INTRODUCTION Tree charts are often used to analyze Census population projections. This paper describes a SAS program which can be used to compare any two population groups. The program provides the versatility to allow users to easily select any state, year, race and sex on the left side of the tree, and compare it to any state, year, race and sex on the right side of the tree chart. The code used in this example was developed as part of the Textile and Apparel Business Information System (TABIS). It is based on the principles presented in Example 17 of the SAS/GRAPH Examples manual. To fully utilize this sample program, users will need to have access to population data stored in a SAS data set called pop using the variables listed below. (For those who do not have access to such data, a data step with sample data is included in Appendix A.) STATE char postal abbr. (eg. 'NC', 'SC', etc.) YEAR numeric (eg. 1990) RACE numeric (eg. 0=all, 1=white, 2=black) SEX numeric (eg. 0=both, 1=male, 2=female) AGE0 numeric (number of people age 0) AGE1 numeric (number of people age 1) AGE98 numeric (number of people age 98) AGE99 numeric (number of people age 99 and over) SAMPLE CODE To facilitate easily selecting the year, state, sex and race for the two sides of the tree chart, the following macro variables are defined. The variables beginning with an "l_" are used for the left side of the tree, and the variables beginning with an "r_" denote values for the right side. %let l_year=1990; %let r_year=2010; %let l_state='us'; %let r_state='us'; %let l_sex=2; %let r_sex=2; %let l_race=0; %let r_race=0; 1
2 The population trees in this example split the population into 20 age groups, each covering a 5 year range. The following SAS SQL code groups the data in this manner, and stores it as G01 G20. The variable names are important since the PROC GCHART's HBAR chart arranges the bars in alphabetical order based on the variable name. G00 is a "dummy" variable used to add extra space at the top of the tree chart. proc sql; create table pop2 as select unique year, state, sex, race, sum( AGE0, AGE1, AGE2, AGE3, AGE4 ) as g20, sum( AGE5, AGE6, AGE7, AGE8, AGE9 ) as g19, sum( AGE10, AGE11, AGE12, AGE13, AGE14 ) as g18, sum( AGE15, AGE16, AGE17, AGE18, AGE19 ) as g17, sum( AGE20, AGE21, AGE22, AGE23, AGE24 ) as g16, sum( AGE25, AGE26, AGE27, AGE28, AGE29 ) as g15, sum( AGE30, AGE31, AGE32, AGE33, AGE34 ) as g14, sum( AGE35, AGE36, AGE37, AGE38, AGE39 ) as g13, sum( AGE40, AGE41, AGE42, AGE43, AGE44 ) as g12, sum( AGE45, AGE46, AGE47, AGE48, AGE49 ) as g11, sum( AGE50, AGE51, AGE52, AGE53, AGE54 ) as g10, sum( AGE55, AGE56, AGE57, AGE58, AGE59 ) as g09, sum( AGE60, AGE61, AGE62, AGE63, AGE64 ) as g08, sum( AGE65, AGE66, AGE67, AGE68, AGE69 ) as g07, sum( AGE70, AGE71, AGE72, AGE73, AGE74 ) as g06, sum( AGE75, AGE76, AGE77, AGE78, AGE79 ) as g05, sum( AGE80, AGE81, AGE82, AGE83, AGE84 ) as g04, sum( AGE85, AGE86, AGE87, AGE88, AGE89 ) as g03, sum( AGE90, AGE91, AGE92, AGE93, AGE94 ) as g02, sum( AGE95, AGE96, AGE97, AGE98, AGE99 ) as g01, 0 as g00 from pop order by year, state, sex, race; quit; proc transpose The data set must next be transposed so that the G00-G20 variable names become values. The following code performs this task, and then converts the population values into millions. proc transpose data=pop2 out=pop2; by year state sex race; proc datasets; modify pop2; rename _name_=age_grp; rename COL1=pop; data pop2; set pop2; pop=pop/ ; The macro variables are used in the "WHERE" clauses of the following SAS SQL queries to select the desired data, and place it into the "left" and "right" data sets. These two data sets are then joined into a data set called "both". Notice that the values in the left data set are negative this forces GCHART to add a zero reference line, and draw the bars for those values to the left of the line. proc sql; create table left as select unique age_grp, year, state, sex, race, (-1*pop) as pop, 'left ' as group from pop2 where (year=&l_year) and (state=&l_state) and (sex=&l_sex) and (race=&l_race); 2
3 create table right as select unique age_grp, year, state, sex, race, pop, 'right' as group from pop2 where (year=&r_year) and (state=&r_state) and (sex=&r_sex) and (race=&r_race); quit; data both; set left right; If you do not have access to Census data, you can use the code in Appendix A instead of the previous code to create a sample "both" data set. The following code prepares several of the visual aspects of the chart to make it more readable. In axis1, the "posval" format forces the labels for the negative values to print as positive values. In axis2, a label for each group is specified. The title2 and title3 statements help document which values were selected for the left and right sides of the tree chart. goptions reset=global gunit=pct rotate=landscape htitle=4 htext=2.5 ftitle=zapfb ftext=zapf cback=white ctext=black colors=(black); proc format; picture posval low-high='000,009'; axis2 label=('in Millions') major=(number=7); axis1 label=none value=( ' Age ' '95+ ' '90-94' '85-89' '80-84' '75-79' '70-74' '65-69' '60-64' '55-59' '50-54' '45-49' '40-44' '35-39' '30-34' '25-29' '20-24' '15-19' '10-14' ' 5-9 ' ' 0-4 ') ; Title1 "Population Distribution"; title2 "Left : state=&l_state race=&l_race sex=&l_sex year=&l_year"; title3 "Right: state=&r_state race=&r_race sex=&r_sex year=&r_year"; The remaining code creates the tree chart: proc gchart data=both; format pop posval.; hbar age_grp / discrete type=sum sumvar=pop nostats space=0 subgroup=group nolegend frame autoref maxis=axis1 raxis=axis2 cframe=white coutline=black caxis=black; EXAMPLES In tree charts, it is customary to have all the values on the left and right be the same, except for the one variable that is being compared. The variable most often compared is sex (male versus female). The following four examples demonstrate that this program can be used to compare many combinations of variables: 3
4 4
5 5
6 APPENDIX A. SAMPLE DATA data both; input age_grp $ year state $ sex race pop group $; cards; G US left G US left G US left G US left G US left G US left G US left G US left G US left G US left G US left G US left G US left G US left G US left G US left G US left G US left G US left G US left G US left G US right G US right G US right G US right G US right G US right G US right G US right G US right G US right G US right G US right G US right G US right G US right G US right G US right G US right G US right G US right G US right ; CONTACT INFORMATION Your comments and questions are valued and encouraged. Contact the author at: Name: Robert Allison Enterprise: SAS Robert.Allison@sas.com SAS and all other SAS Institute Inc. product or service names are registered trademarks or trademarks of SAS Institute Inc. in the USA and other countries. indicates USA registration. 6
The Evolution of a SAS/GRAPH Application Jenine Eason, AutoTrader.com, Atlanta, GA
 Paper P05-04 The Evolution of a SAS/GRAPH Application Jenine Eason, AutoTrader.com, Atlanta, GA INTRODUCTION Graphs are an excellent way to represent any activity. The author is using web server errors
Coders' Corner. Scaling Mount GCHART: Using a MACRO to Dynamically Reset the Scale Nina L. Werner, Dean Health Plan, Inc., Madison, WI.
 Paper 111-25 Scaling Mount GCHART: Using a MACRO to Dynamically Reset the Scale Nina L. Werner, Dean Health Plan, Inc., Madison, WI ABSTRACT If you do not set the scale yourself, PROC GCHART will automatically
The GREMOVE Procedure
 905 CHAPTER 25 The GREMOVE Procedure Overview 905 Concepts 906 About the Input Map Data Set 906 About the Output Map Data Set 907 About Unmatched Area Boundaries 907 Procedure Syntax 908 PROC GREMOVE Statement
A SAS Macro to Generate Caterpillar Plots. Guochen Song, i3 Statprobe, Cary, NC
 PharmaSUG2010 - Paper CC21 A SAS Macro to Generate Caterpillar Plots Guochen Song, i3 Statprobe, Cary, NC ABSTRACT Caterpillar plots are widely used in meta-analysis and it only requires a click in software
The GSLIDE Procedure. Overview. About Text Slides CHAPTER 27
 959 CHAPTER 27 The GSLIDE Procedure Overview 959 About Text Slides 959 About Annotate Output 960 Procedure Syntax 960 PROC GSLIDE Statement 961 Examples 963 Example 1: Producing Text Slides 963 Example
Picturing Statistics Diana Suhr, University of Northern Colorado
 Picturing Statistics Diana Suhr, University of Northern Colorado Abstract Statistical results could be easier to understand if you visualize them. This Hands On Workshop will give you an opportunity to
A Methodology for Truly Dynamic Prompting in SAS Stored Processes
 SESUG 2015 Paper AD-172 A Methodology for Truly Dynamic Prompting in SAS Stored Processes Haikuo Bian, Regions Bank; Carlos Jimenez, Regions Bank; David Maddox, Regions Bank ABSTRACT Dynamic prompts in
Splitting Axis Text. Splitting Text in Axis Tick Mark Values
 CHAPTER 3 Splitting Axis Text Purpose: This chapter describes techniques you can use to split long text into two (or more) lines in your axes. Two techniques are described one to split text in axis tick
Ditch the Data Memo: Using Macro Variables and Outer Union Corresponding in PROC SQL to Create Data Set Summary Tables Andrea Shane MDRC, Oakland, CA
 ABSTRACT Ditch the Data Memo: Using Macro Variables and Outer Union Corresponding in PROC SQL to Create Data Set Summary Tables Andrea Shane MDRC, Oakland, CA Data set documentation is essential to good
Chapter 13 Introduction to Graphics Using SAS/GRAPH (Self-Study)
") Chapter 13 Introduction to Graphics Using SAS/GRAPH (Self-Study) 13.1 Introduction... 2 13.2 Creating Bar and Pie Charts... 8 13.3 Creating Plots... 20 13-2 Chapter 13 Introduction to Graphics Using SAS/GRAPH
Chapter 13 Introduction to Graphics Using SAS/GRAPH (Self-Study) 13.1 Introduction... 2 13.2 Creating Bar and Pie Charts... 8 13.3 Creating Plots... 20 13-2 Chapter 13 Introduction to Graphics Using SAS/GRAPH
ABC Macro and Performance Chart with Benchmarks Annotation
 Paper CC09 ABC Macro and Performance Chart with Benchmarks Annotation Jing Li, AQAF, Birmingham, AL ABSTRACT The achievable benchmark of care (ABC TM ) approach identifies the performance of the top 10%
Creating Regional Maps with Drill-Down Capabilities Deb Cassidy Cardinal Distribution, Dublin, OH
 Creating Regional Maps with Drill-Down Capabilities Deb Cassidy Cardinal Distribution, Dublin, OH ABSTRACT SAS/GRAPH includes many maps which are very useful. But what if you need a map that truly represents
Developing a Dashboard to Aid in Effective Project Management
 Developing a Dashboard to Aid in Effective Project Management M. Paige Borden, University of Central Florida, Orlando, FL Maureen Murray, University of Central Florida, Orlando, FL Ali Yorkos, University
The GANNO Procedure. Overview CHAPTER 12
 503 CHAPTER 12 The GANNO Procedure Overview 503 Procedure Syntax 504 PROC GANNO Statement 504 Examples 507 Example 1: Scaling Data-Dependent Output 507 Example 2: Storing Annotate Graphics 509 Example
Using SAS/GRAPH Software to Create Graphs on the Web Himesh Patel, SAS Institute Inc., Cary, NC Revised by David Caira, SAS Institute Inc.
 Paper 189 Using SAS/GRAPH Software to Create Graphs on the Web Himesh Patel, SAS Institute Inc., Cary, NC Revised by David Caira, SAS Institute Inc., Cary, NC ABSTRACT This paper highlights some ways of
ABC s of Graphs in Version 8 Caroline Bahler, Meridian Software, Inc.
 ABC s of Graphs in Version 8 Caroline Bahler, Meridian Software, Inc. Abstract Version 8 has greatly increased the versatility and usability of graphs that can be created by SAS. This paper will discuss
Usinq the VBAR and BBAR statements and the TEMPLATE Facility to Create side-by-side, Horizontal Bar Charts with Shared Vertical Axes Labels
 Usinq the VBAR and BBAR statements and the TEMPLATE Facility to Create side-by-side, Horizontal Bar Charts with Shared Vertical Axes Labels Lela M. Brown, University of Oklahoma ABSTRACT PRoe GREPLAY's
Creating Maps in SAS/GRAPH
 Creating Maps in SAS/GRAPH By Jeffery D. Gilbert, Trilogy Consulting Corporation, Kalamazoo, MI Abstract This paper will give an introduction to creating graphs using the PROC GMAP procedure in SAS/GRAPH.
Maintaining a 'Look and Feel' throughout a Reporting Package Created with Diverse SAS Products Barbara B Okerson, Anthem, Inc.
 Paper 44-2015 Maintaining a 'Look and Feel' throughout a Reporting Package Created with Diverse SAS Products Barbara B Okerson, Anthem, Inc. ABSTRACT SAS provides a number of tools for creating customized
How to annotate graphics
 Paper TU05 How to annotate graphics Sandrine STEPIEN, Quintiles, Strasbourg, France ABSTRACT Graphs can be annotated using different functions that add graphics elements to the output. Amongst other things,
Trend Reporting Using the MXG Trend Performance Database
 Paper PT-04-2013 Trend Reporting Using the MXG Trend Performance Database Neal Musitano Jr. U. S. Department of Veterans Affairs, Information Technology Center Philadelphia, Pennsylvania ABSTRACT This
Super boost data transpose puzzle
 Paper 2100-2016 Super boost data transpose puzzle Ahmed Al-Attar, AnA Data Warehousing Consulting LLC, McLean, VA ABSTRACT This paper compares different solutions to a data transpose puzzle presented to
Creating Forest Plots Using SAS/GRAPH and the Annotate Facility
 PharmaSUG2011 Paper TT12 Creating Forest Plots Using SAS/GRAPH and the Annotate Facility Amanda Tweed, Millennium: The Takeda Oncology Company, Cambridge, MA ABSTRACT Forest plots have become common in
It s Not All Relative: SAS/Graph Annotate Coordinate Systems
 Paper TU05 It s Not All Relative: SAS/Graph Annotate Coordinate Systems Rick Edwards, PPD Inc, Wilmington, NC ABSTRACT This paper discusses the SAS/Graph Annotation coordinate systems and how a combination
Figure 1. Paper Ring Charts. David Corliss, Marketing Associates, Bloomfield Hills, MI
 Paper 16828 Ring Charts David Corliss, Marketing Associates, Bloomfield Hills, MI Abstract Ring Charts are presented as a new, graphical technique for analyzing complex relationships between tables in
Purpose: This chapter demonstrates how to create pie charts, and discusses some of the issues to consider when deciding whether to use a pie chart.
 CHAPTER 4 Pie Charts Purpose: This chapter demonstrates how to create pie charts, and discusses some of the issues to consider when deciding whether to use a pie chart. Simple Pie Most people get the concept
The GIMPORT Procedure
 705 CHAPTER 17 The GIMPORT Procedure Overview 705 Concepts 706 About Importing Graphics 706 Specifying a Fileref 706 Importing the File 706 CGM Elements Not Supported 707 About Color Mapping 707 About
%MAKE_IT_COUNT: An Example Macro for Dynamic Table Programming Britney Gilbert, Juniper Tree Consulting, Porter, Oklahoma
 Britney Gilbert, Juniper Tree Consulting, Porter, Oklahoma ABSTRACT Today there is more pressure on programmers to deliver summary outputs faster without sacrificing quality. By using just a few programming
Six Cool Things You Can Do In Display Manager Jenine Milum, Charlotte, NC Wachovia Bank
 Paper CC-029 Six Cool Things You Can Do In Display Manager Jenine Milum, Charlotte, NC Wachovia Bank ABSTRACT Many people use Display Manager but don t realize how much work it can actually do for you.
CREATING DRILL-DOWN GRAPHS USING SAS/GRAPH AND THE OUTPUT DELIVERY SYSTEM Curtis A. Smith, Defense Contract Audit Agency, La Mirada, CA.
 CREATING DRILL-DOWN GRAPHS USING SAS/GRAPH AND THE OUTPUT DELIVERY SYSTEM Curtis A. Smith, Defense Contract Audit Agency, La Mirada, CA. ABSTRACT Using the SAS/Graph procedures and the Output Delivery
Coders' Corner. Paper ABSTRACT GLOBAL STATEMENTS INTRODUCTION
 Paper 70-26 Data Visualization of Outliers from a Health Research Perspective Using SAS/GRAPH and the Annotate Facility Nadia Redmond Kaiser Permanente Center for Health Research, Portland, Oregon ABSTRACT
Easing into Data Exploration, Reporting, and Analytics Using SAS Enterprise Guide
 Paper 809-2017 Easing into Data Exploration, Reporting, and Analytics Using SAS Enterprise Guide ABSTRACT Marje Fecht, Prowerk Consulting Whether you have been programming in SAS for years, are new to
Tips to Customize SAS/GRAPH... for Reluctant Beginners et al. Claudine Lougee, Dualenic, LLC, Glen Allen, VA
 Paper SIB-109 Tips to Customize SAS/GRAPH... for Reluctant Beginners et al. Claudine Lougee, Dualenic, LLC, Glen Allen, VA ABSTRACT SAS graphs do not have to be difficult or created by SAS/GRAPH experts.
Archer R. Gravely, UNC Asheville, Asheville, NC
 Achieving Graphical Excellence With SAS/GRAPH Software Archer R. Gravely, UNC Asheville, Asheville, NC Abstract This paper will integrate Tufte s (1983) principles of graphical excellence with the use
The Power of Combining Data with the PROC SQL
 ABSTRACT Paper CC-09 The Power of Combining Data with the PROC SQL Stacey Slone, University of Kentucky Markey Cancer Center Combining two data sets which contain a common identifier with a MERGE statement
The G3GRID Procedure. Overview CHAPTER 30
 1007 CHAPTER 30 The G3GRID Procedure Overview 1007 Concepts 1009 About the Input Data Set 1009 Multiple Vertical Variables 1009 Horizontal Variables Along a Nonlinear Curve 1009 About the Output Data Set
Contents of SAS Programming Techniques
 Contents of SAS Programming Techniques Chapter 1 About SAS 1.1 Introduction 1.1.1 SAS modules 1.1.2 SAS module classification 1.1.3 SAS features 1.1.4 Three levels of SAS techniques 1.1.5 Chapter goal
OS/390 DASD I/O Drill Down Computer Performance Chart Using ODS SAS/GRAPH & MXG Software
 Paper 216-27 OS/390 DASD I/O Drill Down Computer Performance Chart Using ODS SAS/GRAPH & MXG Software Neal Musitano Jr. Department of Veterans Affairs Information Technology Center Philadelphia, Pennsylvania
Time Contour Plots. David J. Corliss Magnify Analytic Solutions, Detroit, MI
 Time Contour Plots David J. Corliss Magnify Analytic Solutions, Detroit, MI ABSTRACT This new SAS tool is two-dimensional color chart for visualizing changes in a population or system over time. Data for
Paper Time Contour Plots. David J. Corliss, Wayne State University / Physics and Astronomy
 ABSTRACT Paper 1311-2014 Time Contour Plots David J. Corliss, Wayne State University / Physics and Astronomy This new SAS tool is two-dimensional color chart for visualizing changes in a population or
Leveraging SAS Visualization Technologies to Increase the Global Competency of the U.S. Workforce
 Paper SAS216-2014 Leveraging SAS Visualization Technologies to Increase the Global Competency of the U.S. Workforce Jim Bauer, SAS Institute Inc., Cary, NC ABSTRACT U.S. educators face a critical new imperative:
A Practical Introduction to SAS Data Integration Studio
 ABSTRACT A Practical Introduction to SAS Data Integration Studio Erik Larsen, Independent Consultant, Charleston, SC Frank Ferriola, Financial Risk Group, Cary, NC A useful and often overlooked tool which
Data Explore Matrix Quality Control by Exploring and Mining Data in Clinical Study
 PharmaSUG China 2017 - Paper 34 Data Explore Matrix Quality Control by Exploring and Mining Data in Clinical Study Yongxu Tang, Merck, Beijing, China Yu Meng, Merck, Beijing, China Yongjian Zhou, Merck,
Clinical Data Visualization using TIBCO Spotfire and SAS
 ABSTRACT SESUG Paper RIV107-2017 Clinical Data Visualization using TIBCO Spotfire and SAS Ajay Gupta, PPD, Morrisville, USA In Pharmaceuticals/CRO industries, you may receive requests from stakeholders
SAS CLINICAL SYLLABUS. DURATION: - 60 Hours
 SAS CLINICAL SYLLABUS DURATION: - 60 Hours BASE SAS PART - I Introduction To Sas System & Architecture History And Various Modules Features Variables & Sas Syntax Rules Sas Data Sets Data Set Options Operators
What s New in SAS Studio?
 ABSTRACT Paper SAS1832-2015 What s New in SAS Studio? Mike Porter, Amy Peters, and Michael Monaco, SAS Institute Inc., Cary, NC If you have not had a chance to explore SAS Studio yet, or if you re anxious
Innovative Graph for Comparing Central Tendencies and Spread at a Glance
 Paper 140-28 Innovative Graph for Comparing Central Tendencies and Spread at a Glance Varsha C. Shah, CSCC, Dept. of Biostatistics, UNC-CH, Chapel Hill, NC Ravi M. Mathew, CSCC,Dept. of Biostatistics,
CMISS the SAS Function You May Have Been MISSING Mira Shapiro, Analytic Designers LLC, Bethesda, MD
 ABSTRACT SESUG 2016 - RV-201 CMISS the SAS Function You May Have Been MISSING Mira Shapiro, Analytic Designers LLC, Bethesda, MD Those of us who have been using SAS for more than a few years often rely
SAS Graphics & Code. stat 480 Heike Hofmann
 SAS Graphics & Code stat 480 Heike Hofmann Outline Data Exploration in SAS Data Management Subsetting Graphics Code in SAS Your turn Download FBI crime data fbi-crime-60-11.csv from the website, open in
FILLPATTERNS in SGPLOT Graphs Pankhil Shah, PPD, Morrisville, NC
 PharmaSUG 2015 - Paper QT30 FILLPATTERNS in SGPLOT Graphs Pankhil Shah, PPD, Morrisville, NC ABSTRACT With more updates to PROC SGPLOT in SAS 9.3, there has been a substantial change in graph programming.
100 THE NUANCES OF COMBINING MULTIPLE HOSPITAL DATA
 Paper 100 THE NUANCES OF COMBINING MULTIPLE HOSPITAL DATA Jontae Sanders, MPH, Charlotte Baker, DrPH, MPH, CPH, and C. Perry Brown, DrPH, MSPH, Florida Agricultural and Mechanical University ABSTRACT Hospital
The Basics of Map Creation with SAS/GRAPH. Mike Zdeb School of Public Health Rensselaer, NY
 The Basics of Map Creation with SAS/GRAPH Mike Zdeb University@Albany School of Public Health Rensselaer, NY # MAP CREATION WITH SAS SAS/GRAPH (PROC GMAP) SAS/GIS # PROC GMAP - FOUR TYPES OF MAPS CHOROPLETH
SUGI 29 Posters. Paper A Group Scatter Plot with Clustering Xiaoli Hu, Wyeth Consumer Healthcare., Madison, NJ
 Paper 146-29 A Group Scatter Plot with Clustering Xiaoli Hu, Wyeth Consumer Healthcare., Madison, NJ ABSTRACT In pharmacokinetic studies, abnormally high values of maximum plasma concentration Cmax of
Give me EVERYTHING! A macro to combine the CONTENTS procedure output and formats. Lynn Mullins, PPD, Cincinnati, Ohio
 PharmaSUG 2014 - Paper CC43 Give me EVERYTHING! A macro to combine the CONTENTS procedure output and formats. Lynn Mullins, PPD, Cincinnati, Ohio ABSTRACT The PROC CONTENTS output displays SAS data set
A Dynamic Imagemap Generator Carol Martell, Highway Safety Research Center, Chapel Hill, NC
 A Dynamic Imagemap Generator Carol Martell, Highway Safety Research Center, Chapel Hill, NC ABSTRACT We learned that our web developers were turning a picture of the state of North Carolina with its one
NEW FEATURES IN FOUNDATION SAS 9.4 CYNTHIA JOHNSON CUSTOMER LOYALTY
 NEW FEATURES IN FOUNDATION SAS 9.4 CYNTHIA JOHNSON CUSTOMER LOYALTY FOUNDATION SAS WHAT S NEW IN 9.4 Agenda Base SAS SAS/ACCESS Interface to PC Files SAS Support for Hadoop SAS/GRAPH SAS Studio BASE SAS
Paper TS05. NOTE: To keep the paper compact, screen images have usually been clipped to show only the essential parts of the displayed result.
 Paper TS05 Getting Started with, and Getting the Most out of, SAS ODS PDF: No Mastery of PROC TEMPLATE Required LeRoy Bessler, Assurant Health, Milwaukee, USA, bessler@execpc.com Abstract Adobe's Portable
ABSTRACT INTRODUCTION
 Iterative Proportional Fitting and Population Dynamics using SAS Himanshu Joshi, Houston-Galveston Area Council, Houston, TX Dmitry Messen, Houston-Galveston Area Council, Houston, TX ABSTRACT For doing
Canadian National Longitudinal Survey of Children and Youth (NLSCY)
") Canadian National Longitudinal Survey of Children and Youth (NLSCY) Fathom workshop activity For more information about the survey, see: http://www.statcan.ca/ Daily/English/990706/ d990706a.htm Notice
Canadian National Longitudinal Survey of Children and Youth (NLSCY) Fathom workshop activity For more information about the survey, see: http://www.statcan.ca/ Daily/English/990706/ d990706a.htm Notice
Fly over, drill down, and explore
 ABSTRACT Paper 79-2013 Fly over, drill down, and explore Suzanne Brown, HealthInsight New Mexico, Albuquerque, NM Data often have a spatial dimension, whether it is a five-year financial plan and annual
From Manual to Automatic with Overdrive - Using SAS to Automate Report Generation Faron Kincheloe, Baylor University, Waco, TX
 Paper 152-27 From Manual to Automatic with Overdrive - Using SAS to Automate Report Generation Faron Kincheloe, Baylor University, Waco, TX ABSTRACT This paper is a case study of how SAS products were
PDQ-Notes. Reynolds Farley. PDQ-Note 3 Displaying Your Results in the Expert Query Window
 PDQ-Notes Reynolds Farley PDQ-Note 3 Displaying Your Results in the Expert Query Window PDQ-Note 3 Displaying Your Results in the Expert Query Window Most of your options for configuring your query results
PharmaSUG 2013 CC26 Automating the Labeling of X- Axis Sanjiv Ramalingam, Vertex Pharmaceuticals, Inc., Cambridge, MA
 PharmaSUG 2013 CC26 Automating the Labeling of X- Axis Sanjiv Ramalingam, Vertex Pharmaceuticals, Inc., Cambridge, MA ABSTRACT Labeling of the X-axis usually involves a tedious axis statement specifying
ERROR: ERROR: ERROR:
 ERROR: ERROR: ERROR: Formatting Variables: Back and forth between character and numeric Why should you care? DATA name1; SET name; if var = Three then delete; if var = 3 the en delete; if var = 3 then
Converting Annotate to ODS Graphics. Is It Possible?
 ABSTRACT Paper 2686-2015 Converting Annotate to ODS Graphics. Is It Possible? Philip R Holland, Holland Numerics Limited In the previous chapter I described how many standard SAS/GRAPH plots can be converted
Quality Control of Clinical Data Listings with Proc Compare
 ABSTRACT Quality Control of Clinical Data Listings with Proc Compare Robert Bikwemu, Pharmapace, Inc., San Diego, CA Nicole Wallstedt, Pharmapace, Inc., San Diego, CA Checking clinical data listings with
Ready To Become Really Productive Using PROC SQL? Sunil K. Gupta, Gupta Programming, Simi Valley, CA
 PharmaSUG 2012 - Paper HW04 Ready To Become Really Productive Using PROC SQL? Sunil K. Gupta, Gupta Programming, Simi Valley, CA ABSTRACT Using PROC SQL, can you identify at least four ways to: select
Setting the Percentage in PROC TABULATE
 SESUG Paper 193-2017 Setting the Percentage in PROC TABULATE David Franklin, QuintilesIMS, Cambridge, MA ABSTRACT PROC TABULATE is a very powerful procedure which can do statistics and frequency counts
Using SAS/GRAPH Software to Analyze Student Study Habits. Bill Wallace Computing Services University of Saskatchewan
 Using SAS/GRAPH Software to Analyze Student Study Habits Bill Wallace Computing Services University of Saskatchewan Abstract This paper describes the steps taken to create unusual vertical bar charts for
Taming a Spreadsheet Importation Monster
 SESUG 2013 Paper BtB-10 Taming a Spreadsheet Importation Monster Nat Wooding, J. Sargeant Reynolds Community College ABSTRACT As many programmers have learned to their chagrin, it can be easy to read Excel
%Addval: A SAS Macro Which Completes the Cartesian Product of Dataset Observations for All Values of a Selected Set of Variables
 %Addval: A SAS Macro Which Completes the Cartesian Product of Dataset Observations for All Values of a Selected Set of Variables Rich Schiefelbein, PRA International, Lenexa, KS ABSTRACT It is often useful
Breaking up (Axes) Isn t Hard to Do: An Updated Macro for Choosing Axis Breaks
 Isn t Hard to Do: An Updated Macro for Choosing Axis Breaks") SESUG 2016 Paper AD-190 Breaking up (Axes) Isn t Hard to Do: An Updated Macro for Choosing Axis Breaks Alex Buck, Rho ABSTRACT This SAS 9.4 brought some wonderful new graphics options. One of the most
SESUG 2016 Paper AD-190 Breaking up (Axes) Isn t Hard to Do: An Updated Macro for Choosing Axis Breaks Alex Buck, Rho ABSTRACT This SAS 9.4 brought some wonderful new graphics options. One of the most
SESUG 2014 IT-82 SAS-Enterprise Guide for Institutional Research and Other Data Scientists Claudia W. McCann, East Carolina University.
 Abstract Data requests can range from on-the-fly, need it yesterday, to extended projects taking several weeks or months to complete. Often institutional researchers and other data scientists are juggling
Programming Gems that are worth learning SQL for! Pamela L. Reading, Rho, Inc., Chapel Hill, NC
 Paper CC-05 Programming Gems that are worth learning SQL for! Pamela L. Reading, Rho, Inc., Chapel Hill, NC ABSTRACT For many SAS users, learning SQL syntax appears to be a significant effort with a low
IPUMS Training and Development: Requesting Data
 IPUMS Training and Development: Requesting Data IPUMS PMA Exercise 2 OBJECTIVE: Gain an understanding of how IPUMS PMA service delivery point datasets are structured and how it can be leveraged to explore
OLAP Drill-through Table Considerations
 Paper 023-2014 OLAP Drill-through Table Considerations M. Michelle Buchecker, SAS Institute, Inc. ABSTRACT When creating an OLAP cube, you have the option of specifying a drill-through table, also known
Using Big Data to Visualize People Movement Using SAS Basics
 ABSTRACT MWSUG 2016 - Paper DV09 Using Big Data to Visualize People Movement Using SAS Basics Stephanie R. Thompson, Rochester Institute of Technology, Rochester, NY Visualizing the movement of people
How to extract suicide statistics by country from the. WHO Mortality Database Online Tool
 Instructions for users How to extract suicide statistics by country from the WHO Mortality Database Online Tool This guide explains how to access suicide statistics and make graphs and tables, or export
Chapters 18, 19, 20 Solutions. Page 1 of 14. Demographics from COLLEGE Data Set
 18.2 proc tabulate data=learn.college format=7.; class schoolsize gender scholarship; table schoolsize ALL, gender scholarship ALL; n = ' '; Demographics from COLLEGE Data Set ƒƒƒƒƒƒƒƒƒƒƒƒƒƒƒƒƒƒƒƒƒ ƒƒƒƒƒƒƒƒƒƒƒƒƒƒƒ
APPENDIX 4 Migrating from QMF to SAS/ ASSIST Software. Each of these steps can be executed independently.
 255 APPENDIX 4 Migrating from QMF to SAS/ ASSIST Software Introduction 255 Generating a QMF Export Procedure 255 Exporting Queries from QMF 257 Importing QMF Queries into Query and Reporting 257 Alternate
29 Shades of Missing
 SESUG 2015 ABSTRACT Paper CC106 29 Shades of Missing Darryl Putnam, Pinnacle Solutions, LLC Missing values can have many flavors of missingness in your data and understanding these flavors of missingness
Want Quick Results? An Introduction to SAS/GRAPH Software. Arthur L. Carpenter California Occidental Consultants
 Want Quick Results? An Introduction to SAS/GRAPH Software Arthur L. arpenter alifornia Occidental onsultants KEY WORDS GOPTIONS, GPLOT, GHART, SYMBOL, AXIS, TITLE, FOOTNOTE ABSTRAT SAS/GRAPH software contains
INTRODUCTION TO THE SAS ANNOTATE FACILITY
 Improving Your Graphics Using SAS/GRAPH Annotate Facility David J. Pasta, Ovation Research Group, San Francisco, CA David Mink, Ovation Research Group, San Francisco, CA ABSTRACT Have you ever created
Something for Nothing! Converting Plots from SAS/GRAPH to ODS Graphics
 ABSTRACT Paper 1610-2014 Something for Nothing! Converting Plots from SAS/GRAPH to ODS Graphics Philip R Holland, Holland Numerics Limited, UK All the documentation about the creation of graphs with SAS
Customized Flowcharts Using SAS Annotation Abhinav Srivastva, PaxVax Inc., Redwood City, CA
 ABSTRACT Customized Flowcharts Using SAS Annotation Abhinav Srivastva, PaxVax Inc., Redwood City, CA Data visualization is becoming a trend in all sectors where critical business decisions or assessments
I KNOW HOW TO PROGRAM IN SAS HOW DO I NAVIGATE SAS ENTERPRISE GUIDE?
 Paper HOW-068 A SAS Programmer s Guide to the SAS Enterprise Guide Marje Fecht, Prowerk Consulting LLC, Cape Coral, FL Rupinder Dhillon, Dhillon Consulting Inc., Toronto, ON, Canada ABSTRACT You have been
Teaching statistics and the SAS System
 Teaching statistics and the SAS System Ass. Prof. Dipl.Ing. Dr. Barbara Schneider Institute for Medical Statistics, University of Vienna,Vienna, Austria Abstract This presentation offers ideas and examples
Using MACRO and SAS/GRAPH to Efficiently Assess Distributions. Paul Walker, Capital One
 Using MACRO and SAS/GRAPH to Efficiently Assess Distributions Paul Walker, Capital One INTRODUCTION A common task in data analysis is assessing the distribution of variables by means of univariate statistics,
CIP (International Potato Center, part of the Consultative Group on International Agricultural Research)
") Wow! You Did That Map with SAS/GRAPH? Louise S. Hadden, Abt Associates Inc., Cambridge, MA Mike Zdeb, University@Albany School of Public Health, Rensselaer, NY Robert Allison, SAS Institute Inc., Cary,
Wow! You Did That Map with SAS/GRAPH? Louise S. Hadden, Abt Associates Inc., Cambridge, MA Mike Zdeb, University@Albany School of Public Health, Rensselaer, NY Robert Allison, SAS Institute Inc., Cary,
A Plot & a Table per Page Times Hundreds in a Single PDF file
 A Plot & a Table per Page Times Hundreds in a Single PDF file Daniel Leprince DIEM Computing Services, Inc. Elizabeth Li DIEM Computing Services, Inc. SAS is a registered trademark or trademark of SAS
SAS/Warehouse Administrator Usage and Enhancements Terry Lewis, SAS Institute Inc., Cary, NC
 SAS/Warehouse Administrator Usage and Enhancements Terry Lewis, SAS Institute Inc., Cary, NC ABSTRACT SAS/Warehouse Administrator software makes it easier to build, maintain, and access data warehouses
Mapping Clinical Data to a Standard Structure: A Table Driven Approach
 ABSTRACT Paper AD15 Mapping Clinical Data to a Standard Structure: A Table Driven Approach Nancy Brucken, i3 Statprobe, Ann Arbor, MI Paul Slagle, i3 Statprobe, Ann Arbor, MI Clinical Research Organizations
PharmaSUG China. Systematically Reordering Axis Major Tick Values in SAS Graph Brian Shen, PPDI, ShangHai
 PharmaSUG China Systematically Reordering Axis Major Tick Values in SAS Graph Brian Shen, PPDI, ShangHai ABSTRACT Once generating SAS graphs, it is a headache to programmers to reorder the axis tick values
PREREQUISITES FOR EXAMPLES
 212-2007 SAS Information Map Studio and SAS Web Report Studio A Tutorial Angela Hall, Zencos Consulting LLC, Durham, NC Brian Miles, Zencos Consulting LLC, Durham, NC ABSTRACT Find out how to provide the
PROC REPORT Basics: Getting Started with the Primary Statements
 Paper HOW07 PROC REPORT Basics: Getting Started with the Primary Statements Arthur L. Carpenter California Occidental Consultants, Oceanside, California ABSTRACT The presentation of data is an essential
Multiple Graphical and Tabular Reports on One Page, Multiple Ways to Do It Niraj J Pandya, CT, USA
 Paper TT11 Multiple Graphical and Tabular Reports on One Page, Multiple Ways to Do It Niraj J Pandya, CT, USA ABSTRACT Creating different kind of reports for the presentation of same data sounds a normal
Paper # Jazz it up a Little with Formats. Brian Bee, The Knowledge Warehouse Ltd
 Paper #1495-2014 Jazz it up a Little with Formats Brian Bee, The Knowledge Warehouse Ltd Abstract Formats are an often under-valued tool in the SAS toolbox. They can be used in just about all domains to
ABSTRACT. This paper will focus on two of these pieces: ODS (Output Delivery System) SASlIntrNet
 SASlIntrNet") LEVERAGING YOUR MAINFRAME INVESTMENT: WEB Enable your Mainframe Applications using New Features of Versions 7 and 8. Kevin Bestelmeyer, David Crow, and Denise Poll, SAS Institute Inc., Cary, NC ABSTRACT
LEVERAGING YOUR MAINFRAME INVESTMENT: WEB Enable your Mainframe Applications using New Features of Versions 7 and 8. Kevin Bestelmeyer, David Crow, and Denise Poll, SAS Institute Inc., Cary, NC ABSTRACT
SAS/GRAPH : Using the Annotate Facility
 SAS/GRAPH : Using the Annotate Facility Jack S. Nyberg, ClinTrials Research, Inc., Lexington, KY. Stuart D. Nichols, ClinTrials Research, Inc., Lexington, KY. ABSTRACT The annotate facility in SAS/GRAPH
Getting Up to Speed with PROC REPORT Kimberly LeBouton, K.J.L. Computing, Rossmoor, CA
 SESUG 2012 Paper HW-01 Getting Up to Speed with PROC REPORT Kimberly LeBouton, K.J.L. Computing, Rossmoor, CA ABSTRACT Learning the basics of PROC REPORT can help the new SAS user avoid hours of headaches.