Profiling & Optimization
|
|
|
- Brittany Knight
- 6 years ago
- Views:
Transcription
1 Lecture 11
2 Sources of Game Performance Issues? 2
3 Avoid Premature Optimization Novice developers rely on ad hoc optimization Make private data public Force function inlining Decrease code modularity removes function calls But this is a very bad idea Rarely gives significant performance benefits Non-modular code is very hard to maintain Write clean code first; optimize later 3
4 Performance Tuning Code follows an 80/20 rule (or even 90/10) 80% of run-time spent in 20% of code Optimizing or 80% provides little benefit Do nothing until you know what this 20% is Be careful in tuning performance Never overtune some inputs at expense of ors Always focus on overall algorithm first Think hard before making non-modular changes 4
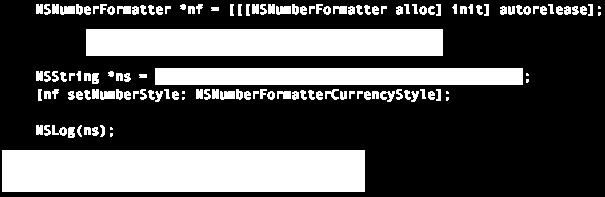
5 What Can We Measure? Time Performance What code takes most time What is called most often How long I/O takes to finish Time to switch threads Time threads hold locks Time threads wait for locks Memory Performance Number of heap allocations Location of allocations Timing of allocations Location of releases Timing of releases (Location of memory leaks) 5

6 Static Analysis Analyze without running Relies on language features Major area of PL research Advantages Offline; no performance hit Can analyze deep properties Disadvantages Conservative; misses a lot Cannot capture user input Analysis Methods 6

7 Analysis Methods Profiling Analysis runs with program Record behavior of program Helps visualize this record Advantages More data than static anal. Can capture user input Disadvantages Hurts performance a lot May alter program behavior 7
8 Analysis Methods Static Analysis Analyze without running Relies on language features Major area of PL research Advantages Offline; no performance hit Can analyze deep properties Disadvantages Conservative; misses a lot Cannot capture user input Profiling Analysis runs with program Record behavior of program Helps visualize this record Advantages More data than static anal. Can capture user input Disadvantages Hurts performance a lot May alter program behavior 8
9 Static Analysis: Control Flow int sum = 0" boolean done = false;" for(int ii; ii<=5 &&!done;) {" }}" if (j >= 0) {" sum += j;" if (sum > 100) {" done = true;" } else {" }" i = i+1;" print(sum); p q q may be executed immediately after p F sum = 0 done = F i = 0 i <= 5 &&!done F T j >= 0 sum = sum + j sum > 100 done = T i = i+1 T endif print sum F T 9
 {\" }}\" if (j >= 0) {\" sum += j;\" if (sum > 100) {\" done = true;\" } else {\" }\" i = i+1;\" print(sum); p q Value assigned at p is read at command q sum = 0 done = F i =")
10 Static Analysis: Flow Dependence int sum = 0" boolean done = false;" for(int ii; ii<=5 &&!done;) {" }}" if (j >= 0) {" sum += j;" if (sum > 100) {" done = true;" } else {" }" i = i+1;" print(sum); p q Value assigned at p is read at command q sum = 0 done = F i = 0 i <= 5 &&!done j >= 0 sum = sum + j sum > 100 done = T i = i+1 endif print sum 10

11 Model Checking Given a graph, logical formula ϕ ϕ expresses properties of graph Checker determines if is true Often applied to software Program as control-flow graph ϕ indicates acceptable paths F sum = 0 done = F i = 0 i <= 5 &&!done F T j >= 0 sum = sum + j sum > 100 done = T i = i+1 T endif print sum F T 11

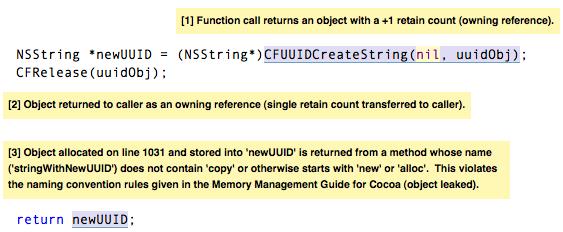
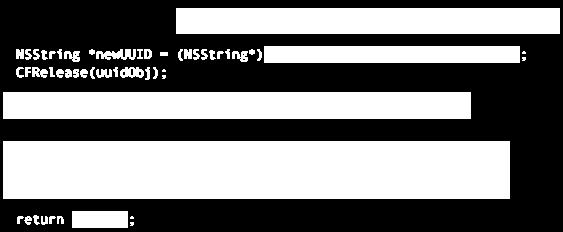
12 Static Analysis: Applications Pointer analysis Look at pointer variables Determine possible values for variable at each place Can find memory leaks Deadlock detection Locks are flow dependency Determine possible owners of lock at each position Dead code analysis Heap X p 12

13 Example: Clang for iphone 13

14 Time Profiling 14
15 Time Profiling: Methods Software Code added to program Captures start of function Captures end of function Subtract to get time spent Calculate percentage at end Not completely accurate Changes actual program Also, how get time? Hardware Measurements in hardware Feature attached to CPU Does not change how program is run Simulate w/ hypervisors Virtual machine for Oss VM includes profiling measurement features Example: Xen Hypervisor 15
16 Time Profiling: Methods Time-Sampling Count at periodic intervals Wakes up from sleep Looks at parent function Adds that to count Relatively lower overhead Doesn t count everything Performance hit acceptable May miss small functions Instrumentation Count pre-specified places Specific function calls Hardware interrupts Different from sampling Still not getting everything But exact view of slice Used for targeted searches 16
17 Issues with Periodic Sampling Real Sampled 17


18 Issues with Periodic Sampling Real Sampled Modern profilers fix with random sampling 18
19 What Can We Measure? Time Performance What code takes most time What is called most often How long I/O takes to finish Time to switch threads Time threads hold locks Time threads wait for locks Memory Performance Number of heap allocations Location of allocations Timing of allocations Location of releases Timing of releases (Location of memory leaks)

20 What Can We Measure? Instrument? Time Performance What code takes most time What is called most often How long I/O takes to finish Time to switch threads Time threads hold locks Time threads wait for locks Memory Performance Number of heap allocations Location of allocations Timing of allocations Location of releases Timing of releases (Location of memory leaks) 20

21 Instrumentation: Memory Memory handled by malloc Basic C allocation method C++ new uses malloc Allocates raw bytes malloc can be instrumented Count number of mallocs Track malloc addresses Look for frees later on Finds memory leaks! p1 = malloc(4) p2 = malloc(5) p3 = malloc(6) free(p2) 21
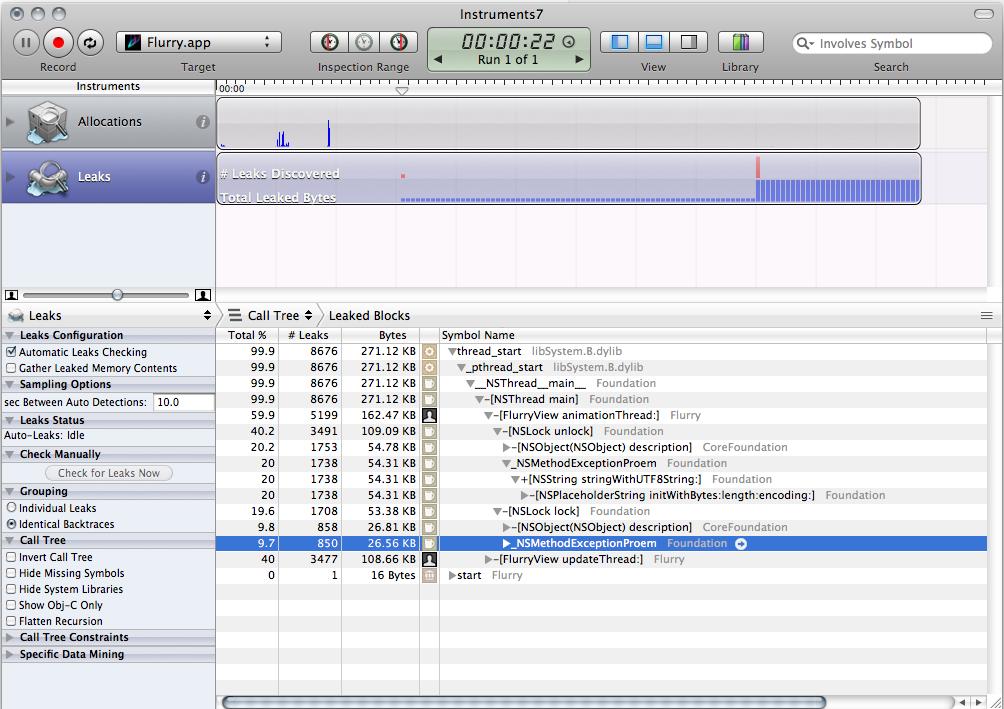
22 Instrumentation: Memory 22
23 Profiling Tools General Java VisualVM (Built-in profiler from Sun/Oracle) Eclipse Test & Performance Tools Platform (TPTP) Android Dalvik Debug Monitor Server (DDMS) for traces TraceView helps visualize results of DDMS ios/x-code Instruments (wide variety of special tools) GNU gprof for sampled time profiling 23
; // Profiled code")
; // Non-profiled code")
24 Android Profiling // Non-profiled code Debug.startMethodTracing("profile"); // Profiled code Debug.stopMethodTracing(); // Non-profiled code captures everything Android App profile.trace Traceview 24

25 Android Profiling 25
26 Poor Man s Sampling Call Graph Create a hashtable Keys = pairs (a calls b) Values = time (time spent) Place code around call Code inside outer func. a Code before & after call b Records start and end time Put difference in hashtable Timing Use processor s timer Track time used by program System dependent function Java: System.nanoTime() Do not use wall clock Timer for whole system Includes or programs Java version: System.currentTimeMillis() 26
27 Poor Man s Sampling Call Graph Timing Create a hashtable Keys = pairs (a calls b) Values = time (time spent) Place code around call Code inside outer func. a Code before & after call b Records start and end time Put difference in hashtable Use processor s timer Track time used by program System dependent function Java: System.nanoTime() Do not use wall clock Useful in networked setting Timer for whole system Includes or programs Java version: System.currentTimeMillis() 27
28 Summary Premature optimization is bad Make code unmanageable for little gain Best to identify bottlenecks first Static analysis is useful in some cases Finding memory leaks and or issues Deadlock and resource analysis Profiling can find runtime performance issues But changes program and incurs overhead Sampling and instrumentation reduce overhead 28
Profiling & Optimization
 Lecture 18 Sources of Game Performance Issues? 2 Avoid Premature Optimization Novice developers rely on ad hoc optimization Make private data public Force function inlining Decrease code modularity removes
Optimizing Your Android Applications
 Optimizing Your Android Applications Alexander Nelson November 27th, 2017 University of Arkansas - Department of Computer Science and Computer Engineering The Problem Reminder Immediacy and responsiveness
Vertical Profiling: Understanding the Behavior of Object-Oriented Applications
 Vertical Profiling: Understanding the Behavior of Object-Oriented Applications Matthias Hauswirth, Amer Diwan University of Colorado at Boulder Peter F. Sweeney, Michael Hind IBM Thomas J. Watson Research
CSE 403 Lecture 18. Performance Testing. Reading: Code Complete, Ch (McConnell) slides created by Marty Stepp
 slides created by Marty Stepp") CSE 403 Lecture 18 Performance Testing Reading: Code Complete, Ch. 25-26 (McConnell) slides created by Marty Stepp http://www.cs.washington.edu/403/ Acceptance, performance acceptance testing: System is
CSE 403 Lecture 18 Performance Testing Reading: Code Complete, Ch. 25-26 (McConnell) slides created by Marty Stepp http://www.cs.washington.edu/403/ Acceptance, performance acceptance testing: System is
JAVA PERFORMANCE. PR SW2 S18 Dr. Prähofer DI Leopoldseder
 JAVA PERFORMANCE PR SW2 S18 Dr. Prähofer DI Leopoldseder OUTLINE 1. What is performance? 1. Benchmarking 2. What is Java performance? 1. Interpreter vs JIT 3. Tools to measure performance 4. Memory Performance
Using Intel VTune Amplifier XE and Inspector XE in.net environment
 Using Intel VTune Amplifier XE and Inspector XE in.net environment Levent Akyil Technical Computing, Analyzers and Runtime Software and Services group 1 Refresher - Intel VTune Amplifier XE Intel Inspector
Low level security. Andrew Ruef
 Low level security Andrew Ruef What s going on Stuff is getting hacked all the time We re writing tons of software Often with little regard to reliability let alone security The regulatory environment
Lecture 9 Dynamic Compilation
 Lecture 9 Dynamic Compilation I. Motivation & Background II. Overview III. Compilation Policy IV. Partial Method Compilation V. Partial Dead Code Elimination VI. Escape Analysis VII. Results Partial Method
CSE 120 Principles of Operating Systems
 CSE 120 Principles of Operating Systems Spring 2018 Lecture 15: Multicore Geoffrey M. Voelker Multicore Operating Systems We have generally discussed operating systems concepts independent of the number
Operating Systems Design Fall 2010 Exam 1 Review. Paul Krzyzanowski
 Operating Systems Design Fall 2010 Exam 1 Review Paul Krzyzanowski pxk@cs.rutgers.edu 1 Question 1 To a programmer, a system call looks just like a function call. Explain the difference in the underlying
Running class Timing on Java HotSpot VM, 1
 Compiler construction 2009 Lecture 3. A first look at optimization: Peephole optimization. A simple example A Java class public class A { public static int f (int x) { int r = 3; int s = r + 5; return
Chapter 2: Operating-System Structures. Operating System Concepts 9 th Edit9on
 Chapter 2: Operating-System Structures Operating System Concepts 9 th Edit9on Silberschatz, Galvin and Gagne 2013 Chapter 2: Operating-System Structures 1. Operating System Services 2. User Operating System
Introduction to Concurrent Software Systems. CSCI 5828: Foundations of Software Engineering Lecture 08 09/17/2015
 Introduction to Concurrent Software Systems CSCI 5828: Foundations of Software Engineering Lecture 08 09/17/2015 1 Goals Present an overview of concurrency in software systems Review the benefits and challenges
Zing Vision. Answering your toughest production Java performance questions
 Zing Vision Answering your toughest production Java performance questions Outline What is Zing Vision? Where does Zing Vision fit in your Java environment? Key features How it works Using ZVRobot Q & A
Computer Organization: A Programmer's Perspective
 Profiling Oren Kapah orenkapah.ac@gmail.com Profiling: Performance Analysis Performance Analysis ( Profiling ) Understanding the run-time behavior of programs What parts are executed, when, for how long
Memory Management: The Details
 Lecture 10 Memory Management: The Details Sizing Up Memory Primitive Data Types Complex Data Types byte: char: short: basic value (8 bits) 1 byte 2 bytes Pointer: platform dependent 4 bytes on 32 bit machine
A common scenario... Most of us have probably been here. Where did my performance go? It disappeared into overheads...
 OPENMP PERFORMANCE 2 A common scenario... So I wrote my OpenMP program, and I checked it gave the right answers, so I ran some timing tests, and the speedup was, well, a bit disappointing really. Now what?.
Introduction to Concurrent Software Systems. CSCI 5828: Foundations of Software Engineering Lecture 12 09/29/2016
 Introduction to Concurrent Software Systems CSCI 5828: Foundations of Software Engineering Lecture 12 09/29/2016 1 Goals Present an overview of concurrency in software systems Review the benefits and challenges
Performance Profiling
 Performance Profiling Minsoo Ryu Real-Time Computing and Communications Lab. Hanyang University msryu@hanyang.ac.kr Outline History Understanding Profiling Understanding Performance Understanding Performance
Compiler construction 2009
 Compiler construction 2009 Lecture 3 JVM and optimization. A first look at optimization: Peephole optimization. A simple example A Java class public class A { public static int f (int x) { int r = 3; int
EECS 482 Introduction to Operating Systems
 EECS 482 Introduction to Operating Systems Winter 2018 Harsha V. Madhyastha Monitors vs. Semaphores Monitors: Custom user-defined conditions Developer must control access to variables Semaphores: Access
Performance analysis basics
 Performance analysis basics Christian Iwainsky Iwainsky@rz.rwth-aachen.de 25.3.2010 1 Overview 1. Motivation 2. Performance analysis basics 3. Measurement Techniques 2 Why bother with performance analysis
Systems software design. Software build configurations; Debugging, profiling & Quality Assurance tools
 Systems software design Software build configurations; Debugging, profiling & Quality Assurance tools Who are we? Krzysztof Kąkol Software Developer Jarosław Świniarski Software Developer Presentation
Computer Systems A Programmer s Perspective 1 (Beta Draft)
") Computer Systems A Programmer s Perspective 1 (Beta Draft) Randal E. Bryant David R. O Hallaron August 1, 2001 1 Copyright c 2001, R. E. Bryant, D. R. O Hallaron. All rights reserved. 2 Contents Preface
Computer Systems A Programmer s Perspective 1 (Beta Draft) Randal E. Bryant David R. O Hallaron August 1, 2001 1 Copyright c 2001, R. E. Bryant, D. R. O Hallaron. All rights reserved. 2 Contents Preface
Process- Concept &Process Scheduling OPERATING SYSTEMS
 OPERATING SYSTEMS Prescribed Text Book Operating System Principles, Seventh Edition By Abraham Silberschatz, Peter Baer Galvin and Greg Gagne PROCESS MANAGEMENT Current day computer systems allow multiple
Chapter 2. Operating-System Structures
 Chapter 2 Operating-System Structures 2.1 Chapter 2: Operating-System Structures Operating System Services User Operating System Interface System Calls Types of System Calls System Programs Operating System
CSE 303: Concepts and Tools for Software Development
 CSE 303: Concepts and Tools for Software Development Dan Grossman Spring 2007 Lecture 19 Profiling (gprof); Linking and Libraries Dan Grossman CSE303 Spring 2007, Lecture 19 1 Where are we Already started
Programming with MPI
 Programming with MPI p. 1/?? Programming with MPI Miscellaneous Guidelines Nick Maclaren Computing Service nmm1@cam.ac.uk, ext. 34761 March 2010 Programming with MPI p. 2/?? Summary This is a miscellaneous
Code Profiling. CSE260, Computer Science B: Honors Stony Brook University
 Code Profiling CSE260, Computer Science B: Honors Stony Brook University http://www.cs.stonybrook.edu/~cse260 Performance Programs should: solve a problem correctly be readable be flexible (for future
Dynamic Memory Management
 Dynamic Memory Management Professor Jennifer Rexford http://www.cs.princeton.edu/~jrex 1 Goals of Today s Lecture Dynamic memory management o Garbage collection by the run-time system (Java) o Manual deallocation
Chapter 2: Operating-System Structures
 Chapter 2: Operating-System Structures Chapter 2: Operating-System Structures Operating System Services User Operating System Interface System Calls Types of System Calls System Programs Operating System
Introduction to Parallel Performance Engineering
 Introduction to Parallel Performance Engineering Markus Geimer, Brian Wylie Jülich Supercomputing Centre (with content used with permission from tutorials by Bernd Mohr/JSC and Luiz DeRose/Cray) Performance:
by Marina Cholakyan, Hyduke Noshadi, Sepehr Sahba and Young Cha
 CS 111 Scribe Notes for 4/11/05 by Marina Cholakyan, Hyduke Noshadi, Sepehr Sahba and Young Cha Processes What is a process? A process is a running instance of a program. The Web browser you're using to
CS 160: Interactive Programming
 CS 160: Interactive Programming Professor John Canny 3/8/2006 1 Outline Callbacks and Delegates Multi-threaded programming Model-view controller 3/8/2006 2 Callbacks Your code Myclass data method1 method2
o Code, executable, and process o Main memory vs. virtual memory
 Goals for Today s Lecture Memory Allocation Prof. David August COS 217 Behind the scenes of running a program o Code, executable, and process o Main memory vs. virtual memory Memory layout for UNIX processes,
the gamedesigninitiative at cornell university Lecture 9 Memory Management
 Lecture 9 Gaming Memory Constraints Redux Wii-U Playstation 4 2GB of RAM 1GB dedicated to OS Shared with GPGPU 8GB of RAM Shared GPU, 8-core CPU OS footprint unknown 2 Two Main Concerns with Memory Getting
Chapter 2: Operating-System Structures. Operating System Concepts 9 th Edition
 Chapter 2: Operating-System Structures Silberschatz, Galvin and Gagne 2013 Chapter 2: Operating-System Structures Operating System Services User Operating System Interface System Calls Types of System
Operating Systems (2INC0) 2018/19. Introduction (01) Dr. Tanir Ozcelebi. Courtesy of Prof. Dr. Johan Lukkien. System Architecture and Networking Group
 2018/19. Introduction (01) Dr. Tanir Ozcelebi. Courtesy of Prof. Dr. Johan Lukkien. System Architecture and Networking Group") Operating Systems (2INC0) 20/19 Introduction (01) Dr. Courtesy of Prof. Dr. Johan Lukkien System Architecture and Networking Group Course Overview Introduction to operating systems Processes, threads and
Operating Systems (2INC0) 20/19 Introduction (01) Dr. Courtesy of Prof. Dr. Johan Lukkien System Architecture and Networking Group Course Overview Introduction to operating systems Processes, threads and
Why do we care about parallel?
 Threads 11/15/16 CS31 teaches you How a computer runs a program. How the hardware performs computations How the compiler translates your code How the operating system connects hardware and software The
Computation Abstractions. Processes vs. Threads. So, What Is a Thread? CMSC 433 Programming Language Technologies and Paradigms Spring 2007
 CMSC 433 Programming Language Technologies and Paradigms Spring 2007 Threads and Synchronization May 8, 2007 Computation Abstractions t1 t1 t4 t2 t1 t2 t5 t3 p1 p2 p3 p4 CPU 1 CPU 2 A computer Processes
CSC 1600 Memory Layout for Unix Processes"
 CSC 16 Memory Layout for Unix Processes" 1 Lecture Goals" Behind the scenes of running a program" Code, executable, and process" Memory layout for UNIX processes, and relationship to C" : code and constant
Section 7: Wait/Exit, Address Translation
 William Liu October 15, 2014 Contents 1 Wait and Exit 2 1.1 Thinking about what you need to do.............................. 2 1.2 Code................................................ 2 2 Vocabulary 4
OPERATING SYSTEM PROJECT: SOS
 OPERATING SYSTEM PROJECT: SOS I. Description 1. This project simulates a noninteractive (batch) monolithic operating system. Your program, OS, is a set of functions invoked by SOS (Student Operating System),
Managed runtimes & garbage collection. CSE 6341 Some slides by Kathryn McKinley
 Managed runtimes & garbage collection CSE 6341 Some slides by Kathryn McKinley 1 Managed runtimes Advantages? Disadvantages? 2 Managed runtimes Advantages? Reliability Security Portability Performance?
Lectures 5-6: Introduction to C
 Lectures 5-6: Introduction to C Motivation: C is both a high and a low-level language Very useful for systems programming Faster than Java This intro assumes knowledge of Java Focus is on differences Most
Dynamic Memory Management! Goals of this Lecture!
 Dynamic Memory Management!!! 1 Goals of this Lecture! Help you learn about:! Dynamic memory management techniques! Garbage collection by the run-time system (Java)! Manual deallocation by the programmer
DNWSH - Version: 2.3..NET Performance and Debugging Workshop
 DNWSH - Version: 2.3.NET Performance and Debugging Workshop .NET Performance and Debugging Workshop DNWSH - Version: 2.3 8 days Course Description: The.NET Performance and Debugging Workshop is a practical
CS 536 Introduction to Programming Languages and Compilers Charles N. Fischer Lecture 11
 CS 536 Introduction to Programming Languages and Compilers Charles N. Fischer Lecture 11 CS 536 Spring 2015 1 Handling Overloaded Declarations Two approaches are popular: 1. Create a single symbol table
A new Mono GC. Paolo Molaro October 25, 2006
 A new Mono GC Paolo Molaro lupus@novell.com October 25, 2006 Current GC: why Boehm Ported to the major architectures and systems Featurefull Very easy to integrate Handles managed pointers in unmanaged
Process Concepts. CSC400 - Operating Systems. 3. Process Concepts. J. Sumey
 CSC400 - Operating Systems 3. Process Concepts J. Sumey Overview Concurrency Processes & Process States Process Accounting Interrupts & Interrupt Processing Interprocess Communication CSC400 - Process
CERN IT Technical Forum
 Evaluating program correctness and performance with new software tools from Intel Andrzej Nowak, CERN openlab March 18 th 2011 CERN IT Technical Forum > An introduction to the new generation of software
Dynamic Memory Management
 Dynamic Memory Management 1 Goals of this Lecture Help you learn about: Dynamic memory management techniques Garbage collection by the run-time system (Java) Manual deallocation by the programmer (C, C++)
CHAPTER 2: SYSTEM STRUCTURES. By I-Chen Lin Textbook: Operating System Concepts 9th Ed.
 CHAPTER 2: SYSTEM STRUCTURES By I-Chen Lin Textbook: Operating System Concepts 9th Ed. Chapter 2: System Structures Operating System Services User Operating System Interface System Calls Types of System
CS 475. Process = Address space + one thread of control Concurrent program = multiple threads of control
 Processes & Threads Concurrent Programs Process = Address space + one thread of control Concurrent program = multiple threads of control Multiple single-threaded processes Multi-threaded process 2 1 Concurrent
Review: Easy Piece 1
 CS 537 Lecture 10 Threads Michael Swift 10/9/17 2004-2007 Ed Lazowska, Hank Levy, Andrea and Remzi Arpaci-Dussea, Michael Swift 1 Review: Easy Piece 1 Virtualization CPU Memory Context Switch Schedulers
Recitation 2/18/2012
 15-213 Recitation 2/18/2012 Announcements Buflab due tomorrow Cachelab out tomorrow Any questions? Outline Cachelab preview Useful C functions for cachelab Cachelab Part 1: you have to create a cache simulator
Operating Systems Design Exam 1 Review: Spring 2012
 Operating Systems Design Exam 1 Review: Spring 2012 Paul Krzyzanowski pxk@cs.rutgers.edu 1 Question 1 UNIX-derived systems execute new programs via a two-step process of fork and execve. Other systems
Debugging and Profiling
 Debugging and Profiling Dr. Axel Kohlmeyer Senior Scientific Computing Expert Information and Telecommunication Section The Abdus Salam International Centre for Theoretical Physics http://sites.google.com/site/akohlmey/
Managed runtimes & garbage collection
 Managed runtimes Advantages? Managed runtimes & garbage collection CSE 631 Some slides by Kathryn McKinley Disadvantages? 1 2 Managed runtimes Portability (& performance) Advantages? Reliability Security
CMPSCI 377: Operating Systems Exam 1: Processes, Threads, CPU Scheduling and Synchronization. October 9, 2002
 Name: Student Id: General instructions: CMPSCI 377: Operating Systems Exam 1: Processes, Threads, CPU Scheduling and Synchronization October 9, 2002 This examination booklet has 10 pages. Do not forget
COSC Software Engineering. Lecture 16: Managing Memory Managers
 COSC345 2013 Software Engineering Lecture 16: Managing Memory Managers Outline Typical problems (from previous lectures) Memory leaks aren t just for (Objective) C Tracking malloc() calls Catching calls
Operating Systems Design Exam 2 Review: Spring 2011
 Operating Systems Design Exam 2 Review: Spring 2011 Paul Krzyzanowski pxk@cs.rutgers.edu 1 Question 1 CPU utilization tends to be lower when: a. There are more processes in memory. b. There are fewer processes
CMSC 330: Organization of Programming Languages
 CMSC 330: Organization of Programming Languages Memory Management and Garbage Collection CMSC 330 - Spring 2013 1 Memory Attributes! Memory to store data in programming languages has the following lifecycle
Spring CS 170 Exercise Set 1 (Updated with Part III)
") Spring 2015. CS 170 Exercise Set 1 (Updated with Part III) Due on May 5 Tuesday 12:30pm. Submit to the CS170 homework box or bring to the classroom. Additional problems will be added as we cover more topics
Spring 2015. CS 170 Exercise Set 1 (Updated with Part III) Due on May 5 Tuesday 12:30pm. Submit to the CS170 homework box or bring to the classroom. Additional problems will be added as we cover more topics
CS 416: Opera-ng Systems Design March 23, 2012
 Question 1 Operating Systems Design Exam 2 Review: Spring 2011 Paul Krzyzanowski pxk@cs.rutgers.edu CPU utilization tends to be lower when: a. There are more processes in memory. b. There are fewer processes
Timing programs with time
 Profiling Profiling measures the performance of a program and can be used to find CPU or memory bottlenecks. time A stopwatch gprof The GNU (CPU) Profiler callgrind Valgrind s CPU profiling tool massif
CS 31: Intro to Systems Threading & Parallel Applications. Kevin Webb Swarthmore College November 27, 2018
 CS 31: Intro to Systems Threading & Parallel Applications Kevin Webb Swarthmore College November 27, 2018 Reading Quiz Making Programs Run Faster We all like how fast computers are In the old days (1980
Designing experiments Performing experiments in Java Intel s Manycore Testing Lab
 Designing experiments Performing experiments in Java Intel s Manycore Testing Lab High quality results that capture, e.g., How an algorithm scales Which of several algorithms performs best Pretty graphs
the gamedesigninitiative at cornell university Lecture 10 Memory Management
 Lecture 10 Gaming Memory (Current Generation) Playstation 4 8 GB RAM (unified) X-Box One (X) 12 GB RAM (unified) 9 GB for games Nintendo Switch 3 GB RAM (unified) 1 GB only for OS iphone/ipad 2 GB RAM
Learning from Bad Examples. CSCI 5828: Foundations of Software Engineering Lecture 25 11/18/2014
 Learning from Bad Examples CSCI 5828: Foundations of Software Engineering Lecture 25 11/18/2014 1 Goals Demonstrate techniques to design for shared mutability Build on an example where multiple threads
Is your profiler speaking the same language as you? Simon
 Is your profiler speaking the same language as you? Simon Maple @sjmaple Simon Maple - @sjmaple Agenda Performance Tools Performance by numbers Sampling vs Tracing XRebel JRebel 3 Performance Tools Java
Run-time Environments - 3
 Run-time Environments - 3 Y.N. Srikant Computer Science and Automation Indian Institute of Science Bangalore 560 012 NPTEL Course on Principles of Compiler Design Outline of the Lecture n What is run-time
Overview. CMSC 330: Organization of Programming Languages. Concurrency. Multiprocessors. Processes vs. Threads. Computation Abstractions
 CMSC 330: Organization of Programming Languages Multithreaded Programming Patterns in Java CMSC 330 2 Multiprocessors Description Multiple processing units (multiprocessor) From single microprocessor to
DB2 10 Capturing Tuning and Trending for SQL Workloads - a resource and cost saving approach
 DB2 10 Capturing Tuning and Trending for SQL Workloads - a resource and cost saving approach Roy Boxwell SOFTWARE ENGINEERING GmbH Session Code: V05 15.10.2013, 11:30 12:30 Platform: DB2 z/os 2 Agenda
Performance of Non-Moving Garbage Collectors. Hans-J. Boehm HP Labs
 Performance of Non-Moving Garbage Collectors Hans-J. Boehm HP Labs Why Use (Tracing) Garbage Collection to Reclaim Program Memory? Increasingly common Java, C#, Scheme, Python, ML,... gcc, w3m, emacs,
Parallel Programming: Background Information
 1 Parallel Programming: Background Information Mike Bailey mjb@cs.oregonstate.edu parallel.background.pptx Three Reasons to Study Parallel Programming 2 1. Increase performance: do more work in the same
Parallel Programming: Background Information
 1 Parallel Programming: Background Information Mike Bailey mjb@cs.oregonstate.edu parallel.background.pptx Three Reasons to Study Parallel Programming 2 1. Increase performance: do more work in the same
Deallocation Mechanisms. User-controlled Deallocation. Automatic Garbage Collection
 Deallocation Mechanisms User-controlled Deallocation Allocating heap space is fairly easy. But how do we deallocate heap memory no longer in use? Sometimes we may never need to deallocate! If heaps objects
The Art and Science of Memory Allocation
 Logical Diagram The Art and Science of Memory Allocation Don Porter CSE 506 Binary Formats RCU Memory Management Memory Allocators CPU Scheduler User System Calls Kernel Today s Lecture File System Networking
Operating Systems. Lecture Process Scheduling. Golestan University. Hossein Momeni
 Operating Systems Lecture 2.2 - Process Scheduling Golestan University Hossein Momeni momeni@iust.ac.ir Scheduling What is scheduling? Goals Mechanisms Scheduling on batch systems Scheduling on interactive
the gamedesigninitiative at cornell university Lecture 7 C++ Overview
 Lecture 7 Lecture 7 So You Think You Know C++ Most of you are experienced Java programmers Both in 2110 and several upper-level courses If you saw C++, was likely in a systems course Java was based on
Lecture 11 Code Optimization I: Machine Independent Optimizations. Optimizing Compilers. Limitations of Optimizing Compilers
 Lecture 11 Code Optimization I: Machine Independent Optimizations Topics Machine-Independent Optimizations Code motion Reduction in strength Common subexpression sharing Tuning Identifying performance
Memory Management. Disclaimer: some slides are adopted from book authors slides with permission 1
 Memory Management Disclaimer: some slides are adopted from book authors slides with permission 1 CPU management Roadmap Process, thread, synchronization, scheduling Memory management Virtual memory Disk
CS 326: Operating Systems. Process Execution. Lecture 5
 CS 326: Operating Systems Process Execution Lecture 5 Today s Schedule Process Creation Threads Limited Direct Execution Basic Scheduling 2/5/18 CS 326: Operating Systems 2 Today s Schedule Process Creation
21. This is a screenshot of the Android Studio Debugger. It shows the current thread and the object tree for a certain variable.
 4. Logging is an important part of debugging, which is hard to achieve on mobile devices, where application development and execution take place on different systems. Android includes a framework that
OpenMP at Sun. EWOMP 2000, Edinburgh September 14-15, 2000 Larry Meadows Sun Microsystems
 OpenMP at Sun EWOMP 2000, Edinburgh September 14-15, 2000 Larry Meadows Sun Microsystems Outline Sun and Parallelism Implementation Compiler Runtime Performance Analyzer Collection of data Data analysis
J2EE Development Best Practices: Improving Code Quality
 Session id: 40232 J2EE Development Best Practices: Improving Code Quality Stuart Malkin Senior Product Manager Oracle Corporation Agenda Why analyze and optimize code? Static Analysis Dynamic Analysis
Lecture Notes on Garbage Collection
 Lecture Notes on Garbage Collection 15-411: Compiler Design André Platzer Lecture 20 1 Introduction In the previous lectures we have considered a programming language C0 with pointers and memory and array
COMP 202 Recursion. CONTENTS: Recursion. COMP Recursion 1
 COMP 202 Recursion CONTENTS: Recursion COMP 202 - Recursion 1 Recursive Thinking A recursive definition is one which uses the word or concept being defined in the definition itself COMP 202 - Recursion
G52CON: Concepts of Concurrency
 G52CON: Concepts of Concurrency Lecture 11: Semaphores I" Brian Logan School of Computer Science bsl@cs.nott.ac.uk Outline of this lecture" problems with Peterson s algorithm semaphores implementing semaphores
Heap Management. Heap Allocation
 Heap Management Heap Allocation A very flexible storage allocation mechanism is heap allocation. Any number of data objects can be allocated and freed in a memory pool, called a heap. Heap allocation is
MultiThreading. Object Orientated Programming in Java. Benjamin Kenwright
 MultiThreading Object Orientated Programming in Java Benjamin Kenwright Outline Review Essential Java Multithreading Examples Today s Practical Review/Discussion Question Does the following code compile?
CS193k, Stanford Handout #10. HW2b ThreadBank
 CS193k, Stanford Handout #10 Spring, 99-00 Nick Parlante HW2b ThreadBank I handed out 2a last week for people who wanted to get started early. This handout describes part (b) which is harder than part
Advanced Topic: Efficient Synchronization
 Advanced Topic: Efficient Synchronization Multi-Object Programs What happens when we try to synchronize across multiple objects in a large program? Each object with its own lock, condition variables Is
Inspiring Creative Fun Ysbrydoledig Creadigol Hwyl. App Inventor Workbook
 Inspiring Creative Fun Ysbrydoledig Creadigol Hwyl App Inventor Workbook App Inventor is a cloud-based application development tool, enabling users to develop Android applications for free! App Inventor
Jackson Marusarz Intel Corporation
 Jackson Marusarz Intel Corporation Intel VTune Amplifier Quick Introduction Get the Data You Need Hotspot (Statistical call tree), Call counts (Statistical) Thread Profiling Concurrency and Lock & Waits
McRT-STM: A High Performance Software Transactional Memory System for a Multi- Core Runtime
 McRT-STM: A High Performance Software Transactional Memory System for a Multi- Core Runtime B. Saha, A-R. Adl- Tabatabai, R. Hudson, C.C. Minh, B. Hertzberg PPoPP 2006 Introductory TM Sales Pitch Two legs
Java Threads. Written by John Bell for CS 342, Spring 2018
 Java Threads Written by John Bell for CS 342, Spring 2018 Based on chapter 9 of Learning Java, Fourth Edition by Niemeyer and Leuck, and other sources. Processes A process is an instance of a running program.
ANITA S SUPER AWESOME RECITATION SLIDES
 ANITA S SUPER AWESOME RECITATION SLIDES 15/18-213: Introduction to Computer Systems Dynamic Memory Allocation Anita Zhang, Section M UPDATES Cache Lab style points released Don t fret too much Shell Lab
Exception Safe Coding
 Exception Safe Coding Dirk Hutter hutter@compeng.uni-frankfurt.de Prof. Dr. Volker Lindenstruth FIAS Frankfurt Institute for Advanced Studies Goethe-Universität Frankfurt am Main, Germany http://compeng.uni-frankfurt.de