University of Illinois Department of Electrical and Computer Engineering ECE 451 Automated Microwave Measurements Laboratory
|
|
|
- Linette Pearson
- 5 years ago
- Views:
Transcription
1 University of Illinois Department of Electrical and Computer Engineering ECE 451 Automated Microwave Measurements Laboratory Experiment No. 4 Introduction to the Windows XP Workstation using National Instruments LabView with Automated Detector Measurements Introduction Computers have been used extensively to automate data gathering and to facilitate data processing and displaying. This experiment will introduce the student to computer automation by performing the measurement of a detector output voltage as a function of source power. The commands to control the HP8350B Sweep Oscillator and the HP3457A Digital Multimeter are sent from the program and listings of data are retrieved, displayed and saved in a meaningful way with the LabView program. HPIB (IEEE-488) BUS Windows XP Workstation SOURCE HP 8350B 719 DVM HP 3457A 722 RF OUT DIODE DETECTOR DC OUT Figure 1. Automated Measurements of the Diode Detector 1
2 Procedure Computer Language used: National Instruments LabView. To use: 1) Sign on Windows XP Workstation. In general do not write to C:\ for two reasons: (1) Try to keep system orderly so that crashes are minimized. (2) Your data will not be there later. C:\ is cleaned periodically by the Network Administrator. For the first time use ONLY Go to Your Personal Directory W:\ Make a director, LabView, under W:\ Change a directory to LabView Make a directory, Lab4, under LabView W:\ tree would look like W:\LabView\Lab4 Later you may add Lab5 and other content to your personal directory 2) Follow the LabView tutorial #1; write a program which will get inputs such as source power sweeping from 40dBm to 10dBm at the fixed frequency of 650 MHz. The program will communicate with the instruments and collect the detector output voltages and convert them to the logarithmic voltage format, and display them on the computer screen. Save the data in LVM file format (which is easy to use within LabView, but not compatible with other applications such as Agilent ADS). Finally, modify the program to save the data in a format called CITIfile (which can later be imported into ADS). Suggested program flow chart is shown in Figure 2. 3) Obtain the detector output voltage and logarithmic voltage plots from the first program. Submit the CITIfile printout along with your lab notebook. 4) Follow the LabView tutorial #2; write a second program that will read the LVM file you have created with the first program and display the contents, which are the normal detector output voltage and logarithmic voltage. 5) Follow the short ADS tutorial; read the CITIfile data and obtain the plot of detector output voltage, and logarithmic voltage. 6) Obtain the plots from ADS dataset window. 2
3 Frequency, Power Initialize Sweep Oscillator 8350B Store frequency point Initialize DVM Number of frequency points Calculate power step For-loop (number of power points) Current loop value Start Power Calculate power Set the current power of 8350B voltage Stop Power Read DVM Store powers End of for-loop Convert into log volt voltage Set Source to safe state Log Voltage Set DVM to local Saving Data Log Voltage Figure 2. Suggested Program Flow Chart For Measuring and Saving Measured Values Appendix List (1) HP-IB Program Codes (2) HP3457A Reading and Changing the HP-IB Address (3) LabView tutorial 1 (measuring, saving data) (4) LabView tutorial 2 (reading saved data) (5) ADS tutorial 3
4 HP8350B Program Codes (1 of 2) 4-6
5 HP8350B Program Codes (2 of 2) 4-7
6 4-8
7 LabView Tutorial No. 1 for Lab 4 (measuring and saving data) Objective The goal of this tutorial is to be able to write a short program that accepts the input (frequency, power level etc.) from the user, processes them, communicates with the measurement equipment, retrieves the measured raw data from the equipment, analyzes it and presents it to the user in a meaningful form. Using this program, a student should also be able to save the data into a file for later usage. The concept of LabView programming resembles that of a program flow chart. A box represents each instruction or I/O operation. Boxes are in turn connected with data flow paths (wires). Before starting the program, all instruments should be turned on and connected through the HPIB (IEEE-488) bus. Starting LabView Select Programs>National Instruments>LabView 8.0>LabView from the Start Menu to load the program. Then select Blank VI. You will see the blank Front Panel window and Block Diagram of your new program, as shown in Figure 1. You can switch between Front Panel and Block Diagram windows by pressing Ctrl-E. 1


8 Figure 1: LabView Front Panel and Block Diagram windows Communicating with the instruments VISA resource box must be created on the Front Panel to communicate with each instrument. To do that, right-click on any blank space of the Front Panel and select Modern>I/O>VISA Resource. A combo box titled VISA Resource Name will appear. Place it anywhere on the front panel. Change its title to represent a device you want to communicate with, e.g. Source, or DVM (for Digital Voltmeter). From the drop-down listbox, you will be able to select the desired HPIB address that corresponds to the actual device, as shown in Figure 2. LabView automatically detects all the devices connected to HPIB bus, and offers them in the drop-down listbox. Figure 2: Selecting the HPIB address using VISA Resource box 2

9 Simultaneously with creating the VISA Resource box on the Front Panel, an equivalently named box was created on the Block Diagram. This box will be used to provide the identifier of the device to all the other device control boxes on the Block Diagram (used to Open and Close communication, Init the device, Set parameters, Assert trigger and Read values), as will be seen shortly. Add two VISA Resource boxes to the Front Panel, label them DVM Address and Source Address, and on the Block Diagram connect each to its own Open box (found in Instrument I/O>VISA>VISA Advanced menu). The output of VISA Resource box should be connected to the VISA Resource Name input of the Open box (uppermost input on the left-hand side of the box). Next, add two Write boxes (found in Instrument I/O>VISA submenu), and connect the corresponding resource name inputs with outputs. You can also change the labels of Open and Write boxes to remind you of their functions, as shown in Figure 3. Figure 3: Open and Write boxes that will be used to initialize the devices In order to actually initialize the devices, we need to send them appropriate strings. For initializing the DVM, create on the Block Diagram a String Constant (found in Programming>String palette), fill it with appropriate text for initializing the DVM (as shown in Figure 4), create an End Of Line constant (in the same palette), append it to the String Constant using the Concatenate Strings box (again in the String palette), and connect the appended string as an input to write buffer terminal of our Init DVM box (as shown in Figure 4). Initializing the source is a slightly different procedure, since we want to be able to define the sweeping frequency at runtime. To do that, we first create a String Control on the Front Panel (found in Modern>String & Path menu) and label it Frequency. Next, by double-clicking on it, we find its corresponding box on the Block Diagram; its output will be used as an input to the Build Text VI that we will also insert (from Express>Output menu). By double-clicking the Build Text icon, we can define its functionality, as shown in Figure 4. We now connect the output of Frequency box to the freq input of Build Text VI, and its output, in turn, to the write buffer input of Init Source box. 3
, as shown in Figure 4, and creating the time constant (a quick way to do that is to right-click its Delay Time terminal, and")
10 We now want to add a time delay of, say, 300 ms, in order for our source to have time to stabilize its output. We do that by inserting the Time Delay VI (from Express>Exec Control menu), as shown in Figure 4, and creating the time constant (a quick way to do that is to right-click its Delay Time terminal, and to select Create>Constant from the shortcut menu). To conserve screen real estate, we can right-click on two Express VIs we just added and select View as Icon option. Since we don t want our Time Delay to be executed before we send the initialization data to the source, we need to be able to control the flow of our program. One handy way to do that is by using the error out and error in terminals, as shown in Figure 4. Error data flow is indicated by a thick pink wire. Figure 4: Completed block diagram for initializing the devices Now we re ready to move on to measuring the data. On the Front Panel, add three Numeric inputs (Numeric>Numeric Control), and label them as shown in Figure 5. These will serve as inputs to our for loop that will be doing the measurements. To have the data represented as integers (as opposed to default of double-precision real numbers), right-click each of the boxes on Block Diagram, select Representation>I32 (actually, in this case, any integer type would do). Apply several math operations, as shown in Figure 5, to obtain the step size for our sweep. Add a large for box (Programming>Structures>For Loop), and connect Start Power, Step, Number of Points, and the two instrument addresses to the left-hand side of the for box those will serve as its inputs. A nice programming practice is to set the cursor to busy during measurements; this is done by inserting the Set Busy box (Programming>Dialog & User Interface>Cursor). 4
11 Figure 5: Inputs to the for loop The for loop has two significant objects automatically created: N holds the total number of repeats, and i holds the current iteration of the loop (ranging from 0 to N-1). We use i to calculate the current value of power to be sent to the source. In each iteration, we first build the string to be sent to the source, by using Build Text VI (labeled Build Power ) whose behavior is depicted in Figure 6. Next, we write the string to the source, wait 300 ms for the output to stabilize, trigger the DVM by using Assert Trigger (found in Instrument I/O>VISA), read up to 16 digits of voltage by using VISA Read (again found in Instrument I/O>VISA), and convert the string that was read to a number by using Fract/Exp String To Number (found in Programming>String>String/Number Conversion). This process is shown in Figure 6. 5
 to the Front Panel, as shown in Figure 10.")
12 Figure 6: Measuring data in the for loop If we want to follow our measurements in real time, one possible solution is to insert plots of read data into the for loop. To do that, first insert two Express XY Graph objects (found in Express>Graph Indicators menu) to the Front Panel, as shown in Figure 10. Corresponding Build XY Graph VIs will automatically be added to the Block Diagram. Make sure (by double-clicking on them) that Clear data on each call is turned off, since we want graphs of complete measurements, not just single points. Both graphs should have the current value of power connected to their X inputs. The linear graph will have just the read value of voltage as its Y input, while we would need to calculate the log value of voltage (in units of dbm) as shown in Figure 7. 6

13 Figure 7: Plotting the measurements in real time After reading the data and finishing with for loop, we would first want to unset the Busy cursor, power down our source (e.g. to -75dBm) and close communication with the instruments, as depicted in Figure 8. Figure 8: Cleaning up after measuring Finally, we want to save our measured data to a file, in order to be able to analyze it later. LabView s for loop automatically collects all the data coming out of the loop, and creates arrays out of it; the process is called auto-indexing (if needed, this behavior could be changed by right-clicking the point where the data leaves the loop - in our case 7
 to Waveform data types, by using the Build Waveform")
14 we would want to uncheck auto-indexing for the DVM Address, Source Address and Error wires). To make use of LabView s full potentials in working with files, one easy way is to convert the three arrays of data (power, voltage and logvolt) to Waveform data types, by using the Build Waveform box (found in Programming>Waveform palette), as illustrated in Figure 9a. Next, we set the array names to represent the type of data measured, by using Set Waveform Attribute (found in Programming>Waveform) to set the NI_ChannelName attributes of the waveforms, also depicted in Figure 9a. Figure 9a: Formatting and saving the data We then aggregate the three waveforms, by using the Merge Signals box (found in Express>Signal Manipulation), and feed them to the Write To Measurement File VI (found in Express>Output), the settings of which are visible in Figure 9b. 8

15 Figure 9b: Write To Measurement File configuration This way, the data is saved in LabView s proprietary text format 1 with the extension LVM, viewable in a text editor, but not directly importable into other programs, such as 1 Note: The LabVIEW Measurement (.lvm) format is a text-based file format for one-dimensional data that you want to use with the Read LabVIEW Measurement File and Write LabVIEW Measurement File Express VIs. The.lvm file is designed so it is easy to parse and easy to read when imported into a spreadsheet program, such as Microsoft Excel, or a text editor, such as Notepad. It supports multiple data sets, grouping of data sets, and the addition of data sets to existing files. The file format is not designed for high-performance or for very large data sets, as is the case with all textbased formats. Use the binary file format, such as HDF5, for very large data sets. Specification for the LabVIEW Measurement File (.lvm) is available at: 9
16 Agilent ADS. In order to communicate with ADS, we would need to write a separate subroutine for saving the data into e.g. CITIfile 2 format, which falls out of the scope of this course because of the relative complexity of that subroutine (compared to the simple Write to Measurement File Express VI). However, for the purpose of demonstrating how to export data measured in LabView to ADS, a complete subroutine for saving the data in CITIfile format will be provided to you. Its usage is straightforward, as shown in Figure 9c. Figure 9c: SubVI for Saving the Data in CITIfile Format We finally insert a File Path Indicator to the Front Panel (from Modern>String & Path) to be able to observe the actual location of the saved file, as shown in Figure 10, and end the dataflow with Simple Error Handler (from Programming>Dialog & User Interface). Figures 9 a, b, and c show the saving part of our program, and Figure 10 depicts the final appearance of our Front Panel. 2 Note: Hewlett-Packard Co. (now Agilent Technologies) developed the CITIfile (Common Instrumentation Transfer and Interchange) format for computer/instrumentation data exchange and subsequently adopted it to the MDS and ADS EDA tools. CITIfile is suited for load-pull data since it can support an arbitrary number of dependent and independent variables. One requirement is that the independent variables must be methodically swept that is, the same inner values of the sweep must be identical. 10

17 Figure 10: The final look of our Front Panel To sum it all up, our program Block Diagram should look close to what s depicted in Figure
18 Figure 11: The final look of our Block Diagram 12
 Objective The goal of this tutorial is to write a program that will read the LVM file you have created with the first program and display the contents, which are the")
19 LabView Tutorial No. 2 for Lab 4 (reading saved data) Objective The goal of this tutorial is to write a program that will read the LVM file you have created with the first program and display the contents, which are the normal detector output voltage and logarithmic voltage Before starting the program, all instruments should be turned on and connected through the HPIB (IEEE-488) bus. Reading the data One of the advantages of LabView s LVM format is the ease with which we can retrieve saved data, as shown in Figure 1. We simply insert an Express VI named Read From Measurement File, and error handling and optionally display the path and filename from which user opted to read the data. Figure 1. Reading data from LVM file. Plotting The Read Data Plotting the data is done in very much the same fashion as in Tutorial 1 we simply break down the set of signals into individual arrays, using Split Signals (found in 1


20 Express>Signal Manipulation), and then plot two graphs using standard Build XY Graph Express VI, as depicted in Figure 2. Figure 2. Plotting the voltage and logvolt measurements. Creating A Table Of Read Values Creating a table of array values is also done using an Express VI, as shown in Figure 3. Figure 3. Displaying arrays of measured values in a table. Unfortunately, extracting array names and labeling table columns is not as straightforward. We need to directly manipulate the Property Node of the table which contains column headers. 2
 and feed it with the set of signals we have read.")
![Then, we would unbundle the signal names and group them into an array, with which we would feed the Strings[] Property Node of the table (created by right-clicking](/docs-images/81/83609784/images/21-1.jpg "on Table object and then selecting Create>Property Node>Column Header Strings. The entire process is depicted in Figure 4. Figure 4. Adding column headers to the table.")
21 One possible way of achieving this, as suggested on the NI website, would be to add the ex_getallexpressattribs.vi box (found on C: drive, in the subfolder LabView8\vi.lib\express\express shared\transition.llb ) and feed it with the set of signals we have read. Then, we would unbundle the signal names and group them into an array, with which we would feed the Strings[] Property Node of the table (created by right-clicking on Table object and then selecting Create>Property Node>Column Header Strings. The entire process is depicted in Figure 4. Figure 4. Adding column headers to the table. Front Panel Figure 5. The suggested look of the Front Panel. 3

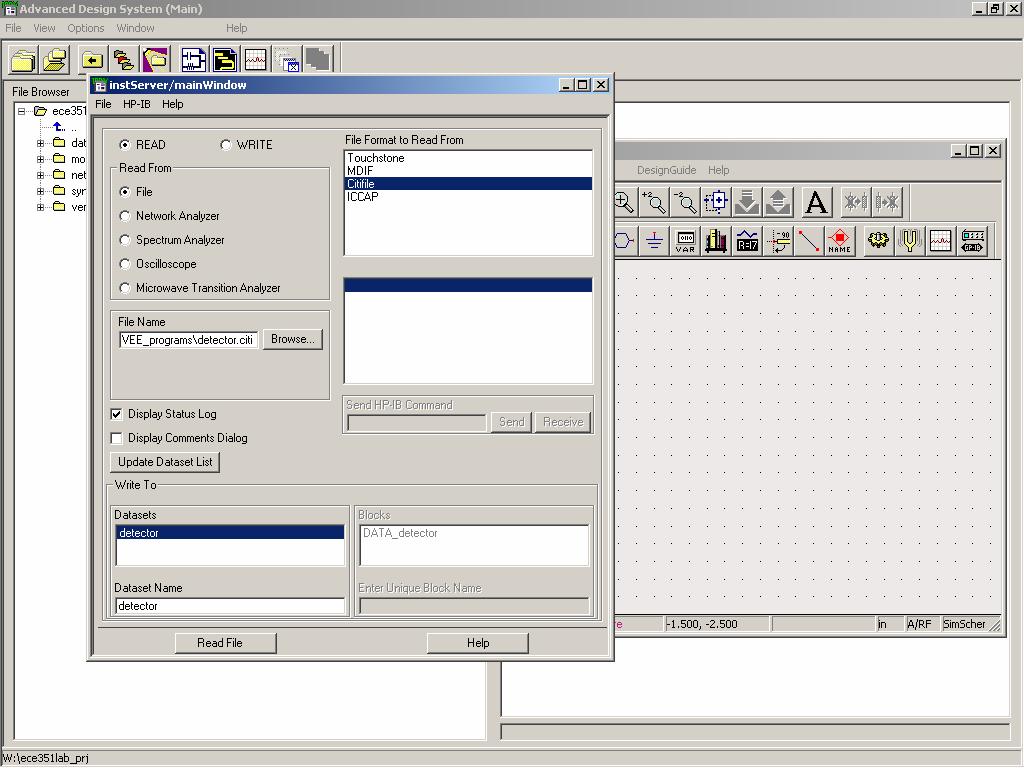
22 ADS tutorial (Reading Citifile) To start Agilent Advanced Design System, select Start > Programs > Advanced Design System 1.5 to load the program. 1. You will see the main screen window where you can start creating a project. Then, from the top menu, choose New Project under File. Browse to see select your network directory under W: drive as seen in figure 1. Once you hit OK, the schematic window will appear automatically. This is the window where you can draw circuit and do the simulation. We are not interested in design and simulation for this lab. Figure However, you need to choose Window from the menu appears in the schematic window. Then, you must select File/Instrument Server to do the set up for reading citifile as shown in figure You will see a third window pops up in figure 3. Check READ radio button. Select File in Read From. Then, browse to where you save your citifile. Give Dataset Name as detector or an appropriate name. Next, click on Read File. This will read the data from the specified citifile into the dataset file. 1

23 Figure 2. Figure 3. 2

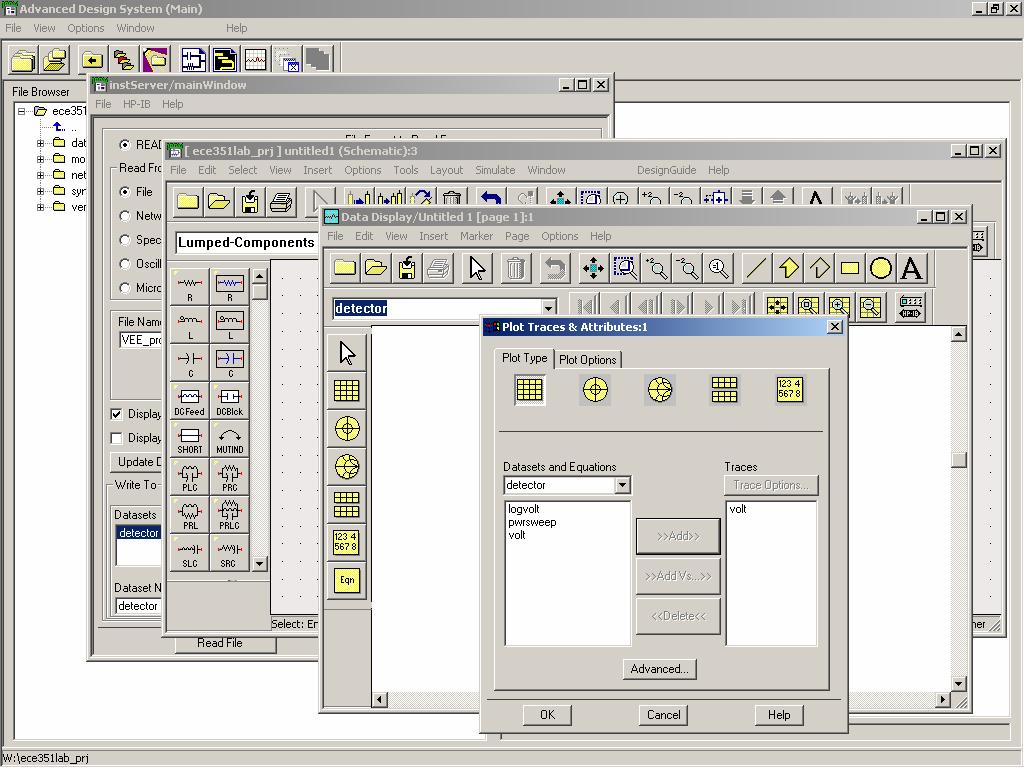
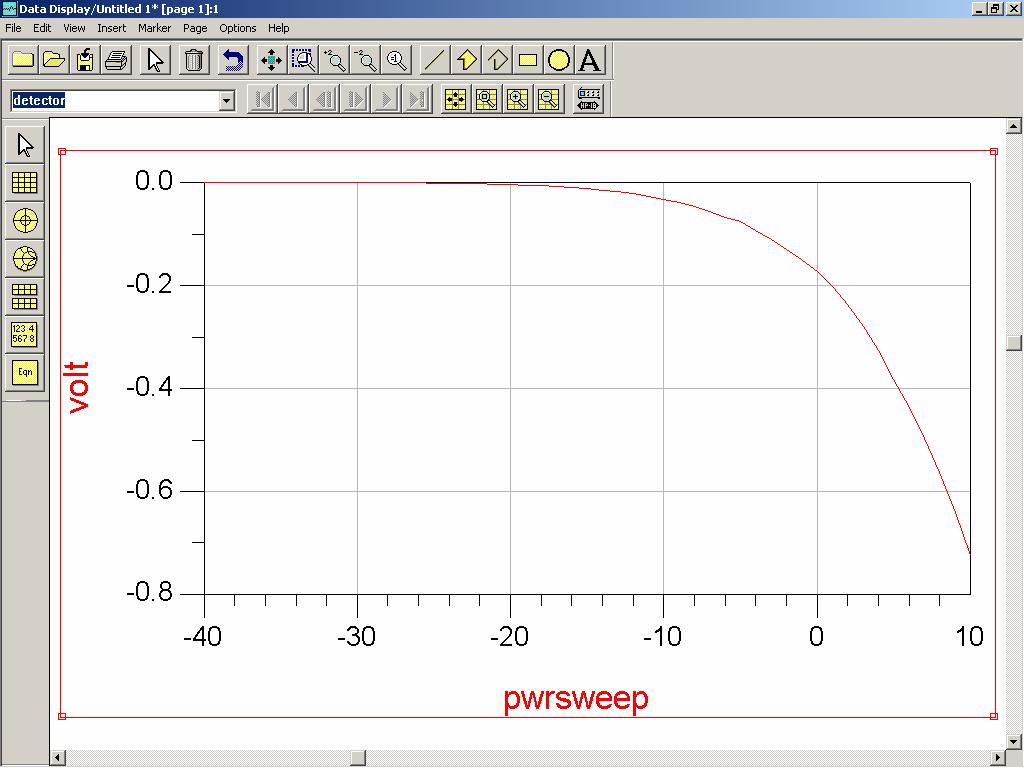
24 4. In order to observe the data stored in the dataset, click on New Data Display window under Window on the top menu panel as shown in figure Once the data display window popped up, click on the second button with a yellow rectangular box with grid inside in order to observe the plot as seen in figure 5. Another window will then pop up as in figure 6. You can select more than one independent variable to display in a single graph. However, you might want to choose the voltage for one graph and logarithmic voltage for another graph since they have different scaling. Then, add the variable (for example in the figure 6) and click OK. Detector output voltage vs. power plot as in figure 7 will be resulted. 6. In order to get a full view of the plot as in the figure 8, press Ctrl+F or select View All under View. 7. To place a marker, select New under Marker menu, and place the market on the trace as shown in the figure 9. Figure 4. 3

25 Figure 5. Figure 6. 4

26 Figure 7. Figure 8. 5

27 Figure 9. 6
28 7
ECE 451 Automated Microwave Measurements Laboratory. Experiment No. 2. Automated RF Power Detection Using LabVIEW
 Introduction ECE 451 Automated Microwave Measurements Laboratory Experiment No. 2 Automated RF Power Detection Using LabVIEW Experiment design is undoubtedly the most difficult aspect of an engineering
Section 1 Establishing an Instrument Connection
 Manual for Sweep VI Fall 2011 DO NOT FORGET TO SAVE YOUR DATA TO A NEW LOCATION, OTHER THAN THE TEMP FOLDER ON YOUR LAB STATION COMPUTER! FAILURE TO DO SO WILL RESULT IN LOST DATA WHEN YOU LOG OUT! 1.1.
Virtual Instrumentation With LabVIEW
 Virtual Instrumentation With LabVIEW Course Goals Understand the components of a Virtual Instrument Introduce LabVIEW and common LabVIEW functions Build a simple data acquisition application Create a subroutine
Certified LabVIEW Associate Developer Exam. Test Booklet
 Certified LabVIEW Associate Developer Exam Test Booklet Note: The use of the computer or any reference materials is NOT allowed during the exam. Instructions: If you did not receive this exam in a sealed
Exercise 5: Basic LabVIEW Programming
 Exercise 5: Basic LabVIEW Programming In this exercise we will learn the basic principles in LabVIEW. LabVIEW will be used in later exercises and in the project part, as well in other courses later, so
Introduction to LabVIEW Exercise-1
 Introduction to LabVIEW Exercise-1 Objective In this Laboratory, you will write simple VIs to incorporate basic programming structures in LabVIEW. This section will teach you fundamentals of LabVIEW front
Virtual Instrumentation With LabVIEW
 Virtual Instrumentation With LabVIEW Section I LabVIEW terms Components of a LabVIEW application LabVIEW programming tools Creating an application in LabVIEW LabVIEW Programs Are Called Virtual Instruments
Introduction to National Instruments LabVIEW and Data Acquisition (DAQ)
") Introduction to National Instruments LabVIEW and Data Acquisition (DAQ) Danial J. Neebel, Joseph R. Blandino, and David J. Lawrence, College of Integrated Science and Technology James Madison University
Introduction to National Instruments LabVIEW and Data Acquisition (DAQ) Danial J. Neebel, Joseph R. Blandino, and David J. Lawrence, College of Integrated Science and Technology James Madison University
INTRODUCTION TO LABVIEW
 INTRODUCTION TO LABVIEW 2nd Year Microprocessors Laboratory 2012-2013 INTRODUCTION For the first afternoon in the lab you will learn to program using LabVIEW. This handout is designed to give you an introduction
Certified LabVIEW Associate Developer Examination
 Certified LabVIEW Associate Developer Examination Examinee Date: Administrator Date: Note: The use of the computer or any reference materials is NOT allowed during the exam. Instructions: If you did not
Arrays are lists of elements of the same data type. They are analogous to arrays in traditional languages.
 0 1 Arrays are lists of elements of the same data type. They are analogous to arrays in traditional languages. Arrays can have one or more dimensions. Arrays can have up to (2^31)-1 elements per dimension.
ME 365 EXPERIMENT 3 INTRODUCTION TO LABVIEW
 ME 365 EXPERIMENT 3 INTRODUCTION TO LABVIEW Objectives: The goal of this exercise is to introduce the Laboratory Virtual Instrument Engineering Workbench, or LabVIEW software. LabVIEW is the primary software
Step-by-Step Data Acquisition Part II Exercise 2: Generating an Analog Output Waveform
 Step-by-Step Data Acquisition Part II Exercise 2: Generating an Analog Output Waveform In this exercise, you will use the DAQ Assistant to build a LabVIEW VI that generates and outputs an analog waveform.
Certified LabVIEW Associate Developer Examination
 Certified LabVIEW Associate Developer Examination Examinee Date: Administrator Date: Note: The use of the computer or any reference materials is NOT allowed during the exam. Instructions: If you did not
LabVIEW Experiment 1 Light Sensor Calibration Using Arduino Data Acquisition (Arduino DAQ)
") Spring 2015 LabVIEW Experiment 1 Light Sensor Calibration Using Arduino Data Acquisition (Arduino DAQ) Experiment Objectives Experience LabVIEW capabilities through learning exercises that design and implement
Spring 2015 LabVIEW Experiment 1 Light Sensor Calibration Using Arduino Data Acquisition (Arduino DAQ) Experiment Objectives Experience LabVIEW capabilities through learning exercises that design and implement
Computer Interfacing Using LabView
 Computer Interfacing Using LabView Physics 258 Last revised September 25, 2005 by Ed Eyler Purpose: Note: To write a simple LabView program that digitizes data using an ADC on a data acquisition card,
LabVIEW. Table of Contents. Lesson 1. Pre-reqs/Technical Skills Basic computer use
 LabVIEW Lesson 1 Pre-reqs/Technical Skills Basic computer use Expectations Read lesson material Implement steps in software while reading through lesson material Complete quiz on Blackboard Submit completed
ENGR 1000, Introduction to Engineering Design
 ENGR 1000, Introduction to Engineering Design Unit 2: Data Acquisition and Control Technology Lesson 2.1: Programming Line Outputs for the NI USB-6008 in LabVIEW Hardware: 12 VDC power supply Several lengths
Lab Exercise 2: Data Acquisition with NI LabVIEW
 Objective When you have completed this exercise, you will be able: To use the DAQ Assistant to acquire analog data measurements with NI LabVIEW To use Write to Measurement express VI to log real time data
Lesson 4 Implementing a VI
 Lesson 4 Implementing a VI A. Front Panel Design B. LabVIEW Data Types C. Documenting Code D. While Loops E. For Loops F. Timing a VI G. Iterative Data Transfer H. Plotting Data I. Case Structures A. Front
LabVIEW basics. BME MIT János Hainzmann, Károly Molnár, Balázs Scherer, Csaba Tóth
 BME MIT 2007. János Hainzmann, Károly Molnár, Balázs Scherer, Csaba Tóth Table of contents REFERENCES...1 1. INTRODUCTION...2 1.1 VIRTUAL INSTRUMENTATION...2 1.2 VISUAL PROGRAMMING...2 2. GETTING STARTED...4
Lesson 1 Introduction to LabVIEW. TOPICS LabVIEW Environment Front Panel Block Diagram Dataflow Programming LabVIEW Help and Manuals Debugging a VI
 Lesson 1 Introduction to LabVIEW TOPICS LabVIEW Environment Front Panel Block Diagram Dataflow Programming LabVIEW Help and Manuals Debugging a VI 1 Virtual Instruments (VIs) Front Panel Controls = Inputs
LAB EXERCISE 3 Harmonic Balance Techniques
 ADS 2012 Circuit Simulation Techniques (v.2 - April 2013) LAB EXERCISE 3 Harmonic Balance Techniques Topics: Harmonic Balance simulations are covered including swept variables, 2-tone simulations, equations
CLAD Sample Exam 03. C. A control that output a cluster of the controls / indicators on the tabs.
 Name: Date: CLAD Sample Exam 03 1. Where can a VI be documented so that the description appears in the Show Context Help popup window? A. In the VI Properties Documentation window B. Typing in the Show
Engineering Project-I. Module 1: Familiarization of LabVIEW and the Vernier Toolkit
 Engineering Project-I Module 1: Familiarization of LabVIEW and the Vernier Toolkit PREPARED BY Academic Services Unit January 2012 Applied Technology High Schools, 2012 Module 1: Familiarization of LabVIEW
Small rectangles (and sometimes squares like this
 Lab exercise 1: Introduction to LabView LabView is software for the real time acquisition, processing and visualization of measured data. A LabView program is called a Virtual Instrument (VI) because it,
Introduction to LabVIEW
 Introduction to LabVIEW How to Succeed in EE 20 Lab Work as a group of 2 Read the lab guide thoroughly Use help function and help pages in LabVIEW Do the Pre-Lab before you come to the lab Don t do the
Linear Control Systems LABORATORY
 Islamic University Of Gaza Faculty of Engineering Electrical Engineering Department Linear Control Systems LABORATORY Prepared By: Eng. Adham Maher Abu Shamla Under Supervision: Dr. Basil Hamed Experiments
Start ADS and Create an Empty Project
 Start ADS and Create an Empty Project Look for a desktop icon or start menu item entitled Advanced Design System 2011 ADS will start up and you will see ultimately: ADS Session 1 click for new project
ME 224: EXPERIMENTAL ENGINEERING. Lecture 2
 ME 224: EXPERIMENTAL ENGINEERING Class: M 1:00-1:50 TECH: L170 Labs: T and Th 2:00-4:50 PM Ford Building : B100 Lecture 2 1 Introduction to Labview Labview (Laboratory Virtual Instruments Engineering Workbench)
Read Temperature Data
 Read Temperature Data Exercise 5 Completed front panel and block diagram In this exercise, you will create a program using SensorDAQ s Analog Express VI to collect temperature data and display it on a
Learn the three palettes. Learn how data is passed in LabVIEW. Create a subvi using two different methods.
 UNM The LabVIEW Programming Environment and Basic Operations Introduction In this hands-on, you will learn about the LabVIEW programming environment. You will also write a simple Virtual Instrument (VI)
Certified LabVIEW Associate Developer Exam. Test Booklet
 Certified LabVIEW Associate Developer Exam Test Booklet Instructions: If you did not receive this exam in a sealed envelope stamped "NI Certification," DO NOT ACCEPT this exam. Return it to the proctor
Strain and Force Measurement
 NORTHEASTERN UNIVERSITY DEPARTMENT OF MECHANICAL, INDUSTRIAL AND MANUFACTURING ENGINEERING MIMU 0-MEASUREMENT AND ANALYSIS Strain and Force Measurement OBJECTIVES The primary objective of this experiment
Advanced Programming Features
 Advanced Programming Features Compute Tools 4 and 5 Program Area Level 5 The two advance programming templates for manipulating data are Compute Tools 4 and Compute Tools 5. Each of these templates provide
UNIVERSITY OF CALIFORNIA BERKELEY Department of Electrical Engineering and Computer Sciences. B. E. BOSER Oscilloscopes EECS 100
 UNIVERSITY OF CALIFORNIA BERKELEY Department of Electrical Engineering and Computer Sciences B. E. BOSER Oscilloscopes EECS 100 Multimeters are convenient to check supply voltages and currents, bias levels,
Quick Start Guide Agilent Technologies 14565A Device Characterization Software for Windows 98, Windows NT 4.0, Windows 2000 and Windows XP
 Quick Start Guide Agilent Technologies 14565A Device Characterization Software for Windows 98, Windows NT 4.0, Windows 2000 and Windows XP sa Contents Description...3 System Requirements...3 Installing
Hands-on Lab 2: LabVIEW NI-DAQ Basics 2
 Hands-on Lab 2: LabVIEW NI-DAQ Basics 2 Recall that the final objective is position regulation using computer-controlled state feedback. Computer control requires both software, like LabVIEW and hardware,
UNIVERSITY OF CENTRAL FLORIDA DEPARTMENT OF ELECTRICAL ENGINEERING AND COMPUTER SCIENCE HEC 406 NANO/MEMS LABORATORY
 UNIVERSITY OF CENTRAL FLORIDA DEPARTMENT OF ELECTRICAL ENGINEERING AND COMPUTER SCIENCE HEC 406 NANO/MEMS LABORATORY HIGH TEMPERATURE & HIGH FREQUENCY TESTING SYSTEM LABORATORY USER MANUAL 4/29/2011 Overview
Homework Assignment 9 LabVIEW tutorial
 Homework Assignment 9 LabVIEW tutorial Due date: Wednesday, December 8 (midnight) For this homework assignment, you will complete a tutorial on the LabVIEW data acquistion software. This can be done on
How to Get Started. Figure 3
 Tutorial PSpice How to Get Started To start a simulation, begin by going to the Start button on the Windows toolbar, then select Engineering Tools, then OrCAD Demo. From now on the document menu selection
Learn LabVIEW 2010 / 2011 Fast
 Learn LabVIEW 2010 / 2011 Fast A Primer for Automatic Data Acquisition Douglas Stamps, Ph.D. SDC PUBLICATIONS Schroff Development Corporation Better Textbooks. Lower Prices. www.sdcpublications.com Visit
Table 1. Inputs and Outputs
 Goal Description Use a While Loop and an iteration terminal and pass data through a tunnel. Create a VI that continuously generates random numbers between 0 and 1000 until it generates a number that matches
Lab 4 - Data Acquisition
 Lab 4 - Data Acquisition 1/13 Lab 4 - Data Acquisition Report A short report is due at 8:00 AM on the Thursday of the next week of classes after you complete this lab. This short report does NOT need to
LabVIEW Express VI Development Toolkit User Guide
 LabVIEW Express VI Development Toolkit User Guide Version 1.0 Contents The LabVIEW Express VI Development Toolkit allows you to create and edit Express VIs, which you can distribute to users for building
Experiment 1: Introduction to Labview 2010 (tbc 1/7/2007, 1/13/2009,1/9/2012, 1/10/2012)
") Experiment 1: Introduction to Labview 2010 (tbc 1/7/2007, 1/13/2009,1/9/2012, 1/10/2012) Objective: To learn how to build virtual instrument panels in Labview 2010 Tasks: 1. Follow the tutorial given in
Experiment 1: Introduction to Labview 2010 (tbc 1/7/2007, 1/13/2009,1/9/2012, 1/10/2012) Objective: To learn how to build virtual instrument panels in Labview 2010 Tasks: 1. Follow the tutorial given in
Experiment 1 Electrical Circuits Simulation using Multisim Electronics Workbench: An Introduction
 Experiment 1 Electrical Circuits Simulation using Multisim Electronics Workbench: An Introduction Simulation is a mathematical way of emulating the behavior of a circuit. With simulation, you can determine
METRICS WIN4145. How Win4145 Stores Information. Project Files. The Win4145 Initialization File. Data and Plot Windows.
 METRICS WIN4145 REFERENCE GUIDE CONTENTS CHAPTER 1: A QUICK TOUR OF WIN4145 How Win4145 Stores Information Project Files The Win4145 Initialization File Data and Plot Windows The Menu Bars The Toolbar
USB Instruments EasyLogger for PS40M10 "Swordfish" Help
 USB Instruments EasyLogger for PS40M10 "Swordfish" Help I EasyLogger for PS40M10 Help Table of Contents Part I Introduction 3 1 Welcome to... EasyLogger for PS40M10 3 2 EasyLogger... Features 4 Part II
Lab 1: Getting familiar with LabVIEW: Part I
 Lab 1: Getting familiar with LabVIEW: Part I The objective of this first lab is to provide an initial hands-on experience in building a VI. For detailed explanations of the LabVIEW features mentioned here,
Experiment 1: Introduction to Labview 8.0 (tbc 1/7/2007, 1/13/2009,1/13/2011)
") Experiment 1: Introduction to Labview 8.0 (tbc 1/7/2007, 1/13/2009,1/13/2011) Objective: To learn how to build virtual instrument panels in Labview 8.0 Tasks: 1. Build the Labview VI shown in the tutorial
Experiment 1: Introduction to Labview 8.0 (tbc 1/7/2007, 1/13/2009,1/13/2011) Objective: To learn how to build virtual instrument panels in Labview 8.0 Tasks: 1. Build the Labview VI shown in the tutorial
Labview. Masood Ejaz
 Labview A Tutorial By Masood Ejaz Note: This tutorial is a work in progress and written specially for CET 3464 Software Applications in Engineering Technology, a course offered as part of BSECET program
SOUTHERN POLYTECHNIC S. U.
 SOUTHERN POLYTECHNIC S. U. ECET 1012 Laboratory Exercise #4 ELECTRICAL & COMPUTER ENGINEERING TECHNOLOGY Introduction to PSpice Name Lab Section Date Overview: This laboratory experiment introduces the
Hands-On Introduction to. LabVIEW. for Scientists and Engineers. Second Edition. John Essick. Reed College OXFORD UNIVERSITY PRESS
 Hands-On Introduction to LabVIEW for Scientists and Engineers Second Edition John Essick Reed College New York Oxford OXFORD UNIVERSITY PRESS Contents. Preface xiii 1. THE WHILE LOOP AND WAVEFORM CHART
Labview Lab 2. Vern Lindberg. April 16, 2012
 Labview Lab 2 Vern Lindberg April 16, 2012 1 Temperature Measurement Thermistors are sensitive semiconductor devices that can measure temperature over a restricted temperature range. The thermistors we
GETTING STARTED WITH ADS
 ADS Startup Tutorial v2 Page 1 of 17 GETTING STARTED WITH ADS Advanced Design System (ADS) from Agilent Technologies is an extremely powerful design tool for many aspects of electrical and computer engineering
Tutorial: Getting Started with the LabVIEW Simulation Module
 Tutorial: Getting Started with the LabVIEW Simulation Module - LabVIEW 8.5 Simulati... Page 1 of 10 Cart Help Search You are here: NI Home > Support > Product Reference > Manuals > LabVIEW 8.5 Simulation
Determination of Drag Coefficient
 DEPARTMENT OF MECHANICAL, INDUSTRIAL AND MANUFACTURING ENGINEERING MIMU 505 - MEASUREMENT AND ANALYSIS Determination of Drag Coefficient You will need to bring a zip disk or USB storage device to the lab
Arrays. Collection of data elements that are of same type
 Arrays Collection of data elements that are of same type 31 One or more dimensions, up to 2 elements per dimension Elements accessed by their index First element is index 0 index 10-element array 0 1 2
Exercise 0 - Open and Run a Virtual Instrument (Slide 12)
") Exercise 0 - Open and Run a Virtual Instrument (Slide 12) Examine the Signal Generation and Processing VI and run it. Change the frequencies and types of the input signals and notice how the display on
Exercise 0 - Open and Run a Virtual Instrument (Slide 12) Examine the Signal Generation and Processing VI and run it. Change the frequencies and types of the input signals and notice how the display on
Getting Started with the LabVIEW Real-Time Module
 Getting Started with the LabVIEW Real-Time Module Contents This document provides exercises to teach you how to develop a real-time project and VIs, from setting up RT targets to building, debugging, and
PHYS 5061 Lab 6 Programmable Instruments
 Introduction PHYS 5061 Lab 6 Programmable Instruments This lab introduces the computer control of bench lab instruments for data acquisition and uses a programmable digital multimeter as part of a measurement
2 Lab 2: LabVIEW and Control System Building Blocks
 2 Lab 2: LabVIEW and Control System Building Blocks 2.1 Introduction Controllers are built from mechanical or electrical building blocks. Most controllers are implemented in a program using sensors to
University of Florida EEL 3701 Dr. Eric M. Schwartz Department of Electrical & Computer Engineering Revision 0 12-Jun-16
 Page 1/14 Quartus Tutorial with Basic Graphical Gate Entry and Simulation Example Problem Given the logic equation Y = A*/B + /C, implement this equation using a two input AND gate, a two input OR gate
OpenStax-CNX module: m Thermometer VI * National Instruments
 OpenStax-CNX module: m12209 1 Thermometer VI * National Instruments This work is produced by OpenStax-CNX and licensed under the Creative Commons Attribution License 1.0 Exercise 1 Complete the following
Pre-Lab Excel Problem
 Pre-Lab Excel Problem Read and follow the instructions carefully! Below you are given a problem which you are to solve using Excel. If you have not used the Excel spreadsheet a limited tutorial is given
Labview for Everyone (National Instruments Virtual Instrumentation Series) Jeffrey Travis
 Jeffrey Travis") Labview for Everyone (National Instruments Virtual Instrumentation Series) Jeffrey Travis Table of Contents Preface. FUNDAMENTALS. 1. INTRODUCTION-WHAT IN THE WORLD IS LabVIEW? What Exactly Is LabVIEW,
Labview for Everyone (National Instruments Virtual Instrumentation Series) Jeffrey Travis Table of Contents Preface. FUNDAMENTALS. 1. INTRODUCTION-WHAT IN THE WORLD IS LabVIEW? What Exactly Is LabVIEW,
EKT 314/4 LABORATORIES SHEET
 EKT 314/4 LABORATORIES SHEET WEEK DAY HOUR 2 2 2 PREPARED BY: EN. MUHAMAD ASMI BIN ROMLI EN. MOHD FISOL BIN OSMAN JULY 2009 14 operations pass data to and from files. Use the VIs and functions to handle
Advanced Design System 1.5. Data Display
 Advanced Design System 1.5 Data Display December 2000 Notice The information contained in this document is subject to change without notice. Agilent Technologies makes no warranty of any kind with regard
II. LAB. * Open the LabVIEW program (Start > All Programs > National Instruments > LabVIEW 2012 > LabVIEW 2012).
.") II. LAB Software Required: NI LabVIEW 2012, NI LabVIEW 4.3 Modulation Toolkit. Functions and VI (Virtual Instrument) from the LabVIEW software to be used in this lab: For Loop (Function), Unbundle By Name
II. LAB Software Required: NI LabVIEW 2012, NI LabVIEW 4.3 Modulation Toolkit. Functions and VI (Virtual Instrument) from the LabVIEW software to be used in this lab: For Loop (Function), Unbundle By Name
NI LabView READ THIS DOCUMENT CAREFULLY AND FOLLOW THE INSTRIUCTIONS IN THE EXERCISES
 NI LabView READ THIS DOCUMENT CAREFULLY AND FOLLOW THE Introduction INSTRIUCTIONS IN THE EXERCISES According to National Instruments description: LabVIEW is a graphical programming platform that helps
VME Data Acquisition System, ADC Read
 VME Data Acquisition System, ADC Read Abstract: UTA-HEP/LC 0023 Shashwat Udit University of Texas at Arlington August 25, 2008 This document presents the design concept and the functionality of the newly
Hardware: Acquiring Data and Communicating with Instruments
 Hardware: Acquiring Data and Communicating with Instruments 4 Acquiring a Signal This chapter introduces you to the Express VIs you use to acquire data and communicate with instruments on Windows. These
Getting Results with CompactRIO and LabVIEW
 Getting Results with CompactRIO and LabVIEW Getting Started This tutorial demonstrates how to develop a CompactRIO application in LabVIEW. The application uses a CompactRIO R Series Expansion system or
SCHEMATIC DESIGN IN QUARTUS
 SCHEMATIC DESIGN IN QUARTUS Consider the design of a three-bit prime number detector. Figure 1 shows the block diagram and truth table. The inputs are binary signals A, B, and C while the output is binary
PSpice Tutorial. Physics 160 Spring 2006
 PSpice Tutorial This is a tutorial designed to guide you through the simulation assignment included in the first homework set. You may either use the program as installed in the lab, or you may install
Figure 1: ADE Test Editor
 Due to some issues that ADE GXL simulation environment has (probably because of inappropriate setup), we will run simulations in the ADE L design environment, which includes all the necessary tools that
NI PXI Contents CALIBRATION PROCEDURE
 CALIBRATION PROCEDURE NI PXI-5422 Contents This document contains step-by-step instructions for writing a calibration procedure for the NI PXI-5422 arbitrary waveform generator. Conventions... 1 Introduction...
Ch En 475: Introduction to Instrumentation and Signal Processing with Labview
 Ch En 475: Introduction to Instrumentation and Signal Processing with Labview Measurement Instrumentation Rapid, on-line measurement of temperature, pressure, liquid level, flow rate and composition is
DC Circuit Simulation
 Chapter 2 DC Circuit Simulation 2.1 Starting the Project Manager 1. Select Project Manager from the Start All Program Cadence Release 16.5 Project Manager. 2. Select Allegro PCB Designer (Schematic) from
Getting Started with LabVIEW Virtual Instruments
 Getting Started with LabVIEW Virtual Instruments Approximate Time You can complete this exercise in approximately 30 minutes. Background LabVIEW programs are called virtual instruments, or VIs, because
Workshop 5-1: Dynamic Link
 Workshop 5-1: Dynamic Link 2015.0 Release ANSYS HFSS for Antenna Design 1 2015 ANSYS, Inc. Overview Linear Circuit Overview Dynamic Link Push Excitations Dynamic Link Example: Impedance Matching of Log-Periodic
ni.com Preparing for the CLAD Exam
 Preparing for the CLAD Exam Breaking Data Flow Situation: Run 2 Loops simultaneously with 1 Stop Button Wiring the Stop Button from one Loop to the other will NOT work. Solution: Use a Local Variable Drawbacks:
CLAD Exam Preparation Guide using LabVIEW NXG
 CLAD Exam Preparation Guide using LabVIEW NXG This prep guide prepares you to take the CLAD exam using LabVIEW NXG if you registered to take the exam on or after July 31, 2017. If you want to take the
CLAD_80.questions.
 CLAD_80.questions Number: CLAD Passing Score: 800 Time Limit: 120 min File Version: 25.06 These are the most accurate study questions. Just focus on these and sit in your exam. I am very happy with my
LabVIEW programming I
 FYS3240 PC-based instrumentation and microcontrollers LabVIEW programming I LabVIEW basics Spring 2011 Lecture #2 Bekkeng 13.1.2011 Virtual Instruments LabVIEW programs are called virtual instruments,
Getting Started: Creating and Executing a Test Setup. Step 1: Cable the Hardware Connections. Step 2: Connect the HP4145 Instrument Driver
 METRICS TECHNOLOGY WIN4145 GETTING STARTED GUIDE CONTENTS Getting Started: Creating and Executing a Test Setup Step 1: Cable the Hardware Connections Step 2: Connect the HP4145 Instrument Driver Step 3:
Today. 4/5/11 Physics 262 Lecture 10 Questions about Exams Homework. Lab: Continue project. Lecture. Review your exams and review practice exam again.
 Today 4/5/11 Physics 262 Lecture 10 Questions about Exams Homework Review your exams and review practice exam again. Lab: Continue project Do pre-lab before lab. See last weeks handout. Requires use of
Basic Data Acquisition with LabVIEW
 Basic Data Acquisition with LabVIEW INTRODUCTION This tutorial introduces the creation of LabView Virtual Instruments (VI s), in several individual lessons. These lessons create a simple sine wave signal,
Introduction to LabVIEW
 University College of Southeast Norway Introduction to LabVIEW Hans-Petter Halvorsen, 2016-09-07 http://home.hit.no/~hansha Preface This document explains the basic concepts of LabVIEW. You find additional
Virtual Instruments with LabVIEW
 Telemark University College Department of Electrical Engineering, Information Technology and Cybernetics Virtual Instruments with LabVIEW HANS-PETTER HALVORSEN, 2011.01.04 Faculty of Technology, Postboks
Part 1. Creating an Array of Controls or Indicators
 NAME EET 2259 Lab 9 Arrays OBJECTIVES -Write LabVIEW programs using arrays. Part 1. Creating an Array of Controls or Indicators Here are the steps you follow to create an array of indicators or controls
USING THE VENABLE RLC WINDOWS SOFTWARE VERSION 4.5
 USING THE VENABLE RLC WINDOWS SOFTWARE VERSION 4.5 FOR MODELS 350/3120/3215/3225/3235 AND Series 43xx/51xx/63xx/74xx/88xx/350c System Venable Instruments 8656 SH 71 West, Bldg. E Cuesta Center Austin,
Introduction to LabVIEW
 Introduction to LabVIEW 1 Introduction 1.1 Aims The following material is a short introduction to LabVIEW and it aims for you to: familiarise with the LabVIEW programming environment including front panel
UNIVERSITI MALAYSIA PERLIS
 UNIVERSITI MALAYSIA PERLIS SCHOOL OF COMPUTER & COMMUNICATIONS ENGINEERING EKT 124 LABORATORY MODULE INTRODUCTION TO QUARTUS II DESIGN SOFTWARE : INTRODUCTION TO QUARTUS II DESIGN SOFTWARE OBJECTIVES To
BE/EE189 Design and Construction of Biodevices Lecture 5. BE/EE189 Design and Construction of Biodevices - Caltech
 BE/EE189 Design and Construction of Biodevices Lecture 5 LabVIEW Programming Data acquisition DAQ system Signals and signal conditioning Nyquist frequency NI ELVIS II NI-DAQmx and DAQ assistant LabVIEW
Cadence Tutorial A: Schematic Entry and Functional Simulation Created for the MSU VLSI program by Andrew Mason and the AMSaC lab group.
 Cadence Tutorial A: Schematic Entry and Functional Simulation Created for the MSU VLSI program by Andrew Mason and the AMSaC lab group. Revision Notes: Aug. 2003 update and edit A. Mason add intro/revision/contents
Xilinx Tutorial Basic Walk-through
 Introduction to Digital Logic Design with FPGA s: Digital logic circuits form the basis of all digital electronic devices. FPGAs (Field Programmable Gate Array) are large programmable digital electronic
Revision Notes: July2004 Generate tutorial for single transistor analysis. Based on existing schematic entry tutorial developed for ECE410
 Cadence Analog Tutorial 1: Schematic Entry and Transistor Characterization Created for the MSU VLSI program by Professor A. Mason and the AMSaC lab group. Revision Notes: July2004 Generate tutorial for
CLAD Sample Exam 04. B. When you create an Array constant on the Block Diagram, it is not visible on the Front Panel.
 Name: Date: CLAD Sample Exam 04 1. What VI is typically used to terminate an Error Cluster wire and to display any error message? A. Merge Errors B. One Button Dialog / Two Button Dialog C. Generate Front