Nigerian Telecommunications Sector
|
|
|
- Miles Webb
- 5 years ago
- Views:
Transcription

1 Nigerian Telecommunications Sector (SUMMARY REPORT: DECEMBER 2016) Report Date: January 2017 Data Source: National Bureau of Statistics / Nigerian Communication Commission (NCC)
2 Contents Telecommunications in GDP and growth 1 Subscribers as of September Subscribers by Technology Type 3 Mobile Subscribers (GSM) 3 Mobile Subscribers (CDMA) 5 Fixed Wireless Line 6 Fixed Wired Line 6 VoIP 8 Internet Subscriptions 8 GSM internet subscriptions 8 CDMA internet subscriptions 10 Porting Activities 10 Incoming 11 Outgoing 12 Net Porting Activities 12 Infographics 14 Appendix - Tables 18 Methodology and Advice to Users of Our Reports 20 Acknowledgements and Contacts 21

3 Telecommunications Data The telecommunications data used in this report were obtained from the National Bureau of Statistics (NBS) and the Nigerian Communication Commission (NCC). Variables obtained from NBS include Gross Domestic Product contribution and growth, whilst NCC indicators include those on subscribers to mobile and internet services by provider, porting activities and information on tariffs. All data are subject to amendments by NCC and should be treated as preliminary. Telecommunications in GDP and Growth In real terms, the telecommunications sector contributed N 1,399 billion to GDP in the third quarter of 2016, or 8.0%, which represents a decrease of 1.8% points relative to the previous quarter. However, due to differing seasonal patterns, telecommunications tends to account for the lowest share of GDP in the third quarter. The share of telecommunications in total real GDP had declined throughout 2010 to 2014, but for the last six quarters growth in telecommunications has been higher, meaning the trend has reversed. Although growth in the telecommunications sector remained positive, in contrast with the economy as a whole, year on year growth nevertheless dropped in real terms from 1.5% in the previous quarter to 0.9%, the lowest rate since 2011 Q3. Figure 1: Percentage Contribution of telecommunication to constant price GDP, and annual growth 1

4 Subscribers as of September 2016 The total number of subscribers has increased rapidly over the past decade; at the end of 2005 there were 19,519,154 subscribers, but by the end of 2015 there were 151,017,244, which is equivalent to an increase of 13,149,809 every year. However, growth has been declining recently,possibly resulting from high market penetration leaving less room for large expansion. In December 2016 the end of the fourthquarter there were 154,529,780 subscribers, compared with 153,299,535 in September 2015, which represents a quarterly increase of 0.80%. Growth had continued unabated since April, before which subscriber numbers had fallen for several months. The yearly increase in total subscriber numbers was 2.33%, which is slightly higher than the yearly increase of 1.75% recorded in the previous quarter. Last quarter's growth rate has been revised up slightly (from 1.73%) following the inclusion of VoIP services, in addition to the four services (GSM, CDMA, Fixed Wired and Wireless) discussed in previous reports. The numbers are small relative to the total, possibly due to the service being newer. As in the previous quarter, the increase in subscriber numbers was despite a quarterly fall in CDMA subscribers of 21.26%, which compounded previous quarterly falls leading to year on year fall of 89.87% in December, a fall surpassed only by the year on year fall of 89.88% in November. The number of fixed wireless subscribers also recorded a large decline, of 12.54% compared to the previous quarter and 55.03% year on year. However, by far the most popular technology type is GSM, and therefore this technology type has a much larger effect on movements in the total number of subscribers. Figure 2: Total number of subscribers each month, Dec 2015 Dec 2016 Source: NBS, NCC Note: Y-axis has been truncated 2
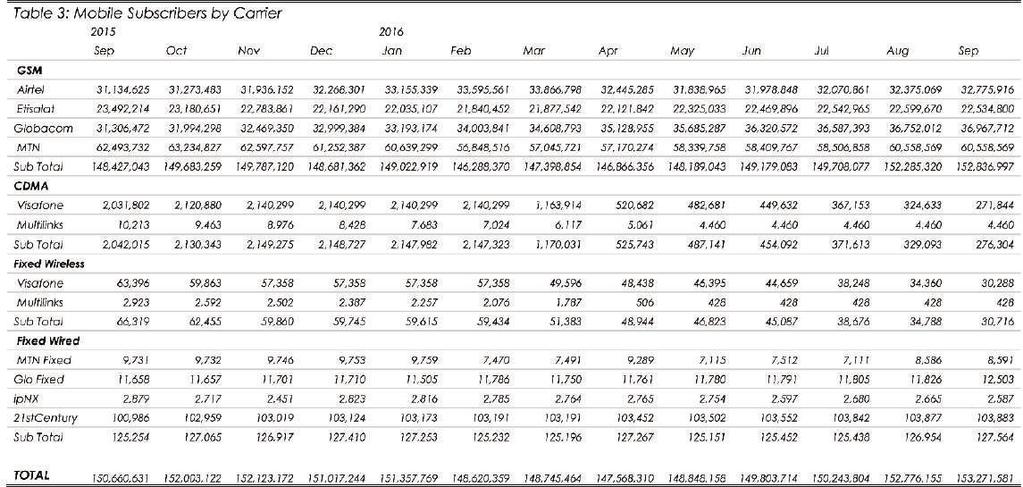
5 Subscribers by Technology Type In contrast to previous publications, subscriber data is broken into five sections according to the technology type used, following the inclusion of the newer VoIP technology by NCC.This stands for Voice over Internet Protocol, and so far, the only provider recorded by NCC is Smile. The other technology types include twomobile technologies (Global System for Mobile Communications (GSM)and Core Division Multiple Access (CDMA)) and two fixed lines, either wireless or wired.mobile subscribers using GSM dominate, and accounted for 99.74% of the total in December 2016, followed by CDMA with 0.14% of the total, whist fixed wired and wireless make up 0.08% and 0.02% respectively.voip also accounted for 0.02%. The dominance of GSM users has increased since December 2015 when 96.22% of subscribers used this technology type; largely as a result of the continuing decline of CDMA users. The number of subscribers using fixed wireless lines has also decreased sharply, although this was from a low level and therefore only had a small effect on the total. The proportion of fixed wired lines remained relatively stable. The dominance of GSM over CDMA in the mobile technology is characteristic worldwide; GSM accounted for over 80% of the global market in 2009 Q2 according to industry estimates. With GSM technology, it is cited as being easier to switch networks, and it is regarded as being more accessible for international use, especially given that some markets (such as in Europe) have mandated the technology by law. However, CDMA is more prevalent in the United States. Mobile Subscribers (GSM) In December 2016, the total number of GSM subscribers was 154,124,602, an increase of 5,443,240, or 3.66% relative to December This is 0.69% points higher than the year on year increase in the previous quarter. The number of GSM subscribers has now increased in every month since April. Compared to the previous quarter, there were 1,287,605 more GSM subscribers in December, at the end of the fourth quarter, an increase of 0.84%. The largest quarterly increase recorded by any GSM provider was Airtel, whose number increased by 4.09%, from 32,775,916 to 34,116,409. By contrast, Etisalat recorded their largest quarterly decrease in subscriber numbers yet, of 7.65%, and were the only company to record a decrease in December. 3
6 As a result, there were 20,809,889 Etisalat subscribers, compared with 22,534,800 at the end of the last quarter. Globacom and MTN had 37,357,843 and 61,840,461 subscribers respectively, and recorded quarter on quarter growth of 1.06% and 2.12%. Broadly speaking, the year on year performance was similar to the quarterly performance of GSM providers. Etisalat was the only provider to record a decline in subscriber numbers, of 1,351,401, or 6.10%. Airtel gained 1,848,108 subscribers, a yearly increase of 5.73%. MTN gained 588,704 subscribers, an increase of 0.96% year on year. The largest yearly increase in the number of subscribers however was Globacom, who recorded an increase of 4,358,459 subscribers, or 13.21%. This accounted for 80% of the total increase in GSM subscribers, despite MTN remaining the larger provider. Figure 3: GSM subscribers relative to Dec 2015 by provider, Dec 2015 Sep2016 These trends did not change the overall ranking of GSM providers in terms of size. MTN accounted for 40.12% of subscribers; a slightly smaller share of the market than at the end of 2015, but larger than in any intervening quarters. Etisalat also recorded a decline in its market share relative to the previous year, and in December 2016 accounted for 13.50% of subscribers. Airtel and Globacom both increased their shares over the same period, to 22.14% and 24.24% respectively. Globacom's increase was larger however, at 2.04% points, compared to 0.43% points for Airtel. 4

7 Figure 4: Share of total GSM subscribers by provider, Dec 2016 Mobile Subscribers (CDMA) In December 2016, at the end of the third quarter of 2016, there were 217,566 CDMA subscribers, which represents a decline of 21.26% relative to the end of the previous quarter. However, this decline was less significant than those recorded in previous quarters: in the second and third quarter the number declined by 61.19% and 39.15% respectively. As a result of these quarterly declines, the number of CDMA subscribers fell from 2,148,727 in December 2015, to 217,566 in December 2016, a decline of 89.87%. The number of Multilinks subscribers remained unchanged relative to the previous quarter, at 4,460. This has been the number of Multilinks subscribers recorded by NCC since May The quarterly decline therefore entirely resulted from the number of Visafone subscribers falling from 271,844 in September to 213,106 in December 2016, a decline of 21.61%. However, both providers recorded year on year falls, of 90.04% for Visafone and 47.08% for Multilinks. Despite the larger yearly fall recorded by Visafone, they remain the dominant CDMA provider. Their share was 97.95% in December 2016, slightly lower than the shares of 98.39% in September 2016 and of 99.61% in December

8 Fixed Wireless Line As with CDMA subscribers, the number of fixed wireless line subscriptions fell in December 2016, by 12.54% relative to September 2016, and by 55.03% relative to December Since September 2015, the number of fixed wireless subscribers has fallen every month, except for December 2016 in which there was no change. As with CDMA subscribers, the number of Multilinks subscribers recorded by NCC has remained the same since May 2016, at 428, and therefore this provider recorded no quarterly change. Visafone however recorded a quarterly decline of 12.71%. Year on year, Multilinks recorded a much larger decline than Visafone, of 82.07% compared to 53.91%, although in absolute terms Visafone's decline was greater, given the larger number of Visafone subscribers. Given these trends, Visafone's share of fixed wireless subscriptions was 98.41%, compared to 98.61% in September 2016 and 96.00% in the December of the previous year. Figure 5: Share of Fixed Wireless line subscribers, by provider, Dec 2015 Dec 2016 Fixed Wired Line Compared to subscribers with other technology types, the number of fixed wired line subscribers remained stable. There were 127,648 subscribers in December 2016, only 0.19% more than the 127,564 recorded in September, and only 0.07% more than the 127,410 recorded in December of the previous year. 6

9 This stability in the overall number masks large changes in subscriber numbers with each provider. The largest change was with MTN, who recorded a quarterly decline of 24.40%, and a yearly decline of 33.41%, and recorded 6,495 subscribers in December IpNX also saw declines in their subscriber numbers, with a quarterly decline of 4.60% and a yearly decline of 12.58%, and therefore recorded 2,498 subscribers in December In percentage terms, the increases in subscriber numbers of the remaining two providers were considerably smaller, however due to the relative size of each provider, the increases were slightly larger in absolute terms, resulting in a small increase overall in fixe wired line subscriptions. There were 12,643 Glo Fixed subscribers in December 2016, an increase of 1.12% relative to the previous quarter and of 7.97% relative to the previous year. 21st Century had 106,042 subscribers, a quarterly increase of 2.08% and a yearly increase of 2.83%. These movements represented a continuation of trends seen in previous quarters. 21st Century, already by far the largest provider, increased its share of the fixed wired market to 83.07%, from 81.44% in September 2016 and 80.94% in December Similarly, Glo Fixed increased its share to 9.90%, from 9.80% in September 2016 and 9.19% in December 2015, entrenching its position as the second largest provider. MTN Fixed and IpNX each recorded declines in their market share; MTN's share was 5.09% in December 2016, compared with 6.73% in September 2016 and 7.65% in December 2015, and IpNX's share was 1.93%, compared to 2.03% and 2.22% in the corresponding periods. Figure 6: Share of total Fixed Wired Line subscriptions, by provider, Dec

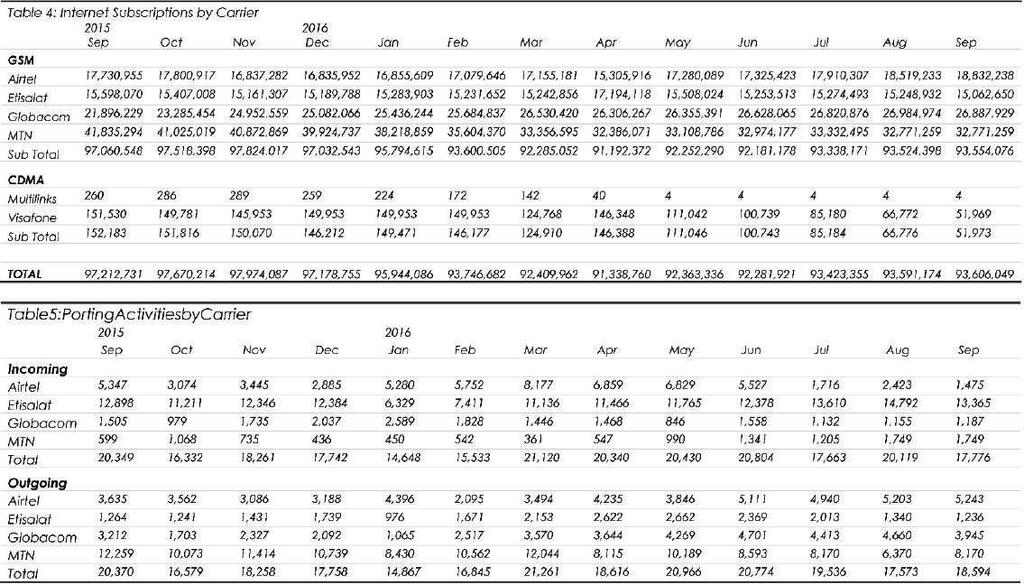
10 VoIP NCC has started to record a fifth technology, VoIP (Voice over Internet Protocol). Currently, the only provider recorded is Smile. The first month in which Smile recorded subscribers was July 2016, in which month they had 18,262. This increased steadily and consistently until November, when 33,142 subscribers were recorded. In December the number fell slightly, to 33,099, but this still represented growth of 18.41% relative to the end of the previous quarter in September, when there were 27,954 subscribers. GSM internet subscriptions Of GSM users, a total of 91,880,032 had an internet subscription with one of the four carriers of Airtel, Etisalat, Globacom and MTN in December This means that of all active GSM lines, 59.61% had an internet subscription. This proportion had been increasing throughout 2014 and 2015, but this trend reversed in 2016, in which year the proportion fell in every quarter. In December2015, the proportion was 65.26%, and in September 2016 the proportion was 61.21%. This was largely a result of a decline in MTN internet subscribers, although in recent quarters the decline in Etisalat internet subscribers has also contributed. Figure 7: GSM Subscribers and internet subscriptions, Dec 2015 Dec

11 In contrast to the previous quarter, there was a decline in GSM subscriptions relative to the previous quarter. This decline was driven by both MTN and Etisalat. The latter provider recorded a larger quarterly decline in percentage terms, of 8.70% compared to 3.11% for MTN. However, given MTN's larger size, the declines were more similar in absolute terms. In December 2016 Etisalat had 13,752,940 internet subscribers, and MTN recorded 31,753,369 as a result. Airtel and Globacom both recorded increases, although these were smaller both in percentage and in absolute terms. Airtel had 19,363,545 internet subscribers in December 2016, an increase of 2.82% relative to the end of the previous quarter. Globacom's increase was smaller; the number of internet subscribers with this provider was 27,010,178 in December 2016, which represents a quarterly increase of 0.45%. Year on year the picture was similar. MTN and Etisalat recorded large declines in their internet subscriber numbers, of 20.47% and 9.46% respectively. Airtel recorded the largest increase, of 15.01%, followed by Globacom with an increase of 7.69%. Although the ranking of providers remained the same in terms of internet subscription numbers, the gap continued to narrow between MTN, the largest, and Globacom, the second largest. In December 2015, MTN's share was 41.15% and Globacom's was 25.85%. However, by December 2016, MTN's had fallen to 34.56%, and Globacom's had increased to 29.40%, meaning the gap had fallen by roughly two thirds. Etisalat had always been the smallest provider, and in December their share fell to 14.97%, compared to 15.65% in the previous December. By contrast, Airtel increased their share from 17.35% to 21.07% over the same period. Figure 8: Internet subscribers with GSM technology, by company, Dec 2015 Dec
12 CDMA internet subscriptions The ratio of internet subscriptions to mobile subscriptions among CDMA providers remains low relative to GSM subscribers, and decreased further in the final quarter of 2016, to 13.93% in December from 18.81% in September Although the number of CDMA mobile subscriptions fell by 21.26% over this period, the number of internet subscriptions fell by 41.68%, from 51,973 to 30,309. Year on year the fall was less significant than in the number of CDMA mobile subscriptions however, at 79.82% compared to 89.87%. Consequently, the ratio was higher than at the end of the fourth quarter of 2015, of 6.99%. Nevertheless, GSM continues to entrench is position as the favoured technology type for internet connections As for the number of mobile subscriptions, the number of Multilinks internet subscribers has remained unchanged since May 2016, at 4, according to NCC. This compares to 259 in December 2015, a year on year decline of 98.46%. However, this decline has not had a large effect on the overall movement, as the number was already small compared to the number of Visafone internet subscriptions. Visafone had 30,305 internet subscribers as of December 2016, at the end of the fourth quarter. This represents a quarterly decline of 41.69%, and a yearly decline of 79.79%, from 149,953 in December This decrease was still smaller than the year on year decrease in the number of Visafone mobile subscribers however (90.04%) and therefore the ratio of internet to mobile subscriptions with Visafone increased from 7.01% to 14.22%. Porting Activities Porting activities refer to the transferal of subscribers to different network carriers. Therefore, incoming porting activities refer to those subscribers that have joined a network, whilst outgoing porting activities refer to those whom have left.the final quarter of 2016 recorded adecrease in the amount of porting activity, both relative to the third quarter of 2016 and the final quarter of

13 Incoming There was a total of 49,547 incoming porters in the fourth quarter of 2016 (across all three months). This compares with a total of 55,558 in the third quarter, and 52,335 in the fourth quarter of 2016, decreases of 5.33% and 10.82% respectively. Quarter on quarter, every provider recorded a decline in incoming porting activity. As in the previous quarter, Airtel recorded the largest declines in percentage terms, with quarterly and year on year declines of 38.65% and 63.38% respectively. However, these declines were both smaller than those recorded in the previous quarter, and the decline in incoming porters switching to Etisalat was larger in absolute terms despite the fall being only 8.04%, due to the greater number of incoming porters to this provider. Globacom and MTN recorded quarterly declines of 4.52% and 6.97% respectively. However, MTN nevertheless recorded a year on year increase of 95.40%, or nearly double. Etisalat recorded a year on year increase of 6.87%, but Globacom recorded a year on year decrease of 30.18%. Etisalat remained the top destination for incoming porters, and accounted for 77.52%, compared to 75.18% in the previous quarter. Airtel, Globacom and MTN accounted for 6.95%, 6.69% and 8.83% respectively in the final quarter of Figure 9: Summary of Porting Activities, Q
14 Outgoing There was a total of 47,871 outgoing porters in the fourth quarter of 2016, a decrease of 14.06% relative to the 55,703 outgoing porters recorded in the previous quarter, and a decrease of 8.98% relative to the 52,595 recorded in the third quarter of Only Airtel saw an increase in outgoing porters compared to the previous quarter, of 2.43%, to reach 15,760 in the final quarter of By contrast, the largest decline in outgoing porters was recorded by MTN, whose number fell by 27.33% to reach 16,504. Etisalat and Globacom recorded declines of 2.57% and 14.46% respectively, to reach numbers of 4,471 and 11,136 in the final quarter of The year on year picture was markedly different, with Airtel and Globacom both recording large increases in the number of outgoing porters, of 60.23% and 81.90% respectively. Etisalat saw a smaller increase, of 1.36%, which meant that MTN was the exception as the only provider to witness a decrease, of 48.79%. These trends narrowed the gap between providers in terms of share of outgoing porters. Previously MTN accounted for by far the most; in the final quarter of 2015 this provider accounted for 67.32% of outgoing porting activity, but this fell to 34.48% in the final quarter of By contrast, Airtel's share increased from 20.55% to 32.92% over the same period. Etisalat and Globacom recorded shares of 9.34% and 23.26% in the final quarter of 2016 respectively, compared to 9.21% and 12.79% in the same quarter of Net Porting Activities In the final quarter of 2016 Etisalat remained the largest beneficiary of porting activities; this was despite a fall from 37,178 to 33,940 between the third and final quarters of 2016 in net terms.although they saw a fall in outgoing porters, the fall in the number of porters switching to Etisalat was greater. All other providers recorded net losses from porting activities. For the first time on record, MTN was not the provider to lose out the most from porting activities. In net terms, they lost 12,129 porters, compared to a net loss of 12,316 porters for Airtel. These numbers compare to net losses of 9,772 for Airtel, and 18,007 for MTN in the third quarter of
15 The change in net porting activity for Globacom was the smallest, they recorded a net loss of 9,544 in the third quarter, and this fell to 7,819 in the final quarter of Figure 10: Net Porting Activities by provider, Dec 2015 Dec
16 Infographics Subscribers as of September 2016 The total number of subscribers has increased rapidly over the past decade Subscribers at the end of 2005 Subscribers at the end of ,519, ,017,244 Equivalent to an increase of 13,149,809 every year In December 2016 the end of the fourth quarter there were 154,529,780 subscribers, compared with 153,299,535 in September 2015, which represents a quarterly increase of 0.80% 14
17 Subscribers by Technology Type Mobile Subscribers (GSM) In December 2016, the total number of GSM subscribers was 154,124,602, an increase of 5,443,240, or 3.66% relative to December Mobile Subscribers (CDMA) In December 2016, at the end of the third quarter of 2016, there were 217,566 CDMA subscribers, which represents a decline of 21.26% relative to the end of the previous quarter. Fixed Wireless Line The number of fixed wireless line subscriptions fell in December 2016, by 12.54% relative to September 2016, and by 55.03% relative to December Fixed Wired Line There were 127,648 subscribers in December 2016, only 0.19% more than the 127,564 recorded in September, and only 0.07% more than the 127,410 recorded in December of the Mobile Subscribers (CDMA) NCC has started to record a fifth technology, VoIP (Voice over Internet Protocol). Currently, the only provider recorded is Smile. In December the number fell slightly, to 33,099, but this still represented growth of 18.41% relative to the end of the previous quarter in September, when there were 27,954 subscribers. 15
18 Internet Subscriptions GSM internet subscriptions By December 2016 MTN's market share had fallen to 34.56% Globacom's market share had increased to 29.40% meaning the gap had fallen by roughly two thirds. Etisalat s Market share fell to 14.97%, compared to 15.65% in the previous December. Airtel s increased their Market share from 17.35% to 21.07% over the same period CDMA internet subscriptions The ratio of internet subscriptions to mobile subscriptions among CDMA providers remains low relative to GSM subscribers. Decreased further in the final quarter of 2016, to 13.93% in December from 18.81% in September GSM continues to entrench is position as the favoured technology type for internet connections The number of Multilinks internet subscribers has remained unchanged since May 2016, at 4, according to NCC. Visafone had 30,305 internet subscribers as of December 2016, at the end of the fourth quarter. 16
19 Mobile Subscribers (GSM) Market Share As at December 2016, the total number of GSM subscribers was 154,124,602, an increase of 5,443,240, or 3.66% relative to December MTN accounted for 40.12% of GSM subscribers. Globacom increased its market shares to 24.24% Etisalat accounted for 13.50% of subscribers. Airtel increased its market shares to 22.14% 17
20 18
21 19
22 Methodology and Advice to Users of Our Reports Methodology The telecommunications data used in this report were obtained from the National Bureau of Statistics (NBS) and the Nigerian Communication Commission (NCC). ADVICE TO USERS OF THIS REPORT You are given the limited right to print this report and to distribute it by any means. You can print out pages and share/use them in your private discussion groups as long as you acknowledge NBS and you do not alter the report in any way. NBS is not responsible for any errors, omissions or representations on any of the pages in this report. Our report, opinions and analysis are based on best practice methodology and sources believed to be reliable and are written in good faith, but no representation or warranty, expressed or implied, is made as to their accuracy or completeness. The information in this report is updated from time to time. We encourage everyone to use the information in the report as a resource only to further their own research on all featured entities. This material is based upon information that we consider reliable, credible and factual but we do not represent that it is accurate or complete, as such. Any information, opinions, advice or offers posted by any person or entity logged in to the NBS's website associated sites is to be construed as public conversation only. In delivering this report, the NBS works with and through organisations with distinct service competencies in data presentation. NBS takes extra steps to ensure that information provided by it are accurate, fact checked and validated for compliance with internationally acceptable standards and practices. While this report is checked for accuracy, we are not liable for any incorrect information included. We are always happy to receive your comments on how we can improve on this report. Should you be interested in contacting us for further discussions on how such reports can be made more meaningful to you or your organization? Kindly contact feedback@nigerianstat.gov.ng 20

23 Acknowledgements/Contacts Acknowledgements We acknowledge the contributions of our strategic partner the Nigerian Communications Commission and our technical partner, Proshare in the design, concept and production of this publication. Contact NBSNigeria Head Office Address Plot 762,IndependenceAvenue,Central Business District,FCT, Abuja Nigeria
Nigerian Telecommunications (Services) Sector Report Q3 2016
 Sector Report Q3 2016") Nigerian Telecommunications (Services) Sector Report Q3 2016 24 NOVEMBER 2016 Telecommunications Data The telecommunications data used in this report were obtained from the National Bureau of Statistics
Nigerian Telecommunications (Services) Sector Report Q3 2016 24 NOVEMBER 2016 Telecommunications Data The telecommunications data used in this report were obtained from the National Bureau of Statistics
Nigerian Telecommunications (Services) Sector Report Q2 2016
 Sector Report Q2 2016") Nigerian Telecommunications (Services) Sector Report Q2 2016 01 SEPTEMBER 2016 Telecommunications Data The telecommunications data used in this report were obtained from the National Bureau of Statistics
Nigerian Telecommunications (Services) Sector Report Q2 2016 01 SEPTEMBER 2016 Telecommunications Data The telecommunications data used in this report were obtained from the National Bureau of Statistics
Nigerian Telecommunications Sector
 Nigerian Telecommunications Sector SUMMARY REPORT: Q4 and full year 2015 NATIONAL BUREAU OF STATISTICS 26th April 2016 Telecommunications Data The telecommunications data used in this report were obtained
However, due to differing seasonal patterns, the telecommunications sector tends to account for the
 ( of However, due to differing seasonal patterns, the telecommunications sector tends to account for the fared better than the overall economy, and therefore the share of telecommunications in real GDP
Telecommunications Market Report January June 2009
 Office of Utility Regulation Telecommunications Market Report January June 2009 Information Note Document No: OUR 10/03 March 2010 Office of Utility Regulation Suites B1 & B2, Hirzel Court, St Peter Port,
POSTAL AND TELECOMMUNICATIONS REGULATORY AUTHORITY OF ZIMBABWE (POTRAZ)
") POSTAL AND TELECOMMUNICATIONS REGULATORY AUTHORITY OF ZIMBABWE (POTRAZ) POSTAL AND TELECOMMUNICATIONS SECTOR PERFORMANCE REPORT FOURTH QUARTER 2015 Disclaimer: This report has been prepared based on data
POSTAL AND TELECOMMUNICATIONS REGULATORY AUTHORITY OF ZIMBABWE (POTRAZ) POSTAL AND TELECOMMUNICATIONS SECTOR PERFORMANCE REPORT FOURTH QUARTER 2015 Disclaimer: This report has been prepared based on data
Table 1: Operators Authorized to Provide Public Fixed Domestic Telecommunications Services as at 2010
 2. Fixed Telephony Market Data As at December 2010, there were eight (8) operators authorized to provide fixed domestic telecommunications services to the public over wired or wireless facilities. These
QUARTERLY STATISTICAL BULLETIN ON COMMUNICATIONS IN GHANA
 QUARTERLY STATISTICAL BULLETIN ON COMMUNICATIONS IN GHANA Volume 2 Issue 1 NATIONAL COMMUNICATIONS AUTHORITY FIRST QUARTER JANUARY - MARCH, 2017 Communications for Development QUARTERLY STATISTICAL BULLETIN
POSTAL AND TELECOMMUNICATIONS REGULATORY AUTHORITY OF ZIMBABWE (POTRAZ)
") POSTAL AND TELECOMMUNICATIONS REGULATORY AUTHORITY OF ZIMBABWE (POTRAZ) ABRIDGED POSTAL & TELECOMMUNICATIONS SECTOR PERFORMANCE REPORT FOURTH QUARTER 2016 Disclaimer: This report has been prepared based
POSTAL AND TELECOMMUNICATIONS REGULATORY AUTHORITY OF ZIMBABWE (POTRAZ) ABRIDGED POSTAL & TELECOMMUNICATIONS SECTOR PERFORMANCE REPORT FOURTH QUARTER 2016 Disclaimer: This report has been prepared based
The Norwegian Electronic Communications Services Market
 The Norwegian Electronic Communications Services Market 1 st half 2014 30 October 2014 Revised 13 November 2014 Contents 1 Introduction... 6 2 Development trends... 7 2.1 Telephony... 7 2.2 Fied and mobile
THE FRENCH TELECOMMUNICATIONS SERVICES MARKET 4 th QUARTER 2002 (Licensed operators) June 2003
 June 2003") THE FRENCH TELECOMMUNICATIONS SERVICES MARKET 4 th QUARTER (Licensed operators) June 2003 2 Introduction Fixed telephony The fixed telephony sector continued to decline in. However carrier selection subscriptions
THE FRENCH TELECOMMUNICATIONS SERVICES MARKET 4 th QUARTER (Licensed operators) June 2003 2 Introduction Fixed telephony The fixed telephony sector continued to decline in. However carrier selection subscriptions
POSTAL AND TELECOMMUNICATIONS REGULATORY AUTHORITY OF ZIMBABWE (POTRAZ)
") POSTAL AND TELECOMMUNICATIONS REGULATORY AUTHORITY OF ZIMBABWE (POTRAZ) POSTAL AND TELECOMMUNICATIONS PERFORMANCE REPORT SECTOR THIRD QUARTER Disclaimer: This report has been prepared based on data provided
POSTAL AND TELECOMMUNICATIONS REGULATORY AUTHORITY OF ZIMBABWE (POTRAZ) POSTAL AND TELECOMMUNICATIONS PERFORMANCE REPORT SECTOR THIRD QUARTER Disclaimer: This report has been prepared based on data provided
Proceedings of the International Conference on Industrial Engineering and Operations Management Washington DC, USA, September 27-29, 2018
 Impact of Number Portability on Revenue of Mobile Operators in Nigeria; Comparing Churning Rate in MTN, Glo, Etisalat and Airtel Nsikan Nkordeh 1, Uzairue Stanley 2, Victor Matthews Olu 3, Segun Popoola
POSTAL AND TELECOMMUNICATIONS REGULATORY AUTHORITY OF ZIMBABWE (POTRAZ)
") POSTAL AND TELECOMMUNICATIONS REGULATORY AUTHORITY OF ZIMBABWE (POTRAZ) ABRIDGED POSTAL & TELECOMMUNICATIONS SECTOR PERFORMANCE REPORT FOURTH QUARTER 2018 Disclaimer: This report has been prepared based
POSTAL AND TELECOMMUNICATIONS REGULATORY AUTHORITY OF ZIMBABWE (POTRAZ) ABRIDGED POSTAL & TELECOMMUNICATIONS SECTOR PERFORMANCE REPORT FOURTH QUARTER 2018 Disclaimer: This report has been prepared based
REPUBLIC OF RWANDA RWANDA UTILITIES REGULATORY AGENCY
 REPUBLIC OF RWANDA RWANDA UTILITIES REGULATORY AGENCY STATISTICS AND TARIFF INFORMATION IN TELECOM SECTOR AS OF DECEMBER 2011 CONTENTS 1. MOBILE AND FIXED TELEPHONE SERVICE... 3 1.1. SUBSCRIPTIONS, MARKET
POSTAL AND TELECOMMUNICATIONS REGULATORY AUTHORITY OF ZIMBABWE (POTRAZ)
") POSTAL AND TELECOMMUNICATIONS REGULATORY AUTHORITY OF ZIMBABWE (POTRAZ) POSTAL & TELECOMMUNICATIONS SECTOR PERFORMANCE REPORT THIRD QUARTER 2016 Disclaimer: This report has been prepared based on data
POSTAL AND TELECOMMUNICATIONS REGULATORY AUTHORITY OF ZIMBABWE (POTRAZ) POSTAL & TELECOMMUNICATIONS SECTOR PERFORMANCE REPORT THIRD QUARTER 2016 Disclaimer: This report has been prepared based on data
POSTAL AND TELECOMMUNICATIONS REGULATORY AUTHORITY OF ZIMBABWE (POTRAZ)
") POSTAL AND TELECOMMUNICATIONS REGULATORY AUTHORITY OF ZIMBABWE (POTRAZ) ABRIDGED POSTAL & TELECOMMUNICATIONS SECTOR PERFORMANCE REPORT FIRST QUARTER 2017 Disclaimer: This report has been prepared based
POSTAL AND TELECOMMUNICATIONS REGULATORY AUTHORITY OF ZIMBABWE (POTRAZ) ABRIDGED POSTAL & TELECOMMUNICATIONS SECTOR PERFORMANCE REPORT FIRST QUARTER 2017 Disclaimer: This report has been prepared based
POSTAL AND TELECOMMUNICATIONS REGULATORY AUTHORITY OF ZIMBABWE (POTRAZ)
") POSTAL AND TELECOMMUNICATIONS REGULATORY AUTHORITY OF ZIMBABWE (POTRAZ) ABRIDGED POSTAL & TELECOMMUNICATIONS SECTOR PERFORMANCE REPORT FOURTH QUARTER 2017 Disclaimer: This report has been prepared based
POSTAL AND TELECOMMUNICATIONS REGULATORY AUTHORITY OF ZIMBABWE (POTRAZ) ABRIDGED POSTAL & TELECOMMUNICATIONS SECTOR PERFORMANCE REPORT FOURTH QUARTER 2017 Disclaimer: This report has been prepared based
Information & Communication Technology Statistics 2017
 Information & Communication Technology Statistics 2017 STATISTICS BOTSWANA Private Bag 0024 Gaborone Botswana Tel: (+267) 367 1300. Fax: (+267) 395 2201. Toll Free: 0800 600 200 Email: info@statsbots.org.bw
INDUSTRY INFORMATION - TELECOM SUBSCRIPTIONS FOR JULY National Communications Authority
 INDUSTRY INFORMATION - TELECOM SUBSCRIPTIONS FOR JULY 2017 National Communications Authority SEPTEMBER 29, 2017 1 P a g e Table of Contents 1. Introduction... 4 2. Mobile Voice Subscription for July 2017...
Firewall and IP Virtual Private Network Equipment: Worldwide, 2002 (Executive Summary) Executive Summary
 Executive Summary") Firewall and IP Virtual Private Network Equipment: Worldwide, 2002 (Executive Summary) Executive Summary Publication Date: 20 August 2003 Authors Caroline Jones Andy Rolfe This document has been published
Firewall and IP Virtual Private Network Equipment: Worldwide, 2002 (Executive Summary) Executive Summary Publication Date: 20 August 2003 Authors Caroline Jones Andy Rolfe This document has been published
POSTAL AND TELECOMMUNICATIONS REGULATORY AUTHORITY OF ZIMBABWE (POTRAZ)
") POSTAL AND TELECOMMUNICATIONS REGULATORY AUTHORITY OF ZIMBABWE (POTRAZ) ABRIDGED POSTAL & TELECOMMUNICATIONS SECTOR PERFORMANCE REPORT SECOND QUARTER 2017 Disclaimer: This report has been prepared based
POSTAL AND TELECOMMUNICATIONS REGULATORY AUTHORITY OF ZIMBABWE (POTRAZ) ABRIDGED POSTAL & TELECOMMUNICATIONS SECTOR PERFORMANCE REPORT SECOND QUARTER 2017 Disclaimer: This report has been prepared based
The Norwegian Electronic Communication Service Market. May Revised September
 The Norwegian Electronic Communication Service Market 2014 May 20 2015 Revised September 9 2015 1 Key figures 2013 2014 Change Fied telephony: Total number of subscribers to fied telephony 1 235 248 1
THE TELECOMMUNICATIONS SECTOR EVOLUTION AT 30 th SEPTEMBER 2012
 THE TELECOMMUNICATIONS SECTOR EVOLUTION AT 30 th SEPTEMBER 2012 1- Highlights at 30 th September 2012 Evolution of Tariffs (ARPM 1 ), average usage 2 of fixed and mobile telephony and the average monthly
RTR Telecom Monitor. Annual Review 2012
 RTR Telecom Monitor Annual Review BEREC Vice Chair 213 AUSTRIA RTR Telekom Monitor Annual Review Table of contents Preface 5 Section 1 Fixed network 7 Fixed lines 8 Fixed-line penetration 9 Development
POSTAL AND TELECOMMUNICATIONS REGULATORY AUTHORITY OF ZIMBABWE (POTRAZ)
") POSTAL AND TELECOMMUNICATIONS REGULATORY AUTHORITY OF ZIMBABWE (POTRAZ) ABRIDGED POSTAL & TELECOMMUNICATIONS SECTOR PERFORMANCE REPORT THIRD QUARTER 2017 Disclaimer: This report has been prepared based
POSTAL AND TELECOMMUNICATIONS REGULATORY AUTHORITY OF ZIMBABWE (POTRAZ) ABRIDGED POSTAL & TELECOMMUNICATIONS SECTOR PERFORMANCE REPORT THIRD QUARTER 2017 Disclaimer: This report has been prepared based
DRAFT. Measuring KSA Broadband. Meqyas, Q Report
 DRAFT Measuring KSA Broadband Meqyas, Q3 218 Report In 217, the CITC in partnership with SamKnows launched a project to measure internet performance. The project, named Meqyas, gives internet users in
Quarterly Market Indicators Q1 2018
 Quarterly Market Indicators Q1 2018 1 Content Disclaimer Page 3 Mobile services Page 4 Fixed line telephony services Page 6 Broadband services Page 8 Definitions Page 10 2 Disclaimer TRA has relied on
AN OVERVIEW OF THE ELECTRONIC COMMUNICATIONS MARKET IN THE REPUBLIC OF SERBIA. The Fourth Quarter of 2017
 AN OVERVIEW OF THE ELECTRONIC COMMUNICATIONS MARKET IN THE REPUBLIC OF SERBIA The Fourth Quarter of 2017 The Overview presents the data for the fourth quarter of 2017 along with comparative data for other
POSTAL AND TELECOMMUNICATIONS REGULATORY AUTHORITY OF ZIMBABWE (POTRAZ)
") POSTAL AND TELECOMMUNICATIONS REGULATORY AUTHORITY OF ZIMBABWE (POTRAZ) ABRIDGED POSTAL AND TELECOMMUNICATIONS SECTOR PERFORMANCE REPORT SECOND QUARTER 2015 Disclaimer: This report has been prepared based
POSTAL AND TELECOMMUNICATIONS REGULATORY AUTHORITY OF ZIMBABWE (POTRAZ) ABRIDGED POSTAL AND TELECOMMUNICATIONS SECTOR PERFORMANCE REPORT SECOND QUARTER 2015 Disclaimer: This report has been prepared based
Quarterly Market Indicators Q2 2017
 Quarterly Market Indicators Disclaimer Page 3 Mobile services Page 4 Fixed line telephony services Page 6 CONTENT Broadband services Definitions Page 8 Page 10 Disclaimer TRA has relied on information
Analysis of interconnect usage charges in India
 Viewpoint Analysis of interconnect usage charges in India Sourabh Kaushal April 2011 2 Summary: Analysis of interconnect usage charges in India In India the Interconnect Usage Charges (IUC) were introduced
AN OVERVIEW OF THE ELECTRONIC COMMUNICATIONS MARKET IN THE REPUBLIC OF SERBIA
 AN OVERVIEW OF THE ELECTRONIC COMMUNICATIONS MARKET IN THE REPUBLIC OF SERBIA The First Quarter of 2018 The Overview presents the data for the first quarter of 2018 along with comparative data for the
RTR Telecom Monitor. Annual Review 2011 BEREC CHAIR 2012 AUSTRIA
 RTR Telecom Monitor Annual Review 211 BEREC CHAIR 212 AUSTRIA Table of contents Preface 5 Section 1 Fixed network 7 Fixed lines and penetration 8 Development of fixed lines 9 Preselected lines and call-by-call
Telecommunications market data tables Q2 2015
 Telecommunications market data tables Q2 2015 1 Market monitor 2 Fixed telecoms market data tables 3 Mobile telecoms market data tables Published: 12 November 2015-1 - 1. Market monitor In the following
Telecommunications market data tables Q1 2016
 Telecommunications market data tables Q1 2016 1 Market monitor 2 Fixed telecoms market data tables 3 Mobile telecoms market data tables Published: 11 August 2016-1 - 1. Market monitor In the following
Executive Summary TELEGEOGRAPHY REPORT EXECUTIVE SUMMARY. FIGURE 1 International Traffic Growth,
 Executive Summary 2015 marked a turning point in the market the first time since the Great Depression that international carrier voice traffic declined. In the 1930s, the decline in traffic was due to
The Impact of the Call Termination Rate Reduction on Consumer Surplus in South Africa
 The Impact of the Call Termination Rate Reduction on Consumer Surplus in South Africa Ryan Hawthorne Senior Associate, Centre for Competition, Regulation and Economic Development (CCRED, University of
STATISTICS AND TARIFF INFORMATION IN TELECOM SECTOR AS OF DECEMBER 2013
 STATISTICS AND TARIFF INFORMATION IN TELECOM SECTOR AS OF DECEMBER 2013 Prepared by: Economic and Market Analysis Section CONTENTS I. preliminary remarks... 5 II. summary... 5 1. MOBILE AND FIXED TELEPHONE
REPUBLIC OF RWANDA RWANDA UTILITIES REGULATORY AGENCY
 REPUBLIC OF RWANDA RWANDA UTILITIES REGULATORY AGENCY STATISTICS AND TARIFF INFORMATION IN TELECOM SECTOR AS OF SEPTEMBER 2012 CONTENTS 1. MOBILE AND FIXED TELEPHONE SERVICE... 3 1.1. SUBSCRIPTIONS, MARKET
RTR TELEKOM MONITOR 2017 Annual Report
 RTR TELEKOM MONITOR Annual Report 20 17 www.rtr.at Austrian Regulatory Authority for Broadcasting and Telecommunications (Rundfunk und Telekom Regulierungs-GmbH) Mariahilfer Strasse 77 79, 1060 Vienna,
MARKET OBSERVATORY : THE TELECOMMUNICATIONS SERVICES MARKET IN FRANCE AT THE FOURTH QUARTER 2004 (declared operators) May 2005
 May 2005") : THE TELECOMMUNICATIONS SERVICES MARKET IN FRANCE AT THE FOURTH QUARTER 20 (declared operators) May 25 2 Introduction At the fourth quarter 20, the electronic communications market in France represented
: THE TELECOMMUNICATIONS SERVICES MARKET IN FRANCE AT THE FOURTH QUARTER 20 (declared operators) May 25 2 Introduction At the fourth quarter 20, the electronic communications market in France represented
Cincinnati Bell Inc. March 4, 2013
 Cincinnati Bell Inc. March 4, 2013 Safe Harbor This presentation and the documents incorporated by reference herein contain forwardlooking statements regarding future events and our future results that
Telecommunications market data tables Q1 2013
 Telecommunications market data tables Q1 2013 1 Market monitor 2 Fixed telecoms market data tables 3 Mobile telecoms market data tables Published: 22 August 2013-1 - 1. Market monitor We have made restatements
On track in the first quarter of 2018 growth in broadband, inone and TV
 On track in the first quarter of 2018 growth in broadband, inone and TV Higher revenue, EBITDA practically stable Growth in bundled offerings thanks to inone and in the solutions business with corporate
THE WORLD IN 2009: ICT FACTS AND FIGURES
 THE WORLD IN 29: ICT FACTS AND FIGURES A decade of ICT growth driven by mobile technologies 8 7 Mobile cellular telephone subscriptions Internet users 67. per 1 inhabitants 6 5 4 3 2 Fixed telephone lines
State of the Satellite Industry Report
 State of the Satellite Industry Report August 2011 Sponsored by the Prepared by Futron Corporation SIA Member Companies as of August 2011 2 Study Overview The SIA s 14 th annual comprehensive study of
Copyrights Statistics Botswana 2016
 STATISTICS BOTSWANA Information and Communications Technology Statistics Report 2014 Copyrights Statistics Botswana 2016 ISBN: 978-99968-477-3-2 Statistics Botswana. Private Bag 0024 Botswana Tel: (267)
Google Inc net consolidated revenues: 27.2 billion euro
 5.1. Google Presentation Google Inc. 2011 net consolidated revenues: 27.2 billion euro Advertising Google Websites 77% of net sales Fiscal year ended December 31, 2011 Advertising Network Members Websites
CONSOLIDATED RESULTS FOR Q1 2012
 PRESS RELEASE Rabat, April 26, 2012 CONSOLIDATED RESULTS FOR Q1 2012 Results show very positive momentum with the recovery of growth in revenue and margins and the 12.6% expansion of the Group s customer
4Q 2017 Results Conference Call
 4Q 2017 Results Conference Call February 22, 2018 at 15:00 CET Good afternoon everyone. I am Péter Bauer, Head of Investor Relations at Magyar Telekom. I would like to welcome you to our fourth quarter
The Nigerian Telecommunication Industry: Analysis of the First Fifteen Years of the Growths and Challenges in the GSM Market ( )
") , October 25-27, 2017, San Francisco, USA The Nigerian Telecommunication Industry: Analysis of the First Fifteen Years of the Growths and Challenges in the GSM Market (2001 2016) Nsikan Nkordeh, Ibinabo
, October 25-27, 2017, San Francisco, USA The Nigerian Telecommunication Industry: Analysis of the First Fifteen Years of the Growths and Challenges in the GSM Market (2001 2016) Nsikan Nkordeh, Ibinabo
IPTV Statistics market analysis
 IPTV Statistics market analysis Q2 2012 October 2012 Point Topic Ltd 73 Farringdon Road London EC1M 3JQ, UK Tel. +44 (0) 20 3301 3305 Email laura.kell@point-topic.com 2 Contents 1 Introduction 3 2 Global
REPUBLIC OF RWANDA RWANDA UTILITIES REGULATORY AGENCY
 REPUBLIC OF RWANDA RWANDA UTILITIES REGULATORY AGENCY STATISTICS AND TARIFF INFORMATION IN TELECOM SECTOR AS OF DECEMBER 2012 CONTENTS 1. MOBILE AND FIXED TELEPHONE SERVICE... 4 1.1. SUBSCRIPTIONS, MARKET
BROADBAND TAKE-UP DRAMATICALLY SLOWS ACROSS EUROPE. ECTA blames rise in monopolies
 Release Immediate BROADBAND TAKE-UP DRAMATICALLY SLOWS ACROSS EUROPE ECTA blames rise in monopolies Brussels, 01.02.07 The European Competitive Telecommunications Association (ECTA) has reported a significant
POSTAL AND TELECOMMUNICATIONS REGULATORY AUTHORITY OF ZIMBABWE (POTRAZ)
") POSTAL AND TELECOMMUNICATIONS REGULATORY AUTHORITY OF ZIMBABWE (POTRAZ) POSTAL AND TELECOMMUNICATIONS PERFORMANCE REPORT SECTOR SECOND QUARTER 2016 Disclaimer: This report has been prepared based on data
POSTAL AND TELECOMMUNICATIONS REGULATORY AUTHORITY OF ZIMBABWE (POTRAZ) POSTAL AND TELECOMMUNICATIONS PERFORMANCE REPORT SECTOR SECOND QUARTER 2016 Disclaimer: This report has been prepared based on data
Autorità per le garanzie nelle comunicazioni
 Autorità per le garanzie nelle comunicazioni Quarterly munication Markets Observatory (*) - Updated to 31 December 2013 - (*) Data provided by operators and elaborated by Agcom. - 1 - Index Focus Main
Net profit remained at the same level as the last fiscal year mainly due to the sale of investment securities during the third quarter.
 Net profit remained at the same level as the last fiscal year mainly due to the sale of investment securities during the third quarter. 1 In SG&A expenses, personnel expenses decreased following a fall
n Segments at a Glance
 for the Fiscal Year Ended March 31, 214 by Segment n Segments at a Glance From the fiscal year ended March 31, 213, KDDI has realigned its reportable segments into four business segments based on management
International Communications Market Report Post
 International Communications Market Report 13 7 7 Post 39 Contents 7.1 Key market developments in post 311 7.1.1 Introduction 311 7.1.2 The UK is among the cheapest countries in Europe to send a standard
TELECOMMUNICATIONS CONSUMPTION TREND AND SERVICE BUNDLING
 TELECOMMUNICATIONS CONSUMPTION TREND AND SERVICE BUNDLING Ghana s Experience International Telecommunications Union (ITU) ICT indicators symposium Gaborone, Botswana, November 21-23, 2016 Victor Teppeh
Telecom Egypt Announces Second Quarter 2013 Consolidated Results
 Telecom Egypt Announces Second Quarter 2013 Consolidated Results Cairo, August 14 2013: Telecom Egypt (te) (Ticker: ETEL.CA; TEEG.LN), today announced its interim consolidated financial results for the
Telecom Sector Outlook and Spectrum Trading: the Case of Pakistan
 Telecom Sector Outlook and Spectrum Trading: the Case of Pakistan Shahbaz Nasir Pakistan Telecommunication Authority ITU Workshop on Economic Aspects of Spectrum Management 21 st 23 rd November 2016 Tehran
The following table sets out major indicators of our business development in 2001, 2002 and 2003.
 The following table sets out major indicators of our business development in 2001, 2002 and 2003. Change 2003 over 2001 2002 2003 2002 Local wireline access lines in service (in thousands) 80,834 96,788
Communications Market Review
 ``` ``` ``` `` ``` `` ``` `` ``` Communications Market Review Document No: MCA/R/17-3044 Date: 7 th December 2017 Table of Contents 1. Reporting parameters... 4 1.1. The reporting period and data cut-off
AT&T in the Telecom Industry Current Overview. CWA Research Dept. March 2010
 AT&T in the Telecom Industry Current Overview CWA Research Dept. March 2010 Demand for Telecom Services Telco access lines fell 28% from 181 million in 2000 to 130 million in 2009 Change in Voice Access
Midsize Business Voice Service Spending Steady for 2003
 End-User Analysis Midsize Business Voice Service Spending Steady for 23 Abstract: Telecom service providers need to know the voice telecom spending plans of the margin-rich midsize business segment in
Fixed Public Services Trends in CEE and MEA, (Executive Summary) Executive Summary
 Executive Summary") Fixed Public Trends in CEE and MEA, 2001-2007 (Executive Summary) Executive Summary Publication Date: 4 August 2003 Author William L. Hahn This document has been published to the following Marketplace
Fixed Public Trends in CEE and MEA, 2001-2007 (Executive Summary) Executive Summary Publication Date: 4 August 2003 Author William L. Hahn This document has been published to the following Marketplace
INDUSTRY INFORMATION - TELECOM SUBSCRIPTIONS FOR FEBRUARY 2016
 INDUSTRY INFORMATION - TELECOM SUBSCRIPTIONS FOR FEBRUARY 2016 National Communications Authority FEBRUARY 29, 2016 1 P age Contents 1. Introduction... 4 2. Mobile Voice Subscription Trends For February
COMMUNICATION FROM THE COMMISSION TO THE EUROPEAN PARLIAMENT, THE COUNCIL, THE EUROPEAN ECONOMIC AND SOCIAL COMMITTEE AND THE COMMITTEE OF THE REGIONS
 EUROPEAN COMMISSION Brussels, 29.6.2010 COM(2010)356 final COMMUNICATION FROM THE COMMISSION TO THE EUROPEAN PARLIAMENT, THE COUNCIL, THE EUROPEAN ECONOMIC AND SOCIAL COMMITTEE AND THE COMMITTEE OF THE
MOBILE PRICE BASKETS (DECEMBER 2007 v1.1)
") MOBILE PRICE BASKETS (DECEMBER 2007 v1.1) Background Three kinds of price indicators: T-Baskets, OECD (http://www.teligen.com/t_basket.asp) OECD-based and OECD-authorized; takes pricing information from
MOBILE PRICE BASKETS (DECEMBER 2007 v1.1) Background Three kinds of price indicators: T-Baskets, OECD (http://www.teligen.com/t_basket.asp) OECD-based and OECD-authorized; takes pricing information from
Average Revenue per User (ARPU) measures the average monthly revenue generated per customer Average Usage per User (AUPU) measures the average
 measures the average monthly revenue generated per customer Average Usage per User (AUPU) measures the average") Introduction Key Definitions Key Market Trends & Observations Economic Indicators for the BVI Main Telecoms Indicators Total Revenue in the Telecoms Sector Total Mobile Communications Investment Employment
Introduction Key Definitions Key Market Trends & Observations Economic Indicators for the BVI Main Telecoms Indicators Total Revenue in the Telecoms Sector Total Mobile Communications Investment Employment
Quarterly Market Indicators Q2 2016
 Quarterly Market Indicators Disclaimer Page 3 Mobile services Broadband services Page 4 Page 5 CONTENT Fixed telephony services Page 7 Definitions Page 8 Disclaimer TRA does not make any representations
The Effectiveness of Mobile Wireless Service as a Competitive Constraint on Landline Pricing: Was the DOJ Wrong?
 11 December 2008 The Effectiveness of Mobile Wireless Service as a Competitive Constraint on Landline Pricing: Was the DOJ Wrong? William E. Taylor and Harold Ware 1 The US Department of Justice (DOJ)
COMMUNICATIONS OUTLOOK 2001
 COMMUNICATIONS OUTLOOK 2001 Country: SPAIN Date completed: 23-6-2000 1 TELECOMMUNICATIONS Market Structure and Regulatory Status (Questions 1-10) 1. Please provide details of the regulation of communication
IAB internet advertising revenue report 2017 first six-months results
 www.pwc.com www.iab.net IAB internet advertising revenue report 2017 first six-months results PwC Any trademarks included are trademarks of their respective owners and are not affiliated with, nor endorsed
CTIA s Wireless Metrics Reports
 CTIA s Wireless Metrics Reports Bobby Franklin Executive Vice President CTIA-The Wireless Association April 30, 2009 Background on Semi-Annual Survey CTIA s survey began in January 1985 focusing on operational
ICT Policy in Japan - Broadband and Mobile -
 ICT Policy in Japan - Broadband and Mobile - April 16, 2009 Hiroyuki HISHINUMA Director for New Competition Policy Telecommunications Policy Division Telecommunications Business Department Telecommunications
Osondu Nwokoro. Affordable*Internet*for*All* Driven*by*Open*Access*&*Infrastructure*Sharing:* The*Nigerian*Experience.
 Affordable*Internet*for*All* Driven*by*Open*Access*&*Infrastructure*Sharing:* The*Nigerian*Experience Osondu Nwokoro Alliance for Affordable Internet (A4AI) Meeting Accra, Ghana 12 November, 2014 Outline
The 13 th Progress Report on the Single European Telecoms Market 2007: Frequently Asked Questions
 MEMO/08/17 Brussels, 19 March 2008 The 13 th Progress Report on the Single European Telecoms Market 2007: Frequently Asked Questions 1. What is the objective of the 13 th Progress Report on the Single
TABLE OF CONTENTS. Broadband Key Indicators and Sector Findings. Preface. Subscriber Television Revenue. ICT Development Index Investment
 1 PREFACE 2 The Eastern Caribbean Telecommunications Authority (ECTEL) produces a review of the electronic communications sector annually. This report provides information on the performance and economic
MOBILE MONITORING REPORT
 Project no. 13.03/12854 Public version MOBILE MONITORING REPORT November 2011 to January 2012 Date: 20 March 2012 2 Purpose The Commission issued the Mobile Termination Access Services (MTAS) Standard
Quarterly Gross Domestic Product Report
 Statistical Release Quarterly Gross Domestic Product Report Third Quarter, 2018 31 st December 2018 1 Table of Contents List of Tables... 2 List of Figures... 2 1.0. Economic Performance... 3 2.0. Sectoral
Telecommunications markets indicators in the Kingdom of Bahrain. September 2013
 Telecommunications markets indicators in the Kingdom of Bahrain September 2013 2013 Contents Page Introduction 3 Disclaimer 4 Key market trends and observations in 2012 5 TRA highlights during Q1, Q2 2013
MOBILE MONITORING REPORT
 Project no. 13.03/12854 Public version MOBILE MONITORING REPORT August to October 2011 Date: 20 December 2011 2 Purpose The Commission issued the standard terms determination () for mobile termination
STATISTICS AND TARIFF INFORMATION IN TELECOM SECTOR AS OF SEPTEMBER 2013
 STATISTICS AND TARIFF INFORMATION IN TELECOM SECTOR AS OF SEPTEMBER 2013 Prepared by: Economic and Market Analysis Section CONTENTS I. preliminary remarks... 4 II. summary... 4 1. MOBILE AND FIXED TELEPHONE
POSTAL AND TELECOMMUNICATIONS REGULATORY AUTHORITY OF ZIMBABWE (POTRAZ)
") POSTAL AND TELECOMMUNICATIONS REGULATORY AUTHORITY OF ZIMBABWE (POTRAZ) ABRIDGED ANNUAL POSTAL AND TELECOMMUNICATIONS SECTOR PERFORMANCE REPORT 2017 Disclaimer: This report has been prepared based on data
POSTAL AND TELECOMMUNICATIONS REGULATORY AUTHORITY OF ZIMBABWE (POTRAZ) ABRIDGED ANNUAL POSTAL AND TELECOMMUNICATIONS SECTOR PERFORMANCE REPORT 2017 Disclaimer: This report has been prepared based on data
THE TELECOMMUNICATIONS SECTOR EVOLUTION AT 31 st MARCH 2011
 THE TELECOMMUNICATIONS SECTOR EVOLUTION AT 31 st MARCH 2011 Mobile Telephony Market 1 At the end of the first quarter of 2011, the number of mobile subscribers reached 33 375 498, with a quarterly growth
INTERNET MARKET IN MOROCCO
 INTERNET MARKET IN MOROCCO Quarterly Observatory* -December 2012- This document is to be considered for information purposes only. Summary Introduction 3 I II Recall of various types of Internet access
O2 Czech Republic. Quarterly Results January September th November 2014
 O2 Czech Republic Quarterly Results January September 2014 12 th November 2014 CAUTIONARY STATEMENT Any forward-looking statements concerning future economic and financial performance of O2 Czech Republic
DUTCH BENCHMARK The 2017 Edition
 DUTCH EMAIL BENCHMARK 07 Management summary Dutch National Email Benchmark 07 With the increased digitalization of societies and due to the high return on investment, the use of email marketing is strategically
BoR (11) 08. BEREC Report on Alternative Voice and SMS Retail Roaming Tariffs and Retail Data Roaming Tariffs
 08. BEREC Report on Alternative Voice and SMS Retail Roaming Tariffs and Retail Data Roaming Tariffs") BEREC Report on Alternative Voice and SMS Retail Roaming Tariffs and Retail Data Roaming Tariffs February 2011 1. Overview This BEREC Report on Alternative Retail Voice and SMS Roaming Tariffs and Retail
BEREC Report on Alternative Voice and SMS Retail Roaming Tariffs and Retail Data Roaming Tariffs February 2011 1. Overview This BEREC Report on Alternative Retail Voice and SMS Roaming Tariffs and Retail
As a note, this presentation was released as the dates shown and reflected management views as of these dates. All information in this presentation
 July 2003 1 As a note, this presentation was released as the dates shown and reflected management views as of these dates. All information in this presentation regarding the Company s financial results
RTR TELEKOM MONITOR ANNUAL REVIEW 2016
 RTR TELEKOM MONITOR ANNUAL REVIEW RTR Telekom Monitor Annual Review Contents Preface 5 1 Mobile communications 7 Mobile penetration 8 Retail revenues from mobile communications 9 Call minutes on the retail
ANALYSIS OF THE TELECOMMUNICATIONS SECTOR EVOLUTION AT 30 th SEPTEMBER 2011
 ANALYSIS OF THE TELECOMMUNICATIONS SECTOR EVOLUTION AT 30 th SEPTEMBER 2011 1- Highlights at 30 th September 2011 Evolution of Tariffs (ARPM 1 ), average usage 2 of fixed and mobile telephony and the average
VIETNAM TELECOMMUNICATION MARKET REPORT Q2/2018
 VIETNAM TELECOMMUNICATION MARKET REPORT Q2/2018 1 Contents Executive summary 4 Landline phones 56 1. Business environment 6 2.2.3 Competitive analysis 59 1.1 Macroeconomic situation 6 2.3 Issues in industry
IP Backbone Opportunities in Asia/Pacific (Executive Summary) Executive Summary
 Executive Summary") IP Backbone Opportunities in Asia/Pacific (Executive Summary) Executive Summary Publication Date: September 9, 2002 Author Chee Eng To This document has been published to the following Cluster codes: TELC-WW-EX-0423
IP Backbone Opportunities in Asia/Pacific (Executive Summary) Executive Summary Publication Date: September 9, 2002 Author Chee Eng To This document has been published to the following Cluster codes: TELC-WW-EX-0423
Quarterly Market indicators. Data at the end of Q4 2013
 Quarterly Market indicators Data at the end of Q4 2013 2014 Contents Disclaimer Page 3 Mobile services Page 4 Broadband services Page 5 Fixed telephony services Page 7 Definitions Page 8 2 Disclaimer TRA
Earnings Presentation Q&A for the Third Quarter of Fiscal 2009, the Year Ending March 31, 2010
 January 28, 2010 Earnings Presentation Q&A for the Third Quarter of Fiscal 2009, the Year Ending March 31, 2010 Key: : : Question NEC s answer * Previous forecasts refers to forecasts announced on October
PT EXCELCOMINDO PRATAMA Tbk. (XL)
") PT EXCELCOMINDO PRATAMA Tbk. (XL) 1H Q1 2007 Performance Results Presentation Results July April 2007 1 Operating & Financial Results Key Drivers Product, Network & Distribution Market Updates 2007 Outlook
PT EXCELCOMINDO PRATAMA Tbk. (XL) 1H Q1 2007 Performance Results Presentation Results July April 2007 1 Operating & Financial Results Key Drivers Product, Network & Distribution Market Updates 2007 Outlook