However, due to differing seasonal patterns, the telecommunications sector tends to account for the
|
|
|
- Luke Harvey
- 6 years ago
- Views:
Transcription

1 (
2

3 of However, due to differing seasonal patterns, the telecommunications sector tends to account for the fared better than the overall economy, and therefore the share of telecommunications in real GDP In contrast with the overall economy, real year on year growth in the telecommunications sector Nigerian Telecommunications Sector Q
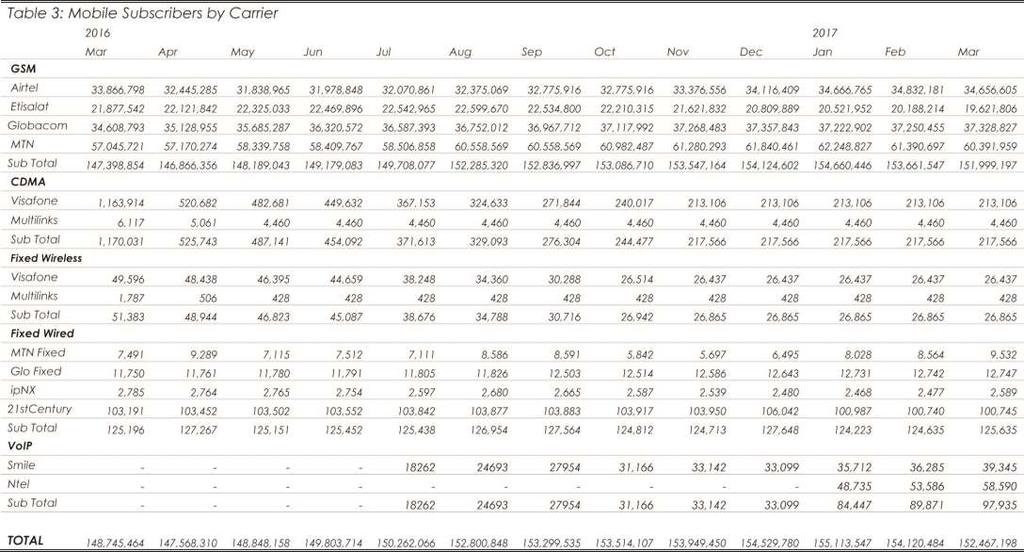
4 Subscribers as of March 2017 The total number of subscribers has increased rapidly over the past decade; at the end of 2005 there were 19,519,154 subscribers, but by the end of 2016 there were 154,529,780, which is equivalent to an increase of 12,273,693 every year. However, growth has been declining recently,possibly resulting from high market penetration leaving less room for large expansion. In March 2017 the end of the first quarter there were 152,467,198 subscribers, which represents a quarterly decline of 1.33%. Along with declines in the first half of 2016, this indicates that growth has become less consistent, after years of nearly uninterrupted growth. Year on year however, there was still an increase of 2.5%; a larger increase than at the end of any quarter since March 2016, reflecting the increases seen throughout the second half of Part of this growth arose from the inclusion of new providers. In the last quarter, NCC began recording data for a new technology type, VoIP. Whereas in the last report data was only available for Smile, this quarter data for NTEL has also been included. The quarterly and yearly growth rates without these new providers would have been 1.38% and 2.44% respectively. The numbers of subscribers with NTEL and Smile remain small, possibly due to the service being newer. According to the data provided by NCC, there was no change in the number of CDMA or Fixed wireless subscribers relative to the previous quarter. In contrast, both GSM and Fixed wired subscriber numbers fell, by 1.38% and 1.58% respectively. However, due to the much larger number of GSM subscribers, this technology type is the main driver of movements in the total numbers of subscribers. The quarterly increase in VoIP subscriber numbers was %, or nearly triple, from 33,099 subscribers in December 2016 to 97,935 in March Year on year, both CDMA and Fixed Wireless subscriber numbers fell greatly, by 81.41% and 47.72% respectively. However, growth was buoyed by a 3.12% increase in the number of GSM subscribers, and the introduction to the data of the VoIP technology type. Nigerian Telecommunications Sector Q

5 Voice over Internet Protocol, and so far, the only provider recorded by NCC is Smile. The other technology types make up respectively.voip accounted for 0.06%, higher than the share of 0.02% recorded at the end of the number of subscribers using fixed wireless lines has also decreased sharply, although this was from a low level and therefore only had a small effect on the total. The proportion of fixed wired lines remained technology, it is cited as being easier to switch networks, and it is regarded as being more accessible for given markets Nigerian Telecommunications Sector Q
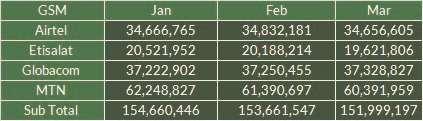
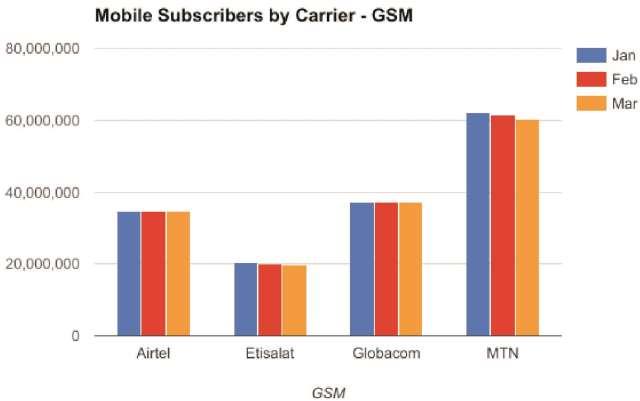
6 Mobile Subscribers (GSM) In March 2017, the total number of GSM subscribers was 151,999,197, which was 2,125,405 less than in December 2016, equivalent to a decrease of 1.38%. This was the first quarterly decline since the previous March. The quarterly growth rate has been declining since September 2016 when quarterly growth was 2.45%. A similar pattern was seen in the months leading to March 2016, which may indicate the emergence of a seasonal pattern, although this will become clearer as more data becomes available. Compared to the previous year there were 4,600,343 more subscribers, an increase of 3.12%. Airtel was the only GSM provider to record an increase in the number of subscribers relative to the previous quarter, of 1.58%, which means this provider recorded the highest growth rate for the second consecutive quarter. Their number increased by 540,196 to reach 34,656,605 between December 2016 and March This was nevertheless lower than the quarterly growth rate of 4.09% recorded in December Although the other three providers recorded decreases in their numbers over this period, the decrease recorded by Globacom was slight. With 37,328,827 subscribers, Globacom had 29,016 fewer subscribers in March 2017 than in December 2016, a decrease of only 0.08%. In percentage terms, Etisalat recorded the largest decline, for the third consecutive month, of 5.71% compared to 2.34% for MTN. However, given that MTN has significantly more subscribers, with 60,391,959 in March 2017 compared to 19,621,806 for Etisalat, their monthly decrease was larger in absolute terms. MTN lost 1,448,502 subscribers relative to December 2016, compared to a loss of 1,188,083 for Etisalat. Year on year the trends were notably different. Etisalat was the only provider to record a decrease in subscriber numbers relative to March 2016, of 2,255,736, or 10.31%. As illustrated by figure 3, this sets this provider apart from the others considerably; the provider to see the second lowest year on year growth was Airtel with growth of 2.33%, or nearly 13% points higher than Etisalat's. Globacom and MTN recorded year on year growth in subscriber numbers of 7.86% and 5.87% respectively, which corresponds to an increase of 2,720,034 to reach 37,328,827 for Globacom, and an increase of 3,346,238 to reach 60, for MTN. Nigerian Telecommunications Sector Q

7 These trends did not change the overall ranking of GSM providers in terms of numbers of subscribers. share Nigerian Telecommunications Sector Q
8 Mobile Subscribers (CDMA) According to NCC, the number of CDMA subscribers in March 2017 was the same as in December In each month (and intervening months) there were 217,566 CDMA subscribers. This contrasts to the previous quarter in which a quarterly fall of 21.26% was recorded. Although there was no quarterly change, the was nevertheless an annual fall of 81.41% from 1,170,031 in March This was a smaller year on year than in the previous quarter of 89.87%, as the number of CDMA subscribers had been falling for some time before levelling out at the end of The number of Multilinks subscribers remained unchanged relative to the previous quarter, at 4,460. This has been the number of Multilinks subscribers recorded by NCC since May Whereas the number of Visafone subscribers had been falling, this trend ended in November 2016, from which time the number recorded by NCC has been unchanged at 213,106. As a result, the share of CDMA subscribers accounted for by each provider remained the same, with Visafone accounting for 97.95%. In March of the previous year, Multilinks had 6,117 subscribers, and Visafone had 1,163,914, implying year on year declines of 27.09% and 81.69% respectively. Fixed Wireless Line As with CDMA subscribers, there was no change in the number of fixed wireless line subscriptions between December 2016 and March 2017 according to NCC; in each period, there were 26,865. Compared to March of the previous year, there was a drop of 24,518, or a 47.72% decline. Neither provider of fixed wireless line subscriptions recorded any change relative to the previous quarter, according to the NCC data. Multilinks continued to record 428 subscribers, and Visafone continued to record 26,437. This has been the case since November Consequently, since this time Visafone's share of fixed wireless line subscribers has been 98.41%. Year on year however, Visafone lost 23,159 subscribers, a decrease of 46.70%, and Multilinks lost 1,359, a decrease of 76.05%. Nigerian Telecommunications Sector Q

9 Relative to the end of the previous quarter, Fixed Wired Line subscriptions recorded the largest change The four providers of fixed wired line technology saw markedly different trends. For the second quarter subscribers subscribers has been trending downwards, albeit inconsistently. However, the quarterly growth rate in reach subscribers due to the latter's larger number of subscribers. Nigerian Telecommunications Sector Q

10 These trends resulted in an increase in the share of fixed wired subscriptions accounted for by MTN, The opposite was true for Century, who had never recorded a year on year decline before 2017, but in other two providers have been less consistent. Globacom recorded a year on year increase of 997 Nigerian Telecommunications Sector Q
11 In the previous quarter, NCC began to report data on a fifth technology type: Voice over Internet internet subscription. contributed. Nigerian Telecommunications Sector Q

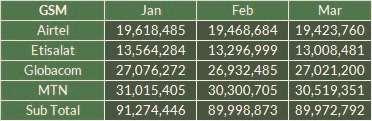
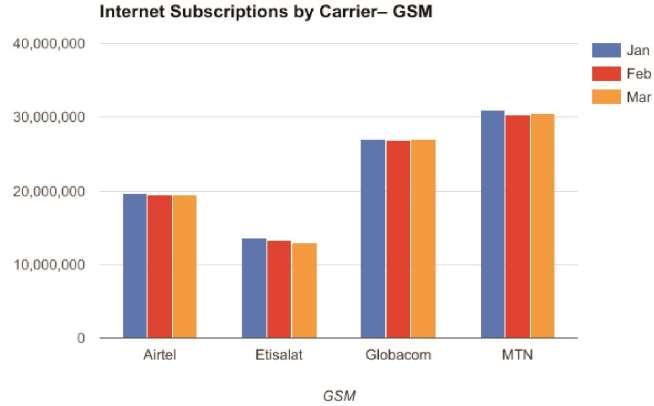
12 resulted in only slight changes to the shares of GSM internet subscriptions accounted for by each recorded a relatively small increase of 1.85% over the same period. Nigerian Telecommunications Sector Q

13 decline in mobile subscriptions over this period. Visafone recorded a year on year decline of 75.71%, Multilinks recorded small number subscribers network carriers. porting activities refer to those whom have left.the first quarter of 2017 recorded adecrease in the Nigerian Telecommunications Sector Q
14 Incoming There was a total of 41,419 incoming porters in the first quarter of 2017 (across all three months). This compares with a total of 49,547 in the final quarter of 2016, and 51,301 in the first quarter of 2016, decreases of 16.40% and 19.26% respectively. Quarter on quarter, Airtel and MTN recorded increases, whereas Etisalat and Globacom recorded decreases. In contrast to the previous two quarters in which Airtel recorded the largest decreases in percentage terms, the number of porters switching to Airtel nearly doubled, increasing by 99.07%. However, this was from a low base, and in March 2017 there were still only 6,856, considerably below the number recorded by Airtel in previous periods. The increase of 10.10% incoming porters to MTN brought their total number to 4,817 in the first quarter of 2017, which is the highest quarterly number recorded for this provider. Etisalat recoded the largest decline of 29.06%, which brought their number to 27,249, although this was still by far the largest number of incoming porters recorded by any provider. Globacom recorded a decline of 24.72% which brought their number to 4,817. Although Etisalat remained the largest provider, their share fell from 77.52% in the final quarter of 2016 to 65.79% in the first quarter of By contrast Airtel increased their share by nearly 10% points, from 6.95% to 16.55%, and therefore became the second largest destination for incoming porters. MTN also increased their share, from 8.83% to 11.63%, but fell to being the third largest destination due to Airtel's larger increase. Globacom remained the smallest destination of incoming porters for the third consecutive quarter, and their share fell from 6.69% to 6.03% between the last quarter of 2016 and the first of Year on year there were large changes in the number of incoming porters switching to each provider, highlighting the volatile nature of the series. MTN recorded an increase of 256.0%, or more than triple. By contrast Airtel and Globacom recorded falls of 64.31% and 57.41% respectively. Etisalat's year on year growth in incoming porter numbers was relatively stable, at an increase of 9.54%. Nigerian Telecommunications Sector Q

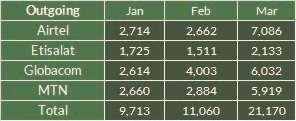
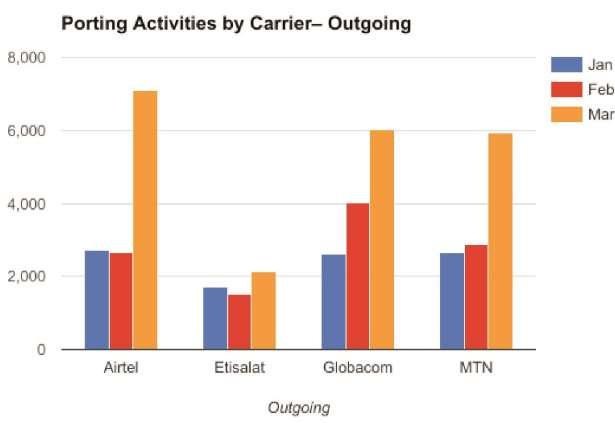
15 both These trends resulted in Globacom overtaking MTN to record the largest number of outgoing porters, Airtel. This was the first time that MTN did not record either the first or second highest number, and Nigerian Telecommunications Sector Q
16 recorded a decrease of 63.07%, its largest year on year decline yet recorded. The other three providers largest, outgoing result that Globacom became the provider to lose the most from porting activities; this was the first than the 7,819 recorded in the previous quarter. Nigerian Telecommunications Sector Q
17 calls are made to other networks. As may be expected, the latter is more expensive: in 2016, the %. This possibly reflects increasing competition among providers vying for market share, as well as increased efficiency in provision of services. The large increase in the number of phone subscribers Nigerian Telecommunications Sector Q
18 Nigerian Telecommunications Sector Q

19 Nigerian Telecommunications Sector Q

20 Nigerian Telecommunications Sector Q

21 Nigerian Telecommunications Sector Q

22 Nigerian Telecommunications Sector Q
23 Nigerian Telecommunications Sector Q
24 Nigerian Telecommunications Sector Q
25 Nigerian Telecommunications Sector Q
26 Nigerian Telecommunications Sector Q
27
28

29
30
31
32
Nigerian Telecommunications Sector
 Nigerian Telecommunications Sector (SUMMARY REPORT: DECEMBER 2016) Report Date: January 2017 Data Source: National Bureau of Statistics / Nigerian Communication Commission (NCC) Contents Telecommunications
Nigerian Telecommunications (Services) Sector Report Q3 2016
 Sector Report Q3 2016") Nigerian Telecommunications (Services) Sector Report Q3 2016 24 NOVEMBER 2016 Telecommunications Data The telecommunications data used in this report were obtained from the National Bureau of Statistics
Nigerian Telecommunications (Services) Sector Report Q3 2016 24 NOVEMBER 2016 Telecommunications Data The telecommunications data used in this report were obtained from the National Bureau of Statistics
Nigerian Telecommunications (Services) Sector Report Q2 2016
 Sector Report Q2 2016") Nigerian Telecommunications (Services) Sector Report Q2 2016 01 SEPTEMBER 2016 Telecommunications Data The telecommunications data used in this report were obtained from the National Bureau of Statistics
Nigerian Telecommunications (Services) Sector Report Q2 2016 01 SEPTEMBER 2016 Telecommunications Data The telecommunications data used in this report were obtained from the National Bureau of Statistics
Nigerian Telecommunications Sector
 Nigerian Telecommunications Sector SUMMARY REPORT: Q4 and full year 2015 NATIONAL BUREAU OF STATISTICS 26th April 2016 Telecommunications Data The telecommunications data used in this report were obtained
Telecommunications Market Report January June 2009
 Office of Utility Regulation Telecommunications Market Report January June 2009 Information Note Document No: OUR 10/03 March 2010 Office of Utility Regulation Suites B1 & B2, Hirzel Court, St Peter Port,
THE TELECOMMUNICATIONS SECTOR EVOLUTION AT 30 th SEPTEMBER 2012
 THE TELECOMMUNICATIONS SECTOR EVOLUTION AT 30 th SEPTEMBER 2012 1- Highlights at 30 th September 2012 Evolution of Tariffs (ARPM 1 ), average usage 2 of fixed and mobile telephony and the average monthly
REPUBLIC OF RWANDA RWANDA UTILITIES REGULATORY AGENCY
 REPUBLIC OF RWANDA RWANDA UTILITIES REGULATORY AGENCY STATISTICS AND TARIFF INFORMATION IN TELECOM SECTOR AS OF DECEMBER 2011 CONTENTS 1. MOBILE AND FIXED TELEPHONE SERVICE... 3 1.1. SUBSCRIPTIONS, MARKET
Table 1: Operators Authorized to Provide Public Fixed Domestic Telecommunications Services as at 2010
 2. Fixed Telephony Market Data As at December 2010, there were eight (8) operators authorized to provide fixed domestic telecommunications services to the public over wired or wireless facilities. These
POSTAL AND TELECOMMUNICATIONS REGULATORY AUTHORITY OF ZIMBABWE (POTRAZ)
") POSTAL AND TELECOMMUNICATIONS REGULATORY AUTHORITY OF ZIMBABWE (POTRAZ) POSTAL AND TELECOMMUNICATIONS SECTOR PERFORMANCE REPORT FOURTH QUARTER 2015 Disclaimer: This report has been prepared based on data
POSTAL AND TELECOMMUNICATIONS REGULATORY AUTHORITY OF ZIMBABWE (POTRAZ) POSTAL AND TELECOMMUNICATIONS SECTOR PERFORMANCE REPORT FOURTH QUARTER 2015 Disclaimer: This report has been prepared based on data
Telecommunications market data tables Q1 2016
 Telecommunications market data tables Q1 2016 1 Market monitor 2 Fixed telecoms market data tables 3 Mobile telecoms market data tables Published: 11 August 2016-1 - 1. Market monitor In the following
The Norwegian Electronic Communications Services Market
 The Norwegian Electronic Communications Services Market 1 st half 2014 30 October 2014 Revised 13 November 2014 Contents 1 Introduction... 6 2 Development trends... 7 2.1 Telephony... 7 2.2 Fied and mobile
QUARTERLY STATISTICAL BULLETIN ON COMMUNICATIONS IN GHANA
 QUARTERLY STATISTICAL BULLETIN ON COMMUNICATIONS IN GHANA Volume 2 Issue 1 NATIONAL COMMUNICATIONS AUTHORITY FIRST QUARTER JANUARY - MARCH, 2017 Communications for Development QUARTERLY STATISTICAL BULLETIN
POSTAL AND TELECOMMUNICATIONS REGULATORY AUTHORITY OF ZIMBABWE (POTRAZ)
") POSTAL AND TELECOMMUNICATIONS REGULATORY AUTHORITY OF ZIMBABWE (POTRAZ) ABRIDGED POSTAL & TELECOMMUNICATIONS SECTOR PERFORMANCE REPORT FOURTH QUARTER 2018 Disclaimer: This report has been prepared based
POSTAL AND TELECOMMUNICATIONS REGULATORY AUTHORITY OF ZIMBABWE (POTRAZ) ABRIDGED POSTAL & TELECOMMUNICATIONS SECTOR PERFORMANCE REPORT FOURTH QUARTER 2018 Disclaimer: This report has been prepared based
REPUBLIC OF RWANDA RWANDA UTILITIES REGULATORY AGENCY
 REPUBLIC OF RWANDA RWANDA UTILITIES REGULATORY AGENCY STATISTICS AND TARIFF INFORMATION IN TELECOM SECTOR AS OF SEPTEMBER 2012 CONTENTS 1. MOBILE AND FIXED TELEPHONE SERVICE... 3 1.1. SUBSCRIPTIONS, MARKET
POSTAL AND TELECOMMUNICATIONS REGULATORY AUTHORITY OF ZIMBABWE (POTRAZ)
") POSTAL AND TELECOMMUNICATIONS REGULATORY AUTHORITY OF ZIMBABWE (POTRAZ) POSTAL AND TELECOMMUNICATIONS PERFORMANCE REPORT SECTOR THIRD QUARTER Disclaimer: This report has been prepared based on data provided
POSTAL AND TELECOMMUNICATIONS REGULATORY AUTHORITY OF ZIMBABWE (POTRAZ) POSTAL AND TELECOMMUNICATIONS PERFORMANCE REPORT SECTOR THIRD QUARTER Disclaimer: This report has been prepared based on data provided
Telecommunications market data tables Q1 2013
 Telecommunications market data tables Q1 2013 1 Market monitor 2 Fixed telecoms market data tables 3 Mobile telecoms market data tables Published: 22 August 2013-1 - 1. Market monitor We have made restatements
ANALYSIS OF THE TELECOMMUNICATIONS SECTOR EVOLUTION AT 30 th SEPTEMBER 2011
 ANALYSIS OF THE TELECOMMUNICATIONS SECTOR EVOLUTION AT 30 th SEPTEMBER 2011 1- Highlights at 30 th September 2011 Evolution of Tariffs (ARPM 1 ), average usage 2 of fixed and mobile telephony and the average
POSTAL AND TELECOMMUNICATIONS REGULATORY AUTHORITY OF ZIMBABWE (POTRAZ)
") POSTAL AND TELECOMMUNICATIONS REGULATORY AUTHORITY OF ZIMBABWE (POTRAZ) POSTAL & TELECOMMUNICATIONS SECTOR PERFORMANCE REPORT THIRD QUARTER 2016 Disclaimer: This report has been prepared based on data
POSTAL AND TELECOMMUNICATIONS REGULATORY AUTHORITY OF ZIMBABWE (POTRAZ) POSTAL & TELECOMMUNICATIONS SECTOR PERFORMANCE REPORT THIRD QUARTER 2016 Disclaimer: This report has been prepared based on data
Proceedings of the International Conference on Industrial Engineering and Operations Management Washington DC, USA, September 27-29, 2018
 Impact of Number Portability on Revenue of Mobile Operators in Nigeria; Comparing Churning Rate in MTN, Glo, Etisalat and Airtel Nsikan Nkordeh 1, Uzairue Stanley 2, Victor Matthews Olu 3, Segun Popoola
IPTV Statistics market analysis
 IPTV Statistics market analysis Q2 2012 October 2012 Point Topic Ltd 73 Farringdon Road London EC1M 3JQ, UK Tel. +44 (0) 20 3301 3305 Email laura.kell@point-topic.com 2 Contents 1 Introduction 3 2 Global
MARKET OBSERVATORY : THE TELECOMMUNICATIONS SERVICES MARKET IN FRANCE AT THE FOURTH QUARTER 2004 (declared operators) May 2005
 May 2005") : THE TELECOMMUNICATIONS SERVICES MARKET IN FRANCE AT THE FOURTH QUARTER 20 (declared operators) May 25 2 Introduction At the fourth quarter 20, the electronic communications market in France represented
: THE TELECOMMUNICATIONS SERVICES MARKET IN FRANCE AT THE FOURTH QUARTER 20 (declared operators) May 25 2 Introduction At the fourth quarter 20, the electronic communications market in France represented
Telecommunications market data tables Q2 2015
 Telecommunications market data tables Q2 2015 1 Market monitor 2 Fixed telecoms market data tables 3 Mobile telecoms market data tables Published: 12 November 2015-1 - 1. Market monitor In the following
THE FRENCH TELECOMMUNICATIONS SERVICES MARKET 4 th QUARTER 2002 (Licensed operators) June 2003
 June 2003") THE FRENCH TELECOMMUNICATIONS SERVICES MARKET 4 th QUARTER (Licensed operators) June 2003 2 Introduction Fixed telephony The fixed telephony sector continued to decline in. However carrier selection subscriptions
THE FRENCH TELECOMMUNICATIONS SERVICES MARKET 4 th QUARTER (Licensed operators) June 2003 2 Introduction Fixed telephony The fixed telephony sector continued to decline in. However carrier selection subscriptions
The Impact of the Call Termination Rate Reduction on Consumer Surplus in South Africa
 The Impact of the Call Termination Rate Reduction on Consumer Surplus in South Africa Ryan Hawthorne Senior Associate, Centre for Competition, Regulation and Economic Development (CCRED, University of
REPUBLIC OF RWANDA RWANDA UTILITIES REGULATORY AGENCY
 REPUBLIC OF RWANDA RWANDA UTILITIES REGULATORY AGENCY STATISTICS AND TARIFF INFORMATION IN TELECOM SECTOR AS OF DECEMBER 2012 CONTENTS 1. MOBILE AND FIXED TELEPHONE SERVICE... 4 1.1. SUBSCRIPTIONS, MARKET
POSTAL AND TELECOMMUNICATIONS REGULATORY AUTHORITY OF ZIMBABWE (POTRAZ)
") POSTAL AND TELECOMMUNICATIONS REGULATORY AUTHORITY OF ZIMBABWE (POTRAZ) ABRIDGED POSTAL & TELECOMMUNICATIONS SECTOR PERFORMANCE REPORT FOURTH QUARTER 2016 Disclaimer: This report has been prepared based
POSTAL AND TELECOMMUNICATIONS REGULATORY AUTHORITY OF ZIMBABWE (POTRAZ) ABRIDGED POSTAL & TELECOMMUNICATIONS SECTOR PERFORMANCE REPORT FOURTH QUARTER 2016 Disclaimer: This report has been prepared based
POSTAL AND TELECOMMUNICATIONS REGULATORY AUTHORITY OF ZIMBABWE (POTRAZ)
") POSTAL AND TELECOMMUNICATIONS REGULATORY AUTHORITY OF ZIMBABWE (POTRAZ) POSTAL AND TELECOMMUNICATIONS PERFORMANCE REPORT SECTOR SECOND QUARTER 2016 Disclaimer: This report has been prepared based on data
POSTAL AND TELECOMMUNICATIONS REGULATORY AUTHORITY OF ZIMBABWE (POTRAZ) POSTAL AND TELECOMMUNICATIONS PERFORMANCE REPORT SECTOR SECOND QUARTER 2016 Disclaimer: This report has been prepared based on data
AN OVERVIEW OF THE ELECTRONIC COMMUNICATIONS MARKET IN THE REPUBLIC OF SERBIA. The Fourth Quarter of 2017
 AN OVERVIEW OF THE ELECTRONIC COMMUNICATIONS MARKET IN THE REPUBLIC OF SERBIA The Fourth Quarter of 2017 The Overview presents the data for the fourth quarter of 2017 along with comparative data for other
RTR Telecom Monitor. Annual Review 2011 BEREC CHAIR 2012 AUSTRIA
 RTR Telecom Monitor Annual Review 211 BEREC CHAIR 212 AUSTRIA Table of contents Preface 5 Section 1 Fixed network 7 Fixed lines and penetration 8 Development of fixed lines 9 Preselected lines and call-by-call
Information & Communication Technology Statistics 2017
 Information & Communication Technology Statistics 2017 STATISTICS BOTSWANA Private Bag 0024 Gaborone Botswana Tel: (+267) 367 1300. Fax: (+267) 395 2201. Toll Free: 0800 600 200 Email: info@statsbots.org.bw
The Norwegian Electronic Communication Service Market. May Revised September
 The Norwegian Electronic Communication Service Market 2014 May 20 2015 Revised September 9 2015 1 Key figures 2013 2014 Change Fied telephony: Total number of subscribers to fied telephony 1 235 248 1
STATISTICS AND TARIFF INFORMATION IN TELECOM SECTOR AS OF DECEMBER 2013
 STATISTICS AND TARIFF INFORMATION IN TELECOM SECTOR AS OF DECEMBER 2013 Prepared by: Economic and Market Analysis Section CONTENTS I. preliminary remarks... 5 II. summary... 5 1. MOBILE AND FIXED TELEPHONE
MOBILE PRICE BASKETS (DECEMBER 2007 v1.1)
") MOBILE PRICE BASKETS (DECEMBER 2007 v1.1) Background Three kinds of price indicators: T-Baskets, OECD (http://www.teligen.com/t_basket.asp) OECD-based and OECD-authorized; takes pricing information from
MOBILE PRICE BASKETS (DECEMBER 2007 v1.1) Background Three kinds of price indicators: T-Baskets, OECD (http://www.teligen.com/t_basket.asp) OECD-based and OECD-authorized; takes pricing information from
Quarterly Market Indicators Q1 2018
 Quarterly Market Indicators Q1 2018 1 Content Disclaimer Page 3 Mobile services Page 4 Fixed line telephony services Page 6 Broadband services Page 8 Definitions Page 10 2 Disclaimer TRA has relied on
Communications Market Review
 ``` ``` ``` `` ``` `` ``` `` ``` Communications Market Review Document No: MCA/R/17-3044 Date: 7 th December 2017 Table of Contents 1. Reporting parameters... 4 1.1. The reporting period and data cut-off
Quarterly Market Indicators Q2 2017
 Quarterly Market Indicators Disclaimer Page 3 Mobile services Page 4 Fixed line telephony services Page 6 CONTENT Broadband services Definitions Page 8 Page 10 Disclaimer TRA has relied on information
POSTAL AND TELECOMMUNICATIONS REGULATORY AUTHORITY OF ZIMBABWE (POTRAZ)
") POSTAL AND TELECOMMUNICATIONS REGULATORY AUTHORITY OF ZIMBABWE (POTRAZ) ABRIDGED POSTAL & TELECOMMUNICATIONS SECTOR PERFORMANCE REPORT THIRD QUARTER 2017 Disclaimer: This report has been prepared based
POSTAL AND TELECOMMUNICATIONS REGULATORY AUTHORITY OF ZIMBABWE (POTRAZ) ABRIDGED POSTAL & TELECOMMUNICATIONS SECTOR PERFORMANCE REPORT THIRD QUARTER 2017 Disclaimer: This report has been prepared based
INDUSTRY INFORMATION - TELECOM SUBSCRIPTIONS FOR JULY National Communications Authority
 INDUSTRY INFORMATION - TELECOM SUBSCRIPTIONS FOR JULY 2017 National Communications Authority SEPTEMBER 29, 2017 1 P a g e Table of Contents 1. Introduction... 4 2. Mobile Voice Subscription for July 2017...
POSTAL AND TELECOMMUNICATIONS REGULATORY AUTHORITY OF ZIMBABWE (POTRAZ)
") POSTAL AND TELECOMMUNICATIONS REGULATORY AUTHORITY OF ZIMBABWE (POTRAZ) ABRIDGED POSTAL AND TELECOMMUNICATIONS SECTOR PERFORMANCE REPORT SECOND QUARTER 2015 Disclaimer: This report has been prepared based
POSTAL AND TELECOMMUNICATIONS REGULATORY AUTHORITY OF ZIMBABWE (POTRAZ) ABRIDGED POSTAL AND TELECOMMUNICATIONS SECTOR PERFORMANCE REPORT SECOND QUARTER 2015 Disclaimer: This report has been prepared based
POSTAL AND TELECOMMUNICATIONS REGULATORY AUTHORITY OF ZIMBABWE (POTRAZ)
") POSTAL AND TELECOMMUNICATIONS REGULATORY AUTHORITY OF ZIMBABWE (POTRAZ) ABRIDGED POSTAL & TELECOMMUNICATIONS SECTOR PERFORMANCE REPORT FOURTH QUARTER 2017 Disclaimer: This report has been prepared based
POSTAL AND TELECOMMUNICATIONS REGULATORY AUTHORITY OF ZIMBABWE (POTRAZ) ABRIDGED POSTAL & TELECOMMUNICATIONS SECTOR PERFORMANCE REPORT FOURTH QUARTER 2017 Disclaimer: This report has been prepared based
RTR Telecom Monitor. Annual Review 2012
 RTR Telecom Monitor Annual Review BEREC Vice Chair 213 AUSTRIA RTR Telekom Monitor Annual Review Table of contents Preface 5 Section 1 Fixed network 7 Fixed lines 8 Fixed-line penetration 9 Development
INDUSTRY INFORMATION - TELECOM SUBSCRIPTIONS FOR FEBRUARY 2016
 INDUSTRY INFORMATION - TELECOM SUBSCRIPTIONS FOR FEBRUARY 2016 National Communications Authority FEBRUARY 29, 2016 1 P age Contents 1. Introduction... 4 2. Mobile Voice Subscription Trends For February
TABLE OF CONTENTS. Broadband Key Indicators and Sector Findings. Preface. Subscriber Television Revenue. ICT Development Index Investment
 1 PREFACE 2 The Eastern Caribbean Telecommunications Authority (ECTEL) produces a review of the electronic communications sector annually. This report provides information on the performance and economic
The 13 th Progress Report on the Single European Telecoms Market 2007: Frequently Asked Questions
 MEMO/08/17 Brussels, 19 March 2008 The 13 th Progress Report on the Single European Telecoms Market 2007: Frequently Asked Questions 1. What is the objective of the 13 th Progress Report on the Single
ANALYSIS OF THE TELECOMMUNICATIONS SECTOR EVOLUTION AT 30 th JUNE 2011
 ANALYSIS OF THE TELECOMMUNICATIONS SECTOR EVOLUTION AT 30 th JUNE 2011 1- Highlights at 30 June 2011 Evolution of Tariffs (ARPM 1 ), average usage 2 of fixed and mobile telephony and the average monthly
STATISTICS AND TARIFF INFORMATION IN TELECOM SECTOR AS OF SEPTEMBER 2013
 STATISTICS AND TARIFF INFORMATION IN TELECOM SECTOR AS OF SEPTEMBER 2013 Prepared by: Economic and Market Analysis Section CONTENTS I. preliminary remarks... 4 II. summary... 4 1. MOBILE AND FIXED TELEPHONE
n Segments at a Glance
 for the Fiscal Year Ended March 31, 214 by Segment n Segments at a Glance From the fiscal year ended March 31, 213, KDDI has realigned its reportable segments into four business segments based on management
MOBILE MONITORING REPORT
 Project no. 13.03/12854 Public version MOBILE MONITORING REPORT August to October 2011 Date: 20 December 2011 2 Purpose The Commission issued the standard terms determination () for mobile termination
Google Inc net consolidated revenues: 27.2 billion euro
 5.1. Google Presentation Google Inc. 2011 net consolidated revenues: 27.2 billion euro Advertising Google Websites 77% of net sales Fiscal year ended December 31, 2011 Advertising Network Members Websites
THE TELECOMMUNICATIONS SECTOR EVOLUTION AT 31 st MARCH 2011
 THE TELECOMMUNICATIONS SECTOR EVOLUTION AT 31 st MARCH 2011 Mobile Telephony Market 1 At the end of the first quarter of 2011, the number of mobile subscribers reached 33 375 498, with a quarterly growth
POSTAL AND TELECOMMUNICATIONS REGULATORY AUTHORITY OF ZIMBABWE (POTRAZ)
") POSTAL AND TELECOMMUNICATIONS REGULATORY AUTHORITY OF ZIMBABWE (POTRAZ) ABRIDGED POSTAL & TELECOMMUNICATIONS SECTOR PERFORMANCE REPORT FIRST QUARTER 2017 Disclaimer: This report has been prepared based
POSTAL AND TELECOMMUNICATIONS REGULATORY AUTHORITY OF ZIMBABWE (POTRAZ) ABRIDGED POSTAL & TELECOMMUNICATIONS SECTOR PERFORMANCE REPORT FIRST QUARTER 2017 Disclaimer: This report has been prepared based
POSTAL AND TELECOMMUNICATIONS REGULATORY AUTHORITY OF ZIMBABWE (POTRAZ) ABRIDGED POSTAL & TELECOMMUNICATION SECTOR PERFORMANCE REPORT
 ABRIDGED POSTAL & TELECOMMUNICATION SECTOR PERFORMANCE REPORT") POSTAL AND TELECOMMUNICATIONS REGULATORY AUTHORITY OF ZIMBABWE (POTRAZ) ABRIDGED POSTAL & TELECOMMUNICATION SECTOR PERFORMANCE REPORT SECOND QUARTER 2018 Disclaimer: This report has been prepared based
POSTAL AND TELECOMMUNICATIONS REGULATORY AUTHORITY OF ZIMBABWE (POTRAZ) ABRIDGED POSTAL & TELECOMMUNICATION SECTOR PERFORMANCE REPORT SECOND QUARTER 2018 Disclaimer: This report has been prepared based
CONSOLIDATED RESULTS FOR Q1 2012
 PRESS RELEASE Rabat, April 26, 2012 CONSOLIDATED RESULTS FOR Q1 2012 Results show very positive momentum with the recovery of growth in revenue and margins and the 12.6% expansion of the Group s customer
DRAFT. Measuring KSA Broadband. Meqyas, Q Report
 DRAFT Measuring KSA Broadband Meqyas, Q3 218 Report In 217, the CITC in partnership with SamKnows launched a project to measure internet performance. The project, named Meqyas, gives internet users in
RTR TELEKOM MONITOR ANNUAL REVIEW 2016
 RTR TELEKOM MONITOR ANNUAL REVIEW RTR Telekom Monitor Annual Review Contents Preface 5 1 Mobile communications 7 Mobile penetration 8 Retail revenues from mobile communications 9 Call minutes on the retail
Regional Focus: Asia Pacific - the world's largest mobile phone market
 Regional Focus: Asia Pacific - the world's largest mobile phone market Euromonitor International 10 March 2010 Asia Pacific has the highest number of mobile phone subscriptions of all world regions, yet
Analysis of interconnect usage charges in India
 Viewpoint Analysis of interconnect usage charges in India Sourabh Kaushal April 2011 2 Summary: Analysis of interconnect usage charges in India In India the Interconnect Usage Charges (IUC) were introduced
Published by the Eastern Caribbean Telecommunications Authority (ECTEL)
") ECTEL MEMBER STATES Commonwealth of Dominica Grenada The Federation of St. Christopher (St. Kitts) and Nevis Saint Lucia St. Vincent and the Grenadines Copyright 2015 Published by the Eastern Caribbean
ECTEL MEMBER STATES Commonwealth of Dominica Grenada The Federation of St. Christopher (St. Kitts) and Nevis Saint Lucia St. Vincent and the Grenadines Copyright 2015 Published by the Eastern Caribbean
AN OVERVIEW OF THE ELECTRONIC COMMUNICATIONS MARKET IN THE REPUBLIC OF SERBIA
 AN OVERVIEW OF THE ELECTRONIC COMMUNICATIONS MARKET IN THE REPUBLIC OF SERBIA The First Quarter of 2018 The Overview presents the data for the first quarter of 2018 along with comparative data for the
POSTAL AND TELECOMMUNICATIONS REGULATORY AUTHORITY OF ZIMBABWE (POTRAZ)
") POSTAL AND TELECOMMUNICATIONS REGULATORY AUTHORITY OF ZIMBABWE (POTRAZ) ABRIDGED POSTAL & TELECOMMUNICATIONS SECTOR PERFORMANCE REPORT SECOND QUARTER 2017 Disclaimer: This report has been prepared based
POSTAL AND TELECOMMUNICATIONS REGULATORY AUTHORITY OF ZIMBABWE (POTRAZ) ABRIDGED POSTAL & TELECOMMUNICATIONS SECTOR PERFORMANCE REPORT SECOND QUARTER 2017 Disclaimer: This report has been prepared based
THE TELECOMMUNICATIONS SECTOR EVOLUTION AT 30 th JUNE 2008
 THE TELECOMMUNICATIONS SECTOR EVOLUTION AT 30 th JUNE 2008 Mobile Telephony Market At the end of the second quarter of 2008, the number of mobile subscribers reached 21 411 705, with a growth of 3,86%.
Communications Market Review. July to December 2012
 Communications Market Review Document No: MCA/R/13-1548 Date: 11 April 2013 Table of Contents 1. Reporting parameters... 4 2. Key market outcomes... 6 2.1. The performance of electronic communications
Cincinnati Bell Third Quarter 2011 Results. November 3, 2011
 Cincinnati Bell Third Quarter 2011 Results November 3, 2011 Today s Agenda Performance Highlights Jack Cassidy, President & Chief Executive Officer Review of Wireline, Wireless, IT Services & Hardware
RTR TELEKOM MONITOR 2017 Annual Report
 RTR TELEKOM MONITOR Annual Report 20 17 www.rtr.at Austrian Regulatory Authority for Broadcasting and Telecommunications (Rundfunk und Telekom Regulierungs-GmbH) Mariahilfer Strasse 77 79, 1060 Vienna,
Electronic communications in France: key figures
 RÉPUBLIQUE FRANÇAISE June 211 Electronic communications in France: key figures Figures for 21 Operator characteristics Unless otherwise stated, the figures in this document are for 21. GENERAL MARKET DATA
Economic situation and outlook
 Economic situation and outlook ELECTRONICS AND ELECTROTECHNICAL INDUSTRY MECHANICAL ENGINEERING METALS INDUSTRY CONSULTING ENGINEERING INFORMATION TECHNOLOGY Global and Finnish Economic Outlook Better
Telecommunication Markets in the Nordic and Baltic Countries. - Per
 Telecommunication Markets in the Nordic and Baltic Countries - Per 3.2.202 - About the database Established 2007 The Baltic States included spring 203 A descriptive database A selected number of variables
Cost of Ownership: CDMA 2000 Competitive Advantage. Paul Edwards Chairman Starcomms, Nigeria
 Cost of Ownership: CDMA 2000 Competitive Advantage Paul Edwards Chairman Starcomms, Nigeria Teledensity Facts & Figures > Teledensity & Internet Penetration has a direct positive impact on levels of economic
Annex B. International price comparisons and development of the prices in the retail market for mobile phone services in Iceland
 Annex B International price comparisons and development of the prices in the retail market for mobile phone services in Iceland 5 February 2007 TABLE OF CONTENTS 1 METHODOLOGY...3 2 INTERNATIONAL PRICE
BGP The Movie. Geoff Huston September 2004 APNIC
 BGP The Movie Geoff Huston September 2004 APNIC 1 IPv4 Routing Table Size Data assembled from a variety of sources, Including Surfnet, Telstra, KPN and Route Views. Each colour represents a time series
COMMUNICATION FROM THE COMMISSION TO THE EUROPEAN PARLIAMENT, THE COUNCIL, THE EUROPEAN ECONOMIC AND SOCIAL COMMITTEE AND THE COMMITTEE OF THE REGIONS
 EUROPEAN COMMISSION Brussels, 29.6.2010 COM(2010)356 final COMMUNICATION FROM THE COMMISSION TO THE EUROPEAN PARLIAMENT, THE COUNCIL, THE EUROPEAN ECONOMIC AND SOCIAL COMMITTEE AND THE COMMITTEE OF THE
Leichtman Research Group Research Notes
 4Q 2018 Leichtman Research Group Research Notes Actionable Research on the Broadband, Media & Entertainment Industries In this issue: An Evolving Internet A An Evolving Internet 83% of U.S. Households
Section 2.0 CMR Canada s Communication System: An Overview for Canadians
 1 2 Canada s Communication System: An Overview for Canadians 3 The CRTC continues to strengthen its efforts to place Canadians at the centre of the communication system, whether as consumers of communications
2 ICT in Aruba introduction Central Bureau of Statistics Aruba
 ICT in Aruba 21 2 ICT in Aruba 21 2 introduction Central Bureau of Statistics Aruba TABLE OF CONTENT INTRODUCTION... 5 COMPUTERS... 5 REGION... 5 TYPE OF HOUSEHOLD... 7 HOUSEHOLD SIZE AND AVERAGE AGE OF
AN OVERVIEW OF THE ELECTRONIC COMMUNICATIONS MARKET IN THE REPUBLIC OF SERBIA
 AN OVERVIEW OF THE ELECTRONIC COMMUNICATIONS MARKET IN THE REPUBLIC OF SERBIA The Second Quarter of 2017 The Overview presents the data for the second quarter of 2017 along with comparative data for the
International gateway liberalization
 International gateway liberalization WSIS Facilitation Meeting on Action Line C6 ITU Headquarters, Geneva, 20 Infrastructure sharing: extending ICT access to all Vaiva Lazauskaite vaiva.lazauskaite@itu.int
Telecommunication Markets in the Nordic Countries. - Per
 Telecommunication Markets in the Nordic Countries - Per 3.2.20 - About the Nordstat database Established 2007 A descriptive database A selected number of variables that is comparable between the Nordic
Midsize Business Voice Service Spending Steady for 2003
 End-User Analysis Midsize Business Voice Service Spending Steady for 23 Abstract: Telecom service providers need to know the voice telecom spending plans of the margin-rich midsize business segment in
Disentangling the broadband divide in Rwanda: supply-side vs demand-side
 Disentangling the broadband divide in Rwanda: supply-side vs demand-side Rwanda is ranked ninth out of 38 African countries in terms of mobile broadband affordability It performs better than leading African
Executive Summary TELEGEOGRAPHY REPORT EXECUTIVE SUMMARY. FIGURE 1 International Traffic Growth,
 Executive Summary 2015 marked a turning point in the market the first time since the Great Depression that international carrier voice traffic declined. In the 1930s, the decline in traffic was due to
INTERNET MARKET IN MOROCCO
 INTERNET MARKET IN MOROCCO Quarterly Observatory* -December 2012- This document is to be considered for information purposes only. Summary Introduction 3 I II Recall of various types of Internet access
NinthDecimal Mobile Audience Q Insights Report
 Q1 2012 Insights Report Table of Contents Connected Device Trends 2-3 Mobile Shopping Behavior 4-5 Location Trends 6-7 Connected Device Adoption 8-9 On-the-go Consumers 37 % Worldwide Location Highlights
MAIL DIVERSION. This paper focuses primarily on the forecasted impact of technology on postal volumes
 MAIL DIVERSION Mail volumes are under attack from a number of sources: technological diversion, the economy, competition, regulatory changes, business consolidation and other factors. This paper focuses
Cincinnati Bell Inc. March 4, 2013
 Cincinnati Bell Inc. March 4, 2013 Safe Harbor This presentation and the documents incorporated by reference herein contain forwardlooking statements regarding future events and our future results that
Connector Industry Forecast
 Report No.: F 2017 01 June 2017 Bishop & Associates has just released the Connector Industry Forecast. This eight-chapter report provides an in-depth, and detailed forecast of the worldwide connector Industry.
The Effectiveness of Mobile Wireless Service as a Competitive Constraint on Landline Pricing: Was the DOJ Wrong?
 11 December 2008 The Effectiveness of Mobile Wireless Service as a Competitive Constraint on Landline Pricing: Was the DOJ Wrong? William E. Taylor and Harold Ware 1 The US Department of Justice (DOJ)
Methodology for Constructing Wireless Broadband Price Baskets
 Please cite this paper as: OECD (2012), Methodology for Constructing Wireless Broadband Price Baskets, OECD Digital Economy Papers, No. 205, OECD Publishing, Paris. http://dx.doi.org/10.1787/5k92wd5kw0nw-en
Chapter 3 Information and Communication Technology (ICT) and EEE Consumption Trends
 and EEE Consumption Trends") Chapter 3 Information and Communication Technology (ICT) and EEE Consumption Trends The global information society is growing at great speed. More and faster networks, and new applications and services
Chapter 3 Information and Communication Technology (ICT) and EEE Consumption Trends The global information society is growing at great speed. More and faster networks, and new applications and services
Quarterly Market indicators. Data at the end of Q4 2013
 Quarterly Market indicators Data at the end of Q4 2013 2014 Contents Disclaimer Page 3 Mobile services Page 4 Broadband services Page 5 Fixed telephony services Page 7 Definitions Page 8 2 Disclaimer TRA
Average Revenue per User (ARPU) measures the average monthly revenue generated per customer Average Usage per User (AUPU) measures the average
 measures the average monthly revenue generated per customer Average Usage per User (AUPU) measures the average") Introduction Key Definitions Key Market Trends & Observations Economic Indicators for the BVI Main Telecoms Indicators Total Revenue in the Telecoms Sector Total Mobile Communications Investment Employment
Introduction Key Definitions Key Market Trends & Observations Economic Indicators for the BVI Main Telecoms Indicators Total Revenue in the Telecoms Sector Total Mobile Communications Investment Employment
QUARTERLY FORECAST REPORT 1ST QUARTER
 QUARTERLY FORECAST REPORT 1ST QUARTER 216 77 Sundial Ave. Manchester, NH 313 E-mail: ptda@itreconomics.com Table of Contents Definitions & Methodology.... 3 MTI Total Sales... 4 Monthly Data Record...
Telecommunications Customer Satisfaction
 Telecommunications Customer Satisfaction Results of Wave 18 of polling undertaken by Roy Morgan Research for Communications Alliance Ltd in March 2018 Research Objective Roy Morgan Research is tracking
BROADBAND TAKE-UP DRAMATICALLY SLOWS ACROSS EUROPE. ECTA blames rise in monopolies
 Release Immediate BROADBAND TAKE-UP DRAMATICALLY SLOWS ACROSS EUROPE ECTA blames rise in monopolies Brussels, 01.02.07 The European Competitive Telecommunications Association (ECTA) has reported a significant
Osondu Nwokoro. Affordable*Internet*for*All* Driven*by*Open*Access*&*Infrastructure*Sharing:* The*Nigerian*Experience.
 Affordable*Internet*for*All* Driven*by*Open*Access*&*Infrastructure*Sharing:* The*Nigerian*Experience Osondu Nwokoro Alliance for Affordable Internet (A4AI) Meeting Accra, Ghana 12 November, 2014 Outline
Quarterly Market Indicators Q2 2016
 Quarterly Market Indicators Disclaimer Page 3 Mobile services Broadband services Page 4 Page 5 CONTENT Fixed telephony services Page 7 Definitions Page 8 Disclaimer TRA does not make any representations
QUALCOMM Reports First Quarter Results Revenues $941 Million, $.65 EPS
 Contact: Julie Cunningham Vice President, Investor Relations Ph 619-658-4224 Fax 619-651-9303 E-mail: juliec@qualcomm.com QUALCOMM Reports First Quarter Results Revenues $941 Million, $.65 EPS SAN DIEGO
ICT Policy in Japan - Broadband and Mobile -
 ICT Policy in Japan - Broadband and Mobile - April 16, 2009 Hiroyuki HISHINUMA Director for New Competition Policy Telecommunications Policy Division Telecommunications Business Department Telecommunications
DUTCH BENCHMARK The 2017 Edition
 DUTCH EMAIL BENCHMARK 07 Management summary Dutch National Email Benchmark 07 With the increased digitalization of societies and due to the high return on investment, the use of email marketing is strategically
DigiTimes Research: ICT Report - 1Q Taiwan s handsets
 DigiTimes Research: ICT Report - 1Q 2005 Taiwan s handsets Introduction 2 Chart 1: Taiwan handset shipments, 3Q03-2Q05 (k units) 2 The first quarter 3 OBM, ODM and OEM shipments 3 Chart 2: Taiwan handset
Copyrights Statistics Botswana 2016
 STATISTICS BOTSWANA Information and Communications Technology Statistics Report 2014 Copyrights Statistics Botswana 2016 ISBN: 978-99968-477-3-2 Statistics Botswana. Private Bag 0024 Botswana Tel: (267)