UBS 2006 Global Communications and Technology Conference. November 16, 2006
|
|
|
- Dustin Heath
- 6 years ago
- Views:
Transcription

1 UBS 2006 Global Communications and Technology Conference November 16, 2006

2 William E. Keitel Executive Vice President and Chief Financial Officer
3 Safe Harbor Before we proceed with our presentation, we would like to point out that the following discussion will contain forward-looking statements from industry consultants, QUALCOMM, and others regarding industry trends, anticipated future results, potential market size, market shares, and other factors which inherently involve risks and uncertainties, including the rate of development, deployment and commercial acceptance of CDMA-based networks and technology and fluctuations in the demand for CDMA-based products, services or applications. These and other risks and uncertainties relating to QUALCOMM s business are outlined in detail in our most recent 10-Q and 10-K forms filed with the Securities and Exchange Commission. Please consult those documents for a more complete understanding of these risks and uncertainties. This presentation includes a discussion of "non-gaap financial measures" as that term is defined in Regulation G. The most directly comparable GAAP financial measures and information reconciling these non-gaap financial measures to the company's financial results prepared in accordance with GAAP have been included at the end of this presentation.

4 Financial Highlights Fiscal 2006 Record revenues $7.53 Billion, up 33% YOY Record net income $2.47 Billion GAAP, up 15% YOY $2.80 Billion pro forma, up 42% YOY Record EPS $1.44 GAAP, up 14% YOY $1.64 pro forma, up 41% YOY Record operating cash flow $3.25 Billion operating cash flow, up 21% YOY $3.18 Billion pro forma free cash flow, up 42% YOY Continued to achieve same-day filing of earnings release and SEC report (forms 10-Q and 10-K) Note: Pro forma results exclude the QSI segment, estimated share-based compensation, certain tax adjustments related to prior years and acquired in-process R&D expense. Note: Free cash flow defined as net cash provided by operating activities less capital expenditures.
5 Returning Capital to Shareholders Share Repurchase (Billions) $1.50B* $1.00B $0.15 $0.16B Quarterly Cash Dividend per Common Share Based on Date Payable FY2003 FY2005 FY2006 $0.12 $0.10 $0.07 $0.09 $0.05 $0.025 $0.035 $0.05 $0.00 Mar'03 Jun'03 Sep'03 Dec'03 Mar'04 Jun'04 Sep'04 Jan'05 Mar'05 Jun'05 Sep'05 Jan'06 Mar'06 Jun'06 Sep'06 Jan'07** Note: The Company affected a two-for-one stock split in August All references to per share data have been adjusted to reflect the stock split. *Gross repurchases. Authorized $2.5B on November 7, 2005, no expiration date. As of November 2, 2006, $0.9B remains authorized for repurchase. **As of Oct 5, 2006
6 Data Increasing Operators Revenues Data as a Percent of Service Revenues 14.1% 8.4% CDMA ARPU over $10, iden <$5 15% 10% 5% Q3' % VZW Q3' % 0% Q3'05 Q3'06 Sprint Nextel Source: Wireless Intelligence; Verizon Wireless; Sprint Nextel Q2'05 TIM Italy Q2'06
7 CDMA2000 Capitalizing on Scale Nearly 200 Commercial Operators Common Specifications, Lower Handset Prices, Spectral Efficiency 1X EV-DO 1X + EV-DO Commercial CDMA2000 Operators Nov'05 Nov'06 Source: CDG, November 9, 2006
8 Operators Leveraging EV-DO Rev A Capabilities QChat the Killer Application for DOrA at Sprint Nextel Driving iden to CDMA migration < 1sec latency Push to Anything (PTX) Multi-cast Priority QoS VoIP EV-DO Rev A ~70% of total in Q406 Announced plans to launch Rev A: Launching December Already launched! Q2'06 Q3'06 Q4'06 Other Rev A equivalent channels QCT shipments

9 GSM Transitioning to 3G WCDMA
10 WCDMA Handset Revenue Higher Than GSM in Western Europe 100% WCDMA 62% of handset revenue in June qtr 75% 62% WCDMA 50% 25% 38% GSM 0% Dec'03 Mar'04 Jun'04 Sep'04 Dec'04 Mar'05 Jun'05 Sep'05 Dec'05 Mar'06 Jun'06 WCDMA GSM GSM Source: Strategy Analytics & Yankee Group; WCDMA Source: QUALCOMM estimate

11 HSDPA Momentum is Building Worldwide 50% Jump in HSDPA Network Launches in 3 Months


12 New Christmas 3G Vodafone Handsets with QUALCOMM Chips 77% of the handset models are 3G 38% of the 3G models use QUALCOMM chips 25% of the 3G handset models are HSDPA 50% of the HSDPA models use QUALCOMM chips LG KU800 LG L600V Samsung Z540V Samsung ZV40 Samsung Z560V Samsung ZV50 Vodafone 710 Samsung Z400V
 subsume much of the R&D burden associated with specification and technical integration.")
13 Huawei s First Vodafone-branded Consumer 3G Handset In Huawei, Vodafone has found a flexible supplier with neither a brand nor content agenda or associated overhead. Vodafone and Qualcomm (at the chipset level) subsume much of the R&D burden associated with specification and technical integration. - [RCR, November 2006] Exclusive Vodafone-branded consumer 3G handsets across 21 countries for 5 years Costs about 30% less than similar phone Source: Huawei, September 28, 2006 Vodafone 710
14 CDMA and WCDMA (UMTS) Handset Shipments Calendar Year (Millions), Guidance as of November 13, M est. 378M est. WCDMA Europe WCDMA Asia WCDMA ROW (Includes North America) CDMA US/Canada CDMA Latin America CDMA China CDMA India CDMA Korea, Japan, SEA, ROW Excludes China 3G M est. 294M est M * 170M * M actual 2004 actual 2005 actual 2006 midpoint 2007 midpoint WCDMA 4M 22M 50M 98M est. 175M est. CDMA 113M 148M 160M 196M est. 203M est. Total 117M 170M 210M 294M est. 378M est. Note: Regional handset shipment estimates are QUALCOMM midpoint estimates and include data devices, telematics, security devices and some quantity of channel inventory. *WCDMA ROW includes North America


15 FLO Open and Standardized MediaFLO USA Network Operations Center opened Nationwide network build FCC approval in channel 55 Expected Verizon Wireless launch Q107 MediaFLO International UK BSkyB trial Japan QUALCOMM KDDI JV SoftBank pursuing technical study Expecting trials in additional markets

16 Intellectual Property Position ~5,100 Sep 06 Cum Foreign Patents ~25.8K ~1,500 ~4,100 ~1,900 Issued CUM U.S. Total Issued & Applied ~7.4K 6 Granted Granted and Applied Sep 05 Sep 06 Industry recognized patent portfolio essential for all 3G CDMA standards Patents essential / applicable to GSM/GPRS/Edge products Over 960 issued patents and pending patent applications for OFDM/OFDMA (Over 270 from Flarion) Technology and Standards leadership
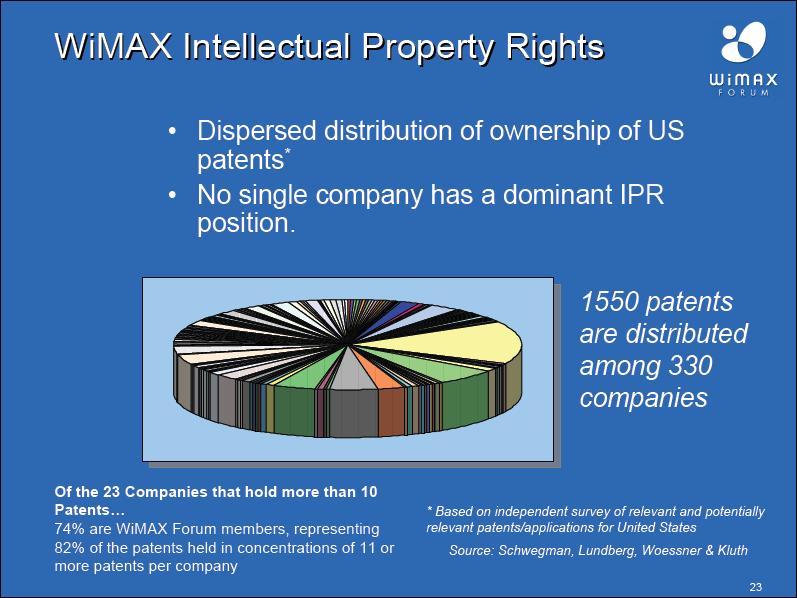
17
18 3G Ecosystem Far Exceeds WiMAX 1,500 1,000 Total 3G Subscribers Worldwide (Millions) WCDMA CDMA2000 Fixed & Mobile WiMAX 854 $500 $400 Worldwide Service and Equipment Revenue, 2009 $508 Service Revenue Equipment Revenue Revenues, $US, Billions $300 $200 $100 $0 $394 $114 $13.4 $10.4 3G Wi-Fi WiMAX Sources: 1. WCDMA & CDMA2000 1xEV-DO: Blended forecast from igr (Feb 06), Strategy Analytics (Jan 06), Wireless Intelligence (July 06) and Yankee Group (June 06) 2. WiMAX: Blended forecast from Strategy Analytics (June 06) and ABI (Q2 06), Maravedis (Sept 06) 1. Strategy Analytics (2006) 2. Average of Strategy Analytics and Yankee Group forecasts (2006) 3. Forward Concepts (2005) 4. Average of Strategy Analytics (2006), Gartner (2006) and Forward Concepts (2005)
19 Forward Link Sector Throughput Comparison 3G Technologies outperform WiMAX in the mobile environment Mbps Mbps/sector Effective FL Physical Layer Throughput per Sector in 10MHz Mobile WiMAX DOrA DOrB HSDPA UMB 4,500 ~ MHz Simulation assumptions: SIMO Full Buffer, Forward Link physical layer performance 3GPP2 frame work DV channel model mix Equalizer gain simulated for DOrA, DOrB and HSDPA Preliminary: 10MHz TDD 2:1Mobile WiMAX sector throughput is 3Mbps, scaled to 10MHz effective Forward Link 5MHz FDD carrier for HSPA+, 2 carriers in 2x10MHz. 1.25MHz FDD carrier for DOrA and DOrB, 7 carriers in 2x10MHz
20 Q1 FY 2007 Guidance As of November 2, 2006 Earnings Release Q4 06 Sep 2006 Results Q1 07 Dec 2006 Guidance 3G MSM phone chips CDMA2000 1X, 1xEV-DO, WCDMA 56M 55-58M CDMA/WCDMA handsets shipped 70M (Jun 06*) 74-76M (Sep 06*) CDMA/WCDMA handset ASP $223 (Jun 06*) $209 (Sep 06*) QUALCOMM Pro Forma** Revenues $1,999M $1.98-$2.08B Operating expense (R&D and SG&A) $575M Sequential inc. 5-8% EPS $0.42 $0.42-$0.44 Total QUALCOMM GAAP Revenues $1,999 $1.98-$2.08B GAAP EPS $0.36 $0.35-$0.37 Includes tax items related to prior years ($0.01) n/a Includes share-based compensation EPS ($0.05) ($0.05) Includes EPS attributable to QSI $0.00 ($0.02) *Royalties are recognized when reported, one quarter following shipment. **Pro forma results exclude the QSI segment, estimated share-based compensation, certain tax adjustments related to prior years and acquired inprocess R&D expense.
21 Fiscal 2007 Financial Guidance as of November 2, 2006 QUALCOMM Pro Forma* QUALCOMM GAAP Revenues $8.1-$8.6B $8.1-$8.6B Year-over-year change 8-14% inc. 8-14% inc. EPS attributable to QSI ($0.11) Diluted EPS $1.76-$1.81 $1.45-$1.50 Year-over-year change 7-10% inc. 1-4% inc. EPS attributable to options expense ($0.20) *Pro forma results exclude the QSI segment, estimated share-based compensation, certain tax adjustments related to prior years and acquired in-process R&D expense. Note: FY07 guidance does not reflect the potential adverse impact on our results, ~$0.04-$0.06 diluted EPS, of Nokia not paying royalties in Q4FY07 for June quarter shipments.
22 Financial Strength ($ Billions) Sep 2005 Sep 2006 Domestic Offshore Cash & Marketable Securities $6.5 $2.2 $8.7 $6.1 $3.8 $9.9 Cash resources and operating flexibility Total Assets $12.5 $15.2 Stockholder s Equity $11.1 $13.4 Solid balance sheet Debt* $0.0 $0.1 EBITDA Pro Forma Free Cash Flow $2.8 $2.2 $3.0 $3.2 Cash flow to support future growth *Debt consists of capital lease obligations
23 Reconciliations
24 Reconciliation of Pro forma to Total QUALCOMM Operating Expenses (defined as SG&A and R&D) ($ in millions) Q4 Fiscal Q FY2006 Guidance* QUALCOMM Pro Forma $ 575 Increase 5-8% sequentially (est.) (1) QSI $ 38 not provided In-process R&D $ 1 n/a Total QUALCOMM excluding share-based compensation under SFAS 123R $ 614 Increase 6-9% sequentially (est.) Share-based compensation allocated to SG&A & R&D $ 118 Total QUALCOMM (GAAP) $ 732 Increase 6-9% sequentially (est.) (2) (1) QUALCOMM Pro Forma guidance for Q1 FY07 excludes expenses related to the QSI segment and estimated share-based compensation. (2) Q1'07 total QUALCOMM (GAAP) operating expense guidance includes an estimate of the share-based compensation expense and estimated allocation to SG&A and R&D related to the Company's adoption of SFAS 123R during the first quarter of fiscal *Guidance as of November 2, 2006
25 TOTAL QUALCOMM (GAAP) OPERATING CASH FLOW RECONCILIATION OF PRO FORMA FREE CASH FLOW TO ($ in millions) Twelve Months Ended September 24, 2006 Estimated Total QUALCOMM Share-Based QUALCOMM Pro Forma Compensation QSI (GAAP) Net cash provided (used) by operating activities $ 3,746 $ (403) $ (90) $ 3,253 Capital expenditures (566) - (119) (685) Free cash flow (Net cash provided by operating activities less capital expenditures) $ 3,180 $ (403) $ (209) $ 2,568 Twelve Months Ended September 25, 2005 Total QUALCOMM QUALCOMM Pro Forma QSI (GAAP) Net cash provided (used) by operating activities $ 2,722 $ (36) $ 2,686 Capital expenditures (482) (94) $ (576) Free cash flow (Net cash provided by operating activities less capital expenditures) $ 2,240 $ (130) $ 2,110
26 Business Outlook Summary (as of November 2, 2006) FIRST FISCAL QUARTER QUALCOMM Pro Forma Q1'06 Results Current Guidance Q1'07 Estimates Revenues $1.74B $1.98B - $2.08B Year-over-year change increase 14% - 19% Diluted earnings per share (EPS) $0.39 $ $0.44 Year-over-year change increase 8% - 13% Total QUALCOMM (GAAP) Revenues $1.74B $1.98B - $2.08B Year-over-year change increase 14% - 19% Diluted earnings per share (EPS) $0.36 $ $0.37 Year-over-year change decrease 3% - increase 3% Diluted EPS attributable to QSI ($0.01) ($0.02) Diluted EPS attributable to estimated share-based compensation ($0.05) ($0.05) Diluted EPS attributable to tax items related to prior years $0.03 n/a Metrics MSM Shipments approx. 47M approx. 55M - 58M CDMA/WCDMA handset units shipped approx. 52M* approx. 74M - 76M* CDMA/WCDMA handset unit wholesale average selling price approx. $215* approx. $209* *Shipments in Sept. quarter, reported in Dec. quarter
27 Business Outlook Summary (as of November 2, 2006) FISCAL YEAR QUALCOMM Pro Forma Current Guidance FY 2006 FY 2007 Results Estimates (1) Revenues $7.53B $8.1B - $8.6B Year-over-year change increase 8% - 14% Diluted earnings per share (EPS) $1.64 $ $1.81 Year-over-year change increase 7% - 10% Total QUALCOMM (GAAP) Revenues $7.53B $8.1B - $8.6B Year-over-year change increase 8% - 14% Diluted earnings per share (EPS) $1.44 $ $1.50 Year-over-year change increase 1% - 4% Diluted EPS attributable to in-process R&D ($0.01) n/a Diluted EPS attributable to QSI ($0.02) ($0.11) Diluted EPS attributable to estimated share-based compensation ($0.19) ($0.20) Diluted EPS attributable to tax items related to prior years $0.02 n/a Metrics Fiscal year* CDMA/WCDMA handset unit wholesale average selling price approx. $215 approx. $205 *Shipments in Sept. to June quarters, reported in Dec. to Sept. quarters (1) Current FY 2007 estimates do not reflect the potential adverse impact on our results, approximately $0.04 to $0.06 diluted earnings per share, of Nokia not paying royalties in the fourth quarter of fiscal 2007 for June quarter shipments. Further details are included in the introductory paragraph which precedes this Business Outlook table. Sums may not equal totals due to rounding.
28 Pro Forma Reconciliations Fourth Quarter - Fiscal Year 2006 Segments QUALCOMM Pro Forma Estimated Share- Based Compensation (1) Tax Items (2) In-Process R&D (3) QSI (4) Total QUALCOMM (GAAP) Revenues $ 1,999 $ - $ - $ - $ - $ 1,999 Change from prior year 28% % EBT $ 961 $ (127) $ - $ (1) $ (23) $ 810 Change from prior year 18% N/M N/M N/M N/M 3% Net income (loss) $ 705 $ (76) $ (16) $ (1) $ 2 $ 614 Change from prior year 30% N/M N/M N/M N/M 14% Diluted EPS $ 0.42 $ (0.05) $ (0.01) $ - $ - $ 0.36 Change from prior year 31% N/M N/M N/M N/M 13% Diluted shares used 1,693 1,693 1,693 1,693 1,693 1,693 Third Quarter - Fiscal Year 2006 Segments QUALCOMM Pro Forma Estimated Share- Based Compensation (1) QSI (4) Total QUALCOMM (GAAP) Revenues $ 1,951 $ - $ - $ 1,951 EBT 976 (126) (26) 824 Net income (loss) 726 (83) Diluted EPS $ 0.42 $ (0.05) $ - $ 0.37 Diluted shares used 1,728 1,728 1,728 1,728 Fourth Quarter - Fiscal Year 2005 Total Segments QUALCOMM Pro Forma QSI (4) QUALCOMM (GAAP) Revenues $ 1,560 $ - $ 1,560 EBT 813 (27) 786 Net income (loss) 543 (5) 538 Diluted EPS $ 0.32 $ - $ 0.32 Diluted shares used 1,686 1,686 1,686
29 Pro Forma Reconciliations Continued First Quarter - Fiscal Year 2006 QUALCOMM Pro Estimated Share- Based Tax Total QUALCOMM Segments Forma Compensation (1) Adjustments (5) QSI (4) (GAAP) Revenues $ 1,741 $ - $ - $ - $ 1,741 EBT 906 (122) - (48) 736 Net income (loss) 667 (82) 56 (21) 620 Diluted EPS $ 0.39 $ (0.05) $ 0.03 $ (0.01) $ 0.36 Diluted shares used 1,702 1,702 1,702 1,702 1,702 Twelve Months - Fiscal Year 2006 Segments QUALCOMM Pro Forma Estimated Share- Based Compensation (1) Tax Items (2) (5) In-Process R&D (3) QSI Total QUALCOMM (GAAP) Revenues $ 7,526 $ - $ - $ - $ - $ 7,526 Change from prior year 33% % EBT $ 3,806 $ (495) $ - $ (22) $ (133) $ 3,156 Change from prior year 36% N/M - - N/M 12% Net income (loss) $ 2,804 $ (320) $ 40 $ (22) $ (32) $ 2,470 Change from prior year 42% N/M N/M N/M N/M 15% Diluted EPS $ 1.64 $ (0.19) $ 0.02 $ (0.01) $ (0.02) $ 1.44 Change from prior year 41% N/M N/M N/M N/M 14% Diluted shares used 1,711 1,711 1,711 1,711 1,711 1,711 Twelve Months - Fiscal Year 2005 Total QUALCOMM Pro Tax Adjustments QUALCOMM Segments Forma (6)(7) QSI (GAAP) Revenues $ 5,673 $ - $ - $ 5,673 EBT 2, ,809 Net income 1, ,143 Diluted EPS $ 1.16 $ 0.04 $ 0.06 $ 1.26 Diluted shares used 1,694 1,694 1,694 1,694
30 Footnotes to Pro Forma Reconciliations (1) During the first quarter of fiscal 2006, the Company adopted the fair value recognition provisions of FAS 123R using a modified prospective application. Under this method, prior periods are not revised for comparative purposes. Share-based compensation is included in operating expenses as part of employee-related costs but is not allocated to our segments as these estimated costs are not considered relevant by management in evaluating segment performance. (2) During the fourth quarter of fiscal 2006, the Company refined its estimate of R&D costs allocable to the Company s foreign operations to reflect our actual results and updated forecast of future benefits to the parties under an intercompany cost sharing agreement. Due to this adjustment, the effective tax rate in the fourth quarter of fiscal 2006 for total QUALCOMM (GAAP) includes $33 million of tax expense, or $0.02 per diluted share, related to fiscal In addition, the Company recorded a $17 million tax benefit, or $0.01 diluted earnings per share, related to the impact of prior year tax audits completed during the fourth quarter of fiscal For fiscal 2006 pro forma presentation, results have been adjusted to exclude these tax adjustments related to prior years. (3) During fiscal 2006, the Company recorded $22 million of expenses related to acquired in-process R&D associated with three acquisitions completed during the year. $21 million of this expense was recorded in the second quarter of fiscal 2006 and $1 million was recorded in the fourth quarter of fiscal For fiscal 2006 pro forma presentation, results have been adjusted to exclude these expenses as they are unrelated to the Company s ongoing core operating businesses and are also not allocated to our segments as these costs are not considered relevant by management in evaluating segment performance. (4) At fiscal year-end, the sum of the quarterly tax provisions for each column, including QSI, equals the annual tax provisions for each column computed in accordance with GAAP. In interim quarters, the tax provision for the QSI operating segment is computed by subtracting the tax provision for QUALCOMM pro forma, the tax adjustment column and the tax provision related to estimated share-based compensation from the tax provision for total QUALCOMM (GAAP). (5) During the first quarter of fiscal 2006, the Company recorded a $56 million tax benefit, or $0.03 diluted earnings per share, related to the expected impact of prior year tax audits completed during the quarter. For fiscal 2006 pro forma presentation, results have been adjusted to exclude this tax adjustment attributable to prior years. (6) During the second quarter of fiscal 2005, the Company decreased its estimate of R&D costs allocable to the Company s foreign operations under an intercompany cost sharing agreement. Due to this change in estimate, the effective tax rate in the second quarter for total QUALCOMM (GAAP) included a $55 million benefit, or $0.03 diluted earnings per share, related to fiscal For fiscal 2005 pro forma presentation, results have been adjusted to exclude this tax adjustment attributable to fiscal (7) During the third quarter of fiscal 2005, the Company made an election to compute its California tax on the basis of its U.S. operations only, which resulted in a $38 million tax benefit. Our effective tax rate in the third quarter of fiscal 2005 for total QUALCOMM (GAAP) includes a $16 million tax benefit, or $0.01 diluted earnings per share, for this California tax election related to fiscal For fiscal 2005 pro forma presentation, results have been adjusted to exclude the tax adjustment attributable to fiscal N/M Not Meaningful
31 Reconciliation of EBITDA to Net Income ($ in millions) FY2005 FY2006 Net Income $ 2,143 $ 2,470 Plus: Income tax expense Plus: Depreciation and Amortization Less: interest income,net (253) (412) EBITDA $ 2,756 $ 3,016 EBITDA is defined as (Earnings Before Interest, Taxes, Depreciation and Amortization)

32 Thank You!
Q2 FY06 Earnings April 19, 2006
 Safe Harbor Before we proceed with our presentation, we would like to point out that the following discussion will contain forward-looking statements from industry consultants, QUALCOMM, and others regarding
Q3 FY06 Earnings July 19, July 19, Q3 FY06 Earnings
 Safe Harbor Before we proceed with our presentation, we would like to point out that the following discussion will contain forward-looking statements from industry consultants, QUALCOMM, and others regarding
Q4 FY06 Earnings November 2, November 2, Q4 FY06 Earnings
 Safe Harbor Before we proceed with our presentation, we would like to point out that the following discussion will contain forward-looking statements from industry consultants, QUALCOMM, and others regarding
First Quarter Fiscal 2010 Earnings JANUARY 27, 2010
 First Quarter Fiscal 2010 Earnings JANUARY 27, 2010 1 Safe Harbor Before we proceed with our presentation, we would like to point out that the following discussion will contain forward-looking statements
New York Analyst Day. November 12, 2009
 New York Analyst Day November 12, 2009 1 Steve Altman President 2 Safe Harbor Before we proceed with our presentation, we would like to point out that the following discussion will contain forward-looking
QUALCOMM Reports Third Fiscal Quarter Revenues of $1 Billion - Operating Earnings Per Share of $.75, Excluding Non-Recurring Charges -
 FOR IMMEDIATE RELEASE QUALCOMM Contact: Julie Cunningham Vice President, Investor Relations 1-(858) 658-4224 (ph) 1-(858) 651-9303 (fax) e-mail: juliec@qualcomm.com QUALCOMM Reports Third Fiscal Quarter
T-Mobile US Q4 and Full Year 2013
 T-Mobile US Q4 and Full Year 2013 Disclaimer This presentation contains forward-looking statements within the meaning of the U.S. federal securities laws. For those statements, we claim the protection
Cincinnati Bell Third Quarter 2011 Results. November 3, 2011
 Cincinnati Bell Third Quarter 2011 Results November 3, 2011 Today s Agenda Performance Highlights Jack Cassidy, President & Chief Executive Officer Review of Wireline, Wireless, IT Services & Hardware
UBS 42 nd Annual Global Media and Communications Conference December 8, Leigh Fox, CFO
 UBS 42 nd Annual Global Media and Communications Conference December 8, 2014 Leigh Fox, CFO Safe Harbor This presentation and the documents incorporated by reference herein contain forward-looking statements
QUALCOMM Reports First Quarter Results Revenues $941 Million, $.65 EPS
 Contact: Julie Cunningham Vice President, Investor Relations Ph 619-658-4224 Fax 619-651-9303 E-mail: juliec@qualcomm.com QUALCOMM Reports First Quarter Results Revenues $941 Million, $.65 EPS SAN DIEGO
Conference Call Second Quarter 2003 Financial Results. Jorma Ollila Chairman and CEO
 Conference Call Second Quarter 2003 Financial Results Jorma Ollila Chairman and CEO Olli-Pekka Kallasvuo Executive Vice President and CFO Ulla James Vice President, Investor Relations July 17, 2003 15.00
Cincinnati Bell Inc. March 4, 2013
 Cincinnati Bell Inc. March 4, 2013 Safe Harbor This presentation and the documents incorporated by reference herein contain forwardlooking statements regarding future events and our future results that
Sony Ericsson continues to invest for future growth
 PRESS RELEASE April 23, 2008 Sony Ericsson continues to invest for future growth Q1 Highlights: Year-on-year volume growth of 2% Income before taxes at higher end of forecast R&D investment continues to
Lehman Brothers Worldwide Wireless & Wireline Conference. May 28, 2008
 Lehman Brothers Worldwide Wireless & Wireline Conference Sanjay Jha Chief Operating Officer and President, Qualcomm CDMA Technologies Group Safe Harbor Lehman Brothers Worldwide Before we proceed with
PRESS RELEASE October 17, 2008
 PRESS RELEASE October 17, 2008 Sony Ericsson reports third quarter results Q3 highlights: Break even results, excluding restructuring charges, as challenging business conditions continued C902 Cyber-shot
Nokia Conference Call Second Quarter 2005 Financial Results
 Nokia Conference Call Second Quarter 2005 Financial Results Jorma Ollila Chairman and CEO Rick Simonson Executive Vice President and CFO Ulla James Vice President, Investor Relations July 21, 2005 14.30
4 TH. 4Q13 Earnings Conference Call January 28, AT&T Investor Update
 4Q13 Earnings Conference Call January 28, 2014 AT&T Investor Update 4 TH 2014 AT&T Intellectual Property. All rights reserved. AT&T, the AT&T logo and all other marks contained herein are trademarks of
Spreadtrum Communications, Inc.
 Spreadtrum Communications, Inc. Technology for the Mobile World b 2012 Second Quarter Results China United States Korea India Taiwan www.spreadtrum.com 1 Safe Harbor Statement This presentation contains
Verizon closes 2017 with strong wireless customer growth and retention, well-positioned in new markets
 News Release FOR IMMEDIATE RELEASE January 23, 2018 Media contact: Bob Varettoni 908.559.6388 robert.a.varettoni@verizon.com Verizon closes 2017 with strong wireless customer growth and retention, well-positioned
Sony Ericsson sells over 100 million handsets in 2007
 PRESS RELEASE January 16, 2008 Sony Ericsson sells over 100 million handsets in 2007 Q4 Highlights: 2007 Highlights: 18% increase in volume year-on-year Continued market share gains and profitable growth
Tech Data s Acquisition of Avnet Technology Solutions
 Tech Data s Acquisition of Avnet Technology Solutions Creating a Premier Global IT Distributor: From the Data Center to the Living Room September 19, 2016 techdata.com 1 Forward-Looking Statements Safe
Conference call February 2, :00 / Helsinki 08:00 / New York 1 Nokia Q4 and FY 2016
 Conference call February 2, 2017 15:00 / Helsinki 08:00 / New York 1 Nokia 2016 Q4 and FY 2016 Disclaimer It should be noted that Nokia and its business are exposed to various risks and uncertainties,
FOURTH QUARTER AND FULL YEAR 25 JANUARY 2010
 FOURTH QUARTER AND FULL YEAR 25 JANUARY 21 HENRY STÉNSON SENIOR VICE PRESIDENT COMMUNICATIONS FOURTH QUARTER AND FULL YEAR This presentation contains forward looking statements. Such statements are based
Vodafone K.K. FY04 interim results Period ended 30 September 2004
 Vodafone K.K. FY04 interim results Period ended 30 September 2004 16 Nov 2004 Presented by: J. Brian Clark Representative Executive Officer, President & CEO John Durkin Representative Executive Officer,
UNITED STATES SECURITIES AND EXCHANGE COMMISSION WASHINGTON, DC FORM 8-K
 UNITED STATES SECURITIES AND EXCHANGE COMMISSION WASHINGTON, DC 20549 FORM 8-K CURRENT REPORT Pursuant to Section 13 or 15(d) of the Securities Exchange Act of 1934 Date of report (Date of earliest event
Sony Ericsson starts 2007 with strong first quarter
 PRESS RELEASE April 20, 2007 Sony Ericsson starts 2007 with strong first quarter Q1 Highlights: Year-on-year volume & sales growth of 63% and 47% respectively Income before tax rose 139% year-on-year to
Dr. Sanjay Jha. COO, Qualcomm President, Qualcomm CDMA Technologies. Lehman Brothers Global Technology Conference December 6, 2007
 Dr. Sanjay Jha COO, Qualcomm President, Qualcomm CDMA Technologies Lehman Brothers Global Technology Conference Safe Harbor Before we proceed with our presentation, we would like to point out that the
CenturyLink. 1 st Quarter 2012 Earnings Conference Call May 9, 2012
 CenturyLink 1 st Quarter 2012 Earnings Conference Call May 9, 2012 Forward-Looking Statements / Non-GAAP Financial Measures Certain non-historical statements made in this presentation and future oral or
Wi-Fi Perfected. Second Quarter 2017 Earnings Presentation August 7, Proprietary Software. Cloud Analytics. Semiconductors
 Wi-Fi Perfected Semiconductors Proprietary Software Cloud Analytics Second Quarter 2017 Earnings Presentation August 7, 2017 Safe Harbor and Non-GAAP Financial Measures This presentation contains forward-looking
INVESTOR RELATIONS 28 January Zayo Reporting Update Call
 INVESTOR RELATIONS 28 January 2016 Zayo Reporting Update Call ZAYO GROUP SAFE HARBOR Information contained in this presentation that is not historical by nature constitutes forward-looking statements which
Nokia Corporation January 24, 2013 at 13:00 (CET +1)
") INTERIM REPORT 1(57) Nokia Corporation Q4 and full year 2012 Interim Report FINANCIAL AND OPERATING HIGHLIGHTS Fourth quarter 2012 highlights: Nokia Group non-ifrs EPS in Q4 2012 was EUR 0.06; reported
INTERIM REPORT 1(57) Nokia Corporation Q4 and full year 2012 Interim Report FINANCIAL AND OPERATING HIGHLIGHTS Fourth quarter 2012 highlights: Nokia Group non-ifrs EPS in Q4 2012 was EUR 0.06; reported
Conference call August 4, :00 / Helsinki 08:00 / New York 1 Nokia 2016 Q2 2016
 Conference call August 4, 2016 15:00 / Helsinki 08:00 / New York 1 Nokia 2016 Q2 2016 Disclaimer It should be noted that Nokia and its business are exposed to various risks and uncertainties, and certain
Consolidated Financial Results for the Second Quarter, Fiscal 2018
 Consolidated Financial Results for the Second Quarter, Fiscal 2018 Ⅰ. Consolidated Financial Results for the First Half, Fiscal 2018 Consolidated Financial Results for Fiscal 2018 Ⅱ. Supplementary Data
Slide title 48 pt 21 july 2011 Slide subtitle 30 pt
 21 july 211 Helena norrman SENIOR VICE PRESIDENT COMMUNICATIONS THIS PRESENTATION CONTAINS FORWARD-LOOKING STATEMENTS. SUCH STATEMENTS ARE BASED ON OUR CURRENT EXPECTATIONS AND ARE SUBJECT TO CERTAIN RISKS
2017 Q4 Earnings Conference Call
 2017 Q4 Earnings Conference Call Forward Looking Statements This presentation includes certain forward-looking statements that are made as of the date hereof and are based upon current expectations, which
Symantec's Fiscal Second Quarter Supplemental Information
 Symantec's Fiscal Second Supplemental Information SUMMARY (in thousands) Revenue and Earnings Results Sep-05Q Jun-05Q Sep-04Q Y/Y Growth Q/Q Growth Non-GAAP Revenue (including writedown)* $1,192,144 $1,259,200
Verizon builds on 2Q momentum with strong 3Q results
 News Release FOR IMMEDIATE RELEASE October 19, 2017 Media contact: Bob Varettoni 908.559.6388 robert.a.varettoni@verizon.com Verizon builds on 2Q momentum with strong 3Q results 3Q 2017 highlights 89 cents
Earnings Results for the Three-month Period Ended June 30, 2012
 Earnings Results for the Three-month Period Ended June 30, 2012 July 31, 2012 SOFTBANK CORP. Disclaimer This material was prepared based on information available and views held at the time it was made.
PRESS RELEASE January 16, 2009 Sony Ericsson reports results for fourth quarter and full year 2008
 PRESS RELEASE January 16, 2009 Sony Ericsson reports results for fourth quarter and full year 2008 Highlights: Global economic slowdown leads to contracting consumer demand Previously announced annual
Cincinnati Bell Second Quarter 2012 Results. August 8, 2012
 Cincinnati Bell Second Quarter 2012 Results August 8, 2012 Today s Agenda Performance Highlights Jack Cassidy, President & Chief Executive Officer Review of Cincinnati Bell Communications Ted Torbeck,
Nokia Conference Call First Quarter 2010 Financial Results
 Nokia Conference Call First Quarter 2010 Financial Results April 22, 2010 15.00 Helsinki time 8.00 New York time Olli-Pekka Kallasvuo CEO Timo Ihamuotila CFO Kristian Pullola Head of Treasury and Investor
2nd Quarter 2017 Earnings Results
 2nd Quarter 2017 Earnings Results August 2, 2017 Forward-Looking Statements Except for historical and factual information, the matters set forth in this presentation and other of our oral or written statements
eaccess Ltd. (9427) FY3/2012 First Half Results (4/2011 ~ 9/2011) November 4, 2011
 FY3/2012 First Half Results (4/2011 ~ 9/2011) November 4, 2011") eaccess Ltd. (9427) FY3/2012 First Half Results (4/2011 ~ 9/2011) November 4, 2011 FY3/2012 1H Results & Financials Strategy LTE 900MHz 2 FY3/2012 1H Results & Financials 3 Mobile subscribers reached about
eaccess Ltd. (9427) FY3/2012 First Half Results (4/2011 ~ 9/2011) November 4, 2011 FY3/2012 1H Results & Financials Strategy LTE 900MHz 2 FY3/2012 1H Results & Financials 3 Mobile subscribers reached about
B. Riley & Co. Annual Investor Conference. May 25, 2017
 B. Riley & Co. Annual Investor Conference May 25, 2017 Forward Looking Statement and Financial Presentation This presentation contains forward-looking statements within the meaning of Section 27A of the
Olli-Pekka Kallasvuo President & CEO Rick Simonson Executive Vice President & CFO. Bill Seymour Head of Investor Relations
 Conference Call Second Quarter 2007 Financial Results August 2, 2007 15.00 Helsinki time 8.00 New York time Olli-Pekka Kallasvuo President & CEO Rick Simonson Executive Vice President & CFO Bill Seymour
Conference call July 26, :00 / Helsinki 08:00 / New York 1 Nokia 2016 Q2 2018
 Conference call July 26, 2018 15:00 / Helsinki 08:00 / New York 1 Nokia 2016 Q2 2018 Disclaimer It should be noted that Nokia and its business are exposed to various risks and uncertainties, and certain
Conference call October 26, :00 / Helsinki 08:00 / New York 1 Nokia 2016 Q3 2017
 Conference call October 26, 2017 15:00 / Helsinki 08:00 / New York 1 Nokia 2016 Q3 2017 Disclaimer It should be noted that Nokia and its business are exposed to various risks and uncertainties, and certain
F-Secure Corporation Interim report 2Q July 29th, 2008 Kimmo Alkio, President and CEO
 F-Secure Corporation Interim report 2Q 2008 July 29th, 2008 Kimmo Alkio, President and CEO Q2 Highlights Solid revenue growth of 16% to 27.2m Good profitability of 4.7m, 17% of revenues Portfolio expansion:
Conference call April 26, :00 / Helsinki 08:00 / New York 1 Nokia 2016 Q1 2018
 Conference call April 26, 2018 15:00 / Helsinki 08:00 / New York 1 Nokia 2016 Q1 2018 Disclaimer It should be noted that Nokia and its business are exposed to various risks and uncertainties, and certain
CYRUSONE TO ACQUIRE ZENIUM DATA CENTERS
 CYRUSONE TO ACQUIRE ZENIUM DATA CENTERS THIRD QUARTER 2017 EARNINGS October 31, 2017 DECEMBER 21, 2017 SAFE HARBOR S A F E H A R B O R This presentation contains forward-looking statements regarding future
Q Earnings Conference Call. August 7, 2018
 Q2 2018 Earnings Conference Call August 7, 2018 Safe Harbor Statement This presentation includes forward-looking statements within the meaning of Section 27A of the Securities Act and Section 21E of the
4Q 2015 Earnings Conference Call. February 26, 2016
 4Q 2015 Earnings Conference Call February 26, 2016 Safe Harbor Statement This presentation includes forward-looking statements within the meaning of Section 27A of the Securities Act and Section 21E of
London Investor Day. November 13, 2006
 London Investor Day November 13, 2006 Safe Harbor Before we proceed with our presentation, we would like to point out that the following discussion will contain forward-looking statements from industry
Financial Results for the Fiscal Year Ended March 2014
 Financial Results for the Fiscal Year Ended March 2014 April 30, 2014 KDDI Corporation President Takashi Tanaka Today s Presentation 1 1. Financial Results for FY2014.3 2. Forecasts for FY2015.3 3. Targeting
Q Earnings Conference Call. November 6, 2018
 Q3 2018 Earnings Conference Call November 6, 2018 Safe Harbor Statement This presentation includes forward-looking statements within the meaning of Section 27A of the Securities Act and Section 21E of
Sony Ericsson reports second quarter 2010 results
 PRESS RELEASE July 16, 2010 Sony Ericsson reports second quarter 2010 results Q2 Highlights: Income before taxes excl. restructuring charges increases to Euro 63 million Positive cash flow generated from
Nokia Conference Call Second Quarter 2010 Financial Results
 Nokia Conference Call Second Quarter 2010 Financial Results July 22, 2010 15.00 Helsinki time 8.00 New York time Olli-Pekka Kallasvuo CEO Timo Ihamuotila CFO Kristian Pullola Head of Treasury and Investor
Nokia Conference Call Fourth Quarter 2010 and Full Year 2010 Financial Results
 Nokia Conference Call Fourth Quarter 2010 and Full Year 2010 Financial Results January 27, 2011 15.00 Helsinki time 8.00 New York time Stephen Elop President and CEO Timo Ihamuotila CFO Matt Shimao Head
Opera Software. Third quarter The best Internet experience on any device
 Opera Software Third quarter 2007 The best Internet experience on any device OPERA SOFTWARE ASA THIRD QUARTER 2007 Opera delivered revenues of MNOK 81.8 in 3Q07, up 54% versus 3Q06, and a positive EBIT
CFO Commentary on Second Quarter 2016 Financial Results
 CFO Commentary on Second Quarter 2016 Financial Results August 2, 2016 Related Information The commentary in this document can be referenced in the financial information found in the earnings release issued
Cincinnati Bell. Morgan Stanley Technology, Media, and Telecommunications Conference February 28, 2012
 Cincinnati Bell Morgan Stanley Technology, Media, and Telecommunications Conference February 28, 2012 Safe Harbor This presentation and the documents incorporated by reference herein contain forwardlooking
hird Q uarter R eport
 hird Quarter Report Safe Harbor Statement This presentation contains forward looking statements. Such statements are based on our current expectations and are subject to certain risks and uncertainties
the 3-month period ended Jun.30,2011 July 28,
 Financial Highlights the 3-month period ended Jun.30,2011 (Fiscal 2011) July 28, 2011 http://www.hitachi-metals.co.jp E-Mail:hmir@hitachi-metals.co.jpco Performance Overview First Quarter of Fiscal 2011
Agenda Business Overview Operating Results Financial Results
 1 Agenda 2001 Business Overview 2001 Operating Results 2001 Financial Results 2 2001 Business Overview Satisfactory Operating Performance New Businesses Taking-off Increasingly Efficient Operations Promising
Financial Results for the Three Months Ended June 30, August 7, 2018
 Financial Results for the Three Months Ended June 30, 2018 August 7, 2018 Copyright 2018 NIPPON TELEGRAPH AND TELEPHONE CORPORATION 1 This document is a translation of the Japanese original. The Japanese
Windstream acquisition of Broadview Networks Transaction overview April 13, 2017
 Windstream acquisition of Broadview Networks Transaction overview April 13, 2017 Safe Harbor Statement Windstream Holdings, Inc. claim the protection of the safe-harbor for forward-looking statements contained
Interoute Acquisition Summary. February 26, 2018
 Interoute Acquisition Summary February 26, 2018 Disclaimer Forward-Looking Statements: This presentation contains forward-looking statements which are made pursuant to the safe harbor provisions of Section
Lenovo Group Limited. 2007/08 Q1 Results. August 2, Lenovo
 Lenovo Group Limited 2007/08 Q1 Results August 2, 2007 2007 Lenovo Wong Wai Ming Senior Vice President & Chief Financial Officer 2007 Lenovo Lenovo Financial Summary Q1 2007/08 US$mn % Y/Y Q/Q Turnover
Vonage Digital Phone Service 2010 Annual Report
 Vonage Digital Phone Service 2010 Annual Report 1 Our Mission Contents 2010 was a year of accomplishment. The dramatic improvement in our performance is a direct result of the focused efforts of our dedicated
A complete travel commerce experience EXPEDIA, INC.
 A complete travel commerce experience Forward-Looking Statements This presentation contains forward-looking statements within the meaning of the Private Securities Litigation Reform Act of 1995, including
Opera Software. First quarter The best Internet experience on any device
 Opera Software First quarter 2008 The best Internet experience on any device OPERA SOFTWARE ASA FIRST QUARTER 2008 Opera delivered revenues of MNOK 102.7 in 1Q08, up 57% versus 1Q07, and an EBIT of MNOK
econd Quarter Report
 econd Quarter Report econd Quarter Report HENRY STÉNSON Senior Vice President Communications Safe Harbor Statement This presentation contains forward looking statements. Such statements are based on our
Vodafone Analyst & Investor Day Monday 27 September 2004
 Vodafone Analyst & Investor Day Monday 27 September 2004 Verizon Wireless Andy Halford Chief Financial Officer 1 Safe Harbor Statement NOTE: This presentation contains statements about expected future
China Wireless Investor Presentation
 Charles Zhang China Wireless Investor Presentation October 2009 Innovative wireless telecom company Building on core technologies For growing with the PRC market Safe Harbor Statement Important Notice
Barclay s 2009 Worldwide Wireless and Wireline Conference
 Barclay s 2009 Worldwide Wireless and Wireline Conference MAY 28, 2009 Steve Mollenkopf Executive Vice President, & President, Qualcomm CDMA Technologies Safe Harbor Before we proceed with our presentation,
Capital Markets Day Rick Simonson Chief Financial Officer
 Capital Markets Day 2007 Rick Simonson Chief Financial Officer 1 2007 Nokia Capital Markets Day 2007 Revenue growth and strong margins 2 2007 Nokia Capital Markets Day 2007 EPS growth outpacing sales and
First Quarter 2018 Earnings Presentation. May 8, 2018
 First Quarter 2018 Earnings Presentation May 8, 2018 1 Safe Harbor Caution Concerning Forward-Looking Statements Various remarks that the Company makes contain forward-looking statements regarding acquisitions,
Creating America s Premier Communications Company. December 15, 2004
 Creating America s Premier Communications Company December 15 2004 & ' ' + ' / / 5 - < < < < AAAA :::: HHHH > > > > ;;;; = = = = < < < < GC GC GC GC :::: >? >? >? >? >= >= >= >= < < < < ;;;;???? DDDD C=
Fourth Quarter and Full Year 2018 Earnings Presentation. February 21, 2019
 Fourth Quarter and Full Year 2018 Earnings Presentation February 21, 2019 1 Safe Harbor Caution Concerning Forward-Looking Statements Various remarks that the Company makes contain forward-looking statements
New York Analyst Day. November 13, 2008
 New York Analyst Day November 13, 2008 Safe Harbor Before we proceed with our presentation, we would like to point out that the following discussion will contain forward-looking statements from industry
Investor Presentation. June 2018
 Investor Presentation June 2018 Safe Harbor Statement Safe Harbor Statement Windstream Holdings, Inc. claims the protection of the safe-harbor for forward-looking statements contained in the Private Securities
Trend Micro Reports Record First Quarter Revenue & Operating Profit
 Trend Micro Reports Record First Quarter Revenue & Operating Profit Continued strong growth in U.S and Asia highlight quarter Tokyo, Japan April 25, 2006 Trend Micro, Incorporated (TSE: 4704, NASDAQ: TMIC),
AT&T Investor Update. 4Q08 Earnings Conference Call January 28, 2009
 AT&T Investor Update 4Q08 Earnings Conference Call January 28, 2009 2009 AT&T Intellectual Property. All rights reserved. AT&T, the AT&T logo and all other marks contained herein are trademarks of AT&T
RESEARCH IN MOTION REPORTS SECOND QUARTER RESULTS
 September 30, FOR IMMEDIATE RELEASE RESEARCH IN MOTION REPORTS SECOND QUARTER RESULTS Waterloo, Ontario Research In Motion Limited (RIM) (Nasdaq: RIMM; TSX: RIM), a world leader in the mobile communications
(408) (408) NETAPP ANNOUNCES RESULTS FOR SECOND QUARTER FISCAL YEAR 2013
 (408) NETAPP ANNOUNCES RESULTS FOR SECOND QUARTER FISCAL YEAR 2013") Press Contact: Investor Contact: Ryan Lowry Kris Newton NetApp NetApp (408) 822-7544 (408) 822-3312 ryanl@netapp.com kris.newton@netapp.com NETAPP ANNOUNCES RESULTS FOR SECOND QUARTER FISCAL YEAR 2013
Press Contact: Investor Contact: Ryan Lowry Kris Newton NetApp NetApp (408) 822-7544 (408) 822-3312 ryanl@netapp.com kris.newton@netapp.com NETAPP ANNOUNCES RESULTS FOR SECOND QUARTER FISCAL YEAR 2013
F-Secure Corporation Interim report Q4 2012
 F-Secure Corporation Interim report Q4 2012 (Unaudited) President & CEO Christian Fredrikson February 1, 2013 Protecting the irreplaceable f-secure.com Contents 1. Highlights in Q4 and in 2012 2. Financial
T-MOBILE USA CONTINUES TO INVEST IN NETWORK QUALITY AND REPORTS SECOND QUARTER 2008 RESULTS
 T-MOBILE USA CONTINUES TO INVEST IN NETWORK QUALITY AND REPORTS SECOND QUARTER RESULTS $1.58 billion Operating Income Before Depreciation and Amortization ( OIBDA ) in the second quarter of, up 14% from
Forward Looking Statement
 Forward Looking Statement This presentation contains forward-looking statements which are statements that refer to expectations and plans for the future and include, without limitation, statements regarding
Cincinnati Bell 3rd Quarter 2010 Review. November 3, 2010
 Cincinnati Bell 3rd Quarter 2010 Review November 3, 2010 Agenda 1. Performance Highlights Jack Cassidy, President & CEO 2. Operational Review of Wireline and Wireless Ted Torbeck, President of Cincinnati
THIRD QUARTER October
 THIRD QUARTER 2010 October 20 2010 AGENDA About Q3 2010 Financial review Guidance and Concluding remarks 2 2010-10-20 Third quarter 2010 HIGHLIGHTS Q3 Group Total customer base amounting to more than 30
Fourth Quarter 2012 Financial Summary. Quarter Ended
 Reports Fourth Quarter Financial Results Successful Execution of Challenger Strategy Leads to Improved Customer Development and Reduced Churn BELLEVUE, Wash. February 28, 2013, Inc. ( T-Mobile ) today
F-Secure Corporation Interim report 3Q October 21, 2008 Kimmo Alkio, President and CEO
 F-Secure Corporation Interim report 3Q 2008 October 21, 2008 Kimmo Alkio, President and CEO Q3 Highlights Solid revenue growth of 18% to 28.6m All-time high profitability of 7.1m, 25% of revenues Cash
ThirdQuarter Report 2004
 ThirdQuarter Report 2004 Safe Harbor Statement This presentation contains forward looking statements. Such statements are based on our current expectations and are subject to certain risks and uncertainties
SECOND QUARTER REPORT 2007
 SECOND QUARTER REPORT 2007 SECOND QUARTER REPORT HENRY STÉNSON Senior Vice President Communications 2007 Safe Harbor Statement This presentation contains forward looking statements. Such statements are
FIRST QUARTER REPORT
 FIRST QUARTER REPORT 2007 FIRST QUARTER REPORT HENRY STÉNSON Senior Vice President Communications 2007 Safe Harbor Statement This presentation contains forward looking statements. Such statements are based
Red Hat Acquisition of Qumranet Adds next generation virtualization capabilities. September 4, 2008
 Red Hat Acquisition of Qumranet Adds next generation virtualization capabilities September 4, 2008 Safe Harbor Forward-Looking Statements Certain statements contained or discussed in this presentation
KeyBanc Industrial, Automotive and Transportation Conference
 KeyBanc Industrial, Automotive and Transportation Conference Dave Adams, President and CEO 1 May 2014 2014 Curtiss-Wright Safe Harbor Statement Please note that the information provided in this presentation
F-Secure Corporation - Interim report Q2 2011
 F-Secure Corporation - Interim report Q2 2011 (Unaudited) July 27, 2011 Kimmo Alkio, President & CEO Protecting the irreplaceable f-secure.com Q2 highlights Operator channel performed strongly showing
MD&A. Growing Subscribers with Slightly Decreasing ARPU CONTENTS
 MANAGEMENT DISCUSSION AND ANALYSIS F Y 2011 MD&A CONTENTS I EXECUTIVE SUMMARY 2011 was a significant year for dtac as we began our entire network upgrade and our 3G HSPA on 850 MHz launch which was our
Annual Meeting of Stockholders. May 22, 2018
 Annual Meeting of Stockholders May 22, 2018 Safe Harbor Language This presentation contains certain statements that are "forward-looking statements" within the meaning of the Private Securities Litigation