REPUBLIC OF RWANDA RWANDA UTILITIES REGULATORY AGENCY
|
|
|
- Buck Fleming
- 6 years ago
- Views:
Transcription

1 REPUBLIC OF RWANDA RWANDA UTILITIES REGULATORY AGENCY STATISTICS AND TARIFF INFORMATION IN TELECOM SECTOR AS OF DECEMBER 2012
2 CONTENTS 1. MOBILE AND FIXED TELEPHONE SERVICE SUBSCRIPTIONS, MARKET SHARE AND COVERAGE MOBILE TELEPHONE TARIFF STRUCTURE FIXED TELEPHONE NETWORK TRAFFIC STATISTICS... 9 A. INTERNET SUBSCRIBERS B. BROADBAND INTERNET MARKET SHARE C. INTERNATIONAL INTERNET BANDWIDTH EMPLOYMENT IN TELECOMMUNICATION SECTOR AS OF DECEMBER LIST OF TABLES Table 1: Number of mobile and fixed telephone service subscribers per operator... 4 Table 2: Mobile telephone network coverage as of December 2012 per type of coverage and per operator as of December Table 3: International roaming subscribers as of December Table 4. Outgoing and Incoming traffic for the 3rd and 4th Quarter 2012 (in 000 s )... 9 Table 5: SMS traffic per operator as of December Table 6. Licensed internet service providers as of December Table7. Internet subscribers per category per operator as of December Table 8. International internet bandwidth (Mbps) per operator as of December Table 9: Number of staffs employed in Telecommunication sectors as of December Page 2 of 17
3 LIST OF FIGURES Figure 1: Development of mobile telephone Subscribers and its percentage increase as of December Figure 2: Evolution of postpaid and prepaid mobile subscriptions market share per operator as of December Figure 3: Evolution of mobile telephones market share per operator Figure 4.Mobile telephone voice tariff structures, per operator as of December Figure 5:Fixed telephone Market by operators as of December Figure 6:Outgoing voice traffic market share per operator and per type of call as of December Figure 7:Incoming voice traffic market share per operator and per type of call as of December Figure 8:Internet penetration rate trend Figure 9: Evolution of fixed broadband market share for the last two quarters Figure 10: Mobile normal Internet tariff (Rwf/Mb) as of December Figure 11: Fixed Internet tariffs per operator as of December 2012 (In Rwf VAT Inclusive) Figure 12: Number of People employed in Telecommunication Sector as of December 2012 (by gender) Page 3 of 17
4 1. MOBILE AND FIXED TELEPHONE SERVICE As of December 2012, the major players in mobile telephony included MTN Rwandacell, TIGO Rwanda Ltd and AIRTEL Rwanda Ltd the new entrant in Telecommunication market. Table 1: Number of mobile and fixed telephone service subscribers per operator Operators Active subscribers Fixed Teledensit y Mobile Teledens ity General teledensity Mobile Active subscribers Fixed Telephony MTN Rwanda 3,432,755 12, % 53.1% 53.5% TIGO Rwanda 1,866,924 AIRTEL 391,072 RWANDA RWANDATEL - 31,733 Total 5,690,751 44,363 The above table indicates that mobile penetration rate reached 53.1% as of December 2012 against 48.1% on September 2012 representing 5% increase. Page 4 of 17


5 1.1. SUBSCRIPTIONS, MARKET SHARE AND COVERAGE Figure 1: Development of mobile telephone Subscribers and its percentage increase as of December 2012 Figure 2: Evolution of postpaid and prepaid mobile subscriptions market share per operator as of December 2012 Page 5 of 17


6 Figure 3: Evolution of mobile telephones market share per operator. Page 6 of 17
7 MTN Rwanda is still leading in terms of mobile subscribers with 60 % of the market share followed by Tigo which has 33%, Airtel Rwanda the new entrant in the telecom sector has the lowest market share of 7%. The coverage for each network is depicted in the table below: Table 2: Mobile telephone network coverage as of December 2012 per type of coverage and per operator as of December 2012 Geographical coverage Population coverage MTN Rwanda 98.18% 98.42% TIGO 79% 99% Airtel Rwanda 6% 15% Table 3: International roaming subscribers as of December rd Quarter th Quarter 2012 Incoming outgoing Incoming outgoing MTN 760, , ,913 70,309 TIGO 15,772 49,841 92,883 33,246 AIRTEL 29, ,740 75, MOBILE TELEPHONE TARIFF STRUCTURE In general, the tariffs for mobile telephone calls remained stable for the period under review as described below ; Figure 4.Mobile telephone voice tariff structures, per operator as of December Page 7 of 17


8 The above figure indicate the following: Airtel Rwanda has the lowest Onnet tariff of 20 Rwf per minute, Tigo charges 25Rwf and MTN charges 45Rwf per minute. MTN Ltd, Tigo Ltd, and Airtel charge the same rates on the calls made to East African countries. Page 8 of 17
 Total outgoing and Incoming mobile calls(in minutes) Table 4.")

9 1.3. FIXED TELEPHONE NETWORK Rwandatel is the active fixed line voice service provider. Below is the tariff structure for fixed line telephone as of December Figure 5:Fixed telephone Market by operators as of December TRAFFIC STATISTICS a) Total outgoing and Incoming mobile calls(in minutes) Table 4. Outgoing and Incoming traffic for the 3rd and 4th Quarter 2012 (in 000 s ) 3 rd Quarter th Quarter 2012 OUTGOING MINUTES MTN Rwanda TIGO Rwanda AIRTEL MTN Rwanda TIGO Rwanda Airtel On Net 665,638, ,923,740 5,365, ,619, ,247,939 35,888,174 Off Net 9,696,295 7,005,604 2,969,517 9,795,054 6,101,305 7,969,433 International 29,298,198 2,938, ,800 28,258,014 2,468,840 2,730,233 INCOMING MINUTES Off Net 10,805,249 9,711, ,959 15,195,994 10,013,677 1,269,966 International 30,178,137 2,182, ,134 27,760,977 1,033,546 1,137,899 Page 9 of 17


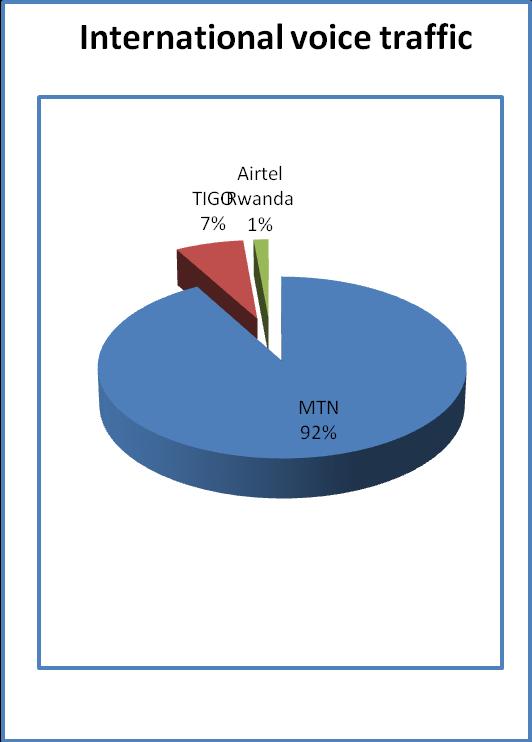
10 Figure 6:Outgoing voice traffic market share per operator and per type of call as of December 2012 Figure 7:Incoming voice traffic market share per operator and per type of call as of December 2012 Page 10 of 17
11 Table 5: SMS traffic per operator as of December 2012 SMS TRAFFIC 3 rd Quarter th Quarter 2012 Outgoing MTN TIGO AIRTEL MTN TIGO AIRTEL Onnet 71,406,890 90,061,680 2,360, ,755,750 90,061,680 1,034,558 Offnet 1,619,582 1,166, ,955 1,893,502 1,166, ,099 International ,012 32, , , ,664 Incoming Offnet 1,273,740 1,468, , ,396 1,468, ,266 International 300,342 92, ,681 92, , INTERNET SERVICE PROVISION There are ten (10) licensed Internet Service Providers in the country including National telecommunication service operators (fixed and mobile). The table below is a list of all the operators providing Internet Services (ISPs) as well as the internet penetration trend since Table 6. Licensed internet service providers as of December 2012 ISPs LICENSED FROM(Year) STATUS MTN Rwandacell S.A.R.L 2006 Operational RWANDATEL S.A 2008 Operational TIGO Rwanda S.A 2008 Operational New Artel 2004 Operational ISPA 2006 Operational Altech Stream 2007 Operational 4G NETWORKS 2009 Operational BSC 2010 Operational 4G Rwanda 2011 Not yet Operational AIRTEL Rwanda 2011 Operational Page 11 of 17
12 Figure 8:Internet penetration rate trend A. INTERNET SUBSCRIBERS The table below illustrates the breakdown of internet subscribers per category and per operator: Table7. Internet subscribers per category per operator as of December 2012 Fixed internet Mobile internet Mobile internet Total Narrowband( 256kbps) Broadband( 256kbps) RWANDATEL ,628 MTN ,980 TIGO ,735 New Artel ISPA Altech stream G Networks BSC ,033 Airtel Rwanda ,994 1,187 2, , ,964 Page 12 of 17

 per operator as of December 2012 Type MTN RWANDATEL NEW ARTEL ALTECH STREAM TIGO ISPA")
13 B. BROADBAND INTERNET MARKET SHARE The figures below compare broadband market shares in terms of subscribers for the last two quarters: Figure 9: Evolution of fixed broadband market share for the last two quarters 2012 C. INTERNATIONAL INTERNET BANDWIDTH Table 8. International internet bandwidth (Mbps) per operator as of December 2012 Type MTN RWANDATEL NEW ARTEL ALTECH STREAM TIGO ISPA BSC 4G Network AIRTEL Up link Downlink Page 13 of 17
 Altech Stream Rwanda Limited Connection speeds(download/upload) Pricing (per month)")
14 1.6. INTERNET TARIFF A. MOBILE INTERNET TARIFF Figure 10: Mobile normal Internet tariff (Rwf/Mb) as of December 2012 B. FIXED INTERNET TARIFF Figure 11: Fixed Internet tariffs per operator as of December 2012 (In Rwf VAT Inclusive) Altech Stream Rwanda Limited Connection speeds(download/upload) Pricing (per month) Residential Class 128/64Kbps Rwf 67, /128kbps Rwf 135,000 Business Class 128/64Kbps Rwf 135, /128kbps Rwf 280,000 1mbs Rwf 600,000 Installation fees Residential Clients Rwf 50,000 Business class Corporate clients Rwf 75,000 RWANDATEL Wireless 128/64 Kbps Residential 649, /64 Kbps Business 649, /126 Kbps 236, /192 Kbps 354, /256Kbps 743,400 Page 14 of 17
15 1Mbps 1,534,000 Fiber 64 Kbps 50, Kbps 100, Kbps 141,600 1Mbps 354,000 2Mbps 590,000 3Mbps 826,000 4Mbps 1,062,000 5Mbps 1,298,000 6Mbps 1,534,000 7Mbps 1,770,000 8Mbps 2,006,000 9Mbps 2,242,000 10Mbps 2,478,000 Copper 64 Kbps Data Copper-Kigali 101, Kbps Data Copper-Up country 185, kbps Data Copper-Kigali 147, kbps Data Copper-Up country 268, kbps-DATA(Copper-kigali) 213, kbps-DATA(copper -Up country) 415, kbps DATA(Cooper) 296, kbps DATA(Cooper) 479, kbps DATA(Cooper) 544,079 EVDO 35,000 ISPA 128Kbps-64Kbps 59, Kps-128Kbps 118,000 BSC VPN ( Unit price per 3 Mbps) 180,000/Mbps Fiber Internet connection (Unit Price per Mbps) 270,000 /Mbps WiBro Services Unit price CPE Device 85,000 EGG Device 72,000 USB Device 20,000 USB monthly subscription 20,000 Monthly fee EGG and CPE 30,000 Collocation services Unit Price 150,000 Web and Mail Hosting services Page 15 of 17
16 PLAN A 150,000 PLAN B 250,000 PLAN C 600,000 PLAN D 1,000,000 PLAN E 1,500,000 PLAN F 2,000,000 Virtual Hosting Services Set up fee 50,000 Bronze 125,000 Silver 168,000 Gold 225,000 Plantinum 360,000 NEW ARTEL(Mbps) 128/128Kbps 65, /256 Kbps 131, /512 Kbps 262,205 1 Mbps Kbps 524,410 4G NETWORKS 256kbps Wireless 35, kbps Wireless 53,543 1 Mb Wireless 88, EMPLOYMENT IN TELECOMMUNICATION SECTOR AS OF DECEMBER people are employed in Telecommunication sector, 783 are permanent staffs and 45 staffs are temporary staffs. Of these staff 17% are women and 83% are men as it is shown in the following figure. Table 9: Number of staffs employed in Telecommunication sectors as of December 2012 Staffs Female 169 Permanent 761 Temporary Staff 58 Total 826 Page 16 of 17

17 Figure 12: Number of People employed in Telecommunication Sector as of December 2012 (by gender) Page 17 of 17
STATISTICS AND TARIFF INFORMATION IN TELECOM SECTOR AS OF SEPTEMBER 2013
 STATISTICS AND TARIFF INFORMATION IN TELECOM SECTOR AS OF SEPTEMBER 2013 Prepared by: Economic and Market Analysis Section CONTENTS I. preliminary remarks... 4 II. summary... 4 1. MOBILE AND FIXED TELEPHONE
STATISTICS AND TARIFF INFORMATION IN TELECOM SECTOR AS OF DECEMBER 2013
 STATISTICS AND TARIFF INFORMATION IN TELECOM SECTOR AS OF DECEMBER 2013 Prepared by: Economic and Market Analysis Section CONTENTS I. preliminary remarks... 5 II. summary... 5 1. MOBILE AND FIXED TELEPHONE
REPUBLIC OF RWANDA RWANDA UTILITIES REGULATORY AGENCY
 REPUBLIC OF RWANDA RWANDA UTILITIES REGULATORY AGENCY STATISTICS AND TARIFF INFORMATION IN TELECOM SECTOR AS OF SEPTEMBER 2012 CONTENTS 1. MOBILE AND FIXED TELEPHONE SERVICE... 3 1.1. SUBSCRIPTIONS, MARKET
REPUBLIC OF RWANDA RWANDA UTILITIES REGULATORY AGENCY
 REPUBLIC OF RWANDA RWANDA UTILITIES REGULATORY AGENCY STATISTICS AND TARIFF INFORMATION IN TELECOM SECTOR AS OF DECEMBER 2011 CONTENTS 1. MOBILE AND FIXED TELEPHONE SERVICE... 3 1.1. SUBSCRIPTIONS, MARKET
STATISTICS AND TARIFF INFORMATION IN TELECOM, MEDIA AND POSTAL SERVICE AS OF THE FOURTH QUARTER 2016
 STATISTICS AND TARIFF INFORMATION IN TELECOM, MEDIA AND POSTAL SERVICE AS OF THE FOURTH QUARTER 2016 2016 TABLE OF CONTENTS 1. PRELIMINARY REMARKS... 5 2. SUMMARY... 5 3. MOBILE AND FIXED TELEPHONE SUBSCRIPTIONS...
STATISTICS AND TARIFF INFORMATION IN TELECOM, MEDIA AND POSTAL SERVICE AS OF THE THIRD QUARTER 2017
 STATISTICS AND TARIFF INFORMATION IN TELECOM, MEDIA AND POSTAL SERVICE AS OF THE THIRD QUARTER 2017 Information provided in this report is subject to alteration in case of any revisions or updates deemed
STATISTICS AND TARIFF INFORMATION IN TELECOM, MEDIA AND POSTAL SERVICE AS OF THE SECOND QUARTER 2018
 STATISTICS AND TARIFF INFORMATION IN TELECOM, MEDIA AND POSTAL SERVICE AS OF THE SECOND QUARTER 2018 Information provided in this report is subject to alteration in case of any revisions or updates deemed
How to establish an ICT Indicator database in Indonesia 29 October 2 November 2007 Jakarta, Indonesia ITU Telecommunication/ICT Indicators
 How to establish an ICT database in Indonesia 29 October 2 November 2007 Jakarta, Indonesia ITU Telecommunication/ICT s Esperanza C. Magpantay Market Information and Statistics Division Bureau for Telecommunication
List of indicators included in the World Telecommunication/ICT Indicators database, December 2017
 List of indicators included in the World Telecommunication/ICT Indicators database, December 2017 Economy, Demography Average annual exchange rate per USD Households Percentage of the population in urban
INDUSTRY INFORMATION - TELECOM SUBSCRIPTIONS FOR FEBRUARY 2016
 INDUSTRY INFORMATION - TELECOM SUBSCRIPTIONS FOR FEBRUARY 2016 National Communications Authority FEBRUARY 29, 2016 1 P age Contents 1. Introduction... 4 2. Mobile Voice Subscription Trends For February
THE FRENCH TELECOMMUNICATIONS SERVICES MARKET 4 th QUARTER 2002 (Licensed operators) June 2003
 June 2003") THE FRENCH TELECOMMUNICATIONS SERVICES MARKET 4 th QUARTER (Licensed operators) June 2003 2 Introduction Fixed telephony The fixed telephony sector continued to decline in. However carrier selection subscriptions
THE FRENCH TELECOMMUNICATIONS SERVICES MARKET 4 th QUARTER (Licensed operators) June 2003 2 Introduction Fixed telephony The fixed telephony sector continued to decline in. However carrier selection subscriptions
Telecommunications market data tables Q1 2016
 Telecommunications market data tables Q1 2016 1 Market monitor 2 Fixed telecoms market data tables 3 Mobile telecoms market data tables Published: 11 August 2016-1 - 1. Market monitor In the following
POSTAL AND TELECOMMUNICATIONS REGULATORY AUTHORITY OF ZIMBABWE (POTRAZ)
") POSTAL AND TELECOMMUNICATIONS REGULATORY AUTHORITY OF ZIMBABWE (POTRAZ) ABRIDGED POSTAL & TELECOMMUNICATIONS SECTOR PERFORMANCE REPORT FOURTH QUARTER 2016 Disclaimer: This report has been prepared based
POSTAL AND TELECOMMUNICATIONS REGULATORY AUTHORITY OF ZIMBABWE (POTRAZ) ABRIDGED POSTAL & TELECOMMUNICATIONS SECTOR PERFORMANCE REPORT FOURTH QUARTER 2016 Disclaimer: This report has been prepared based
RWANDA UTILITIES REGULATORY AGENCY B.P 7289 Kigali, Rwanda (+250) / Tol free: 3988
 / Tol free: 3988") What is Mobile Internet? Mobile internet is a way of getting online when you re on the move via portable devices such as mobile phones, tablets and personal computers. These allow you to do everything
What is Mobile Internet? Mobile internet is a way of getting online when you re on the move via portable devices such as mobile phones, tablets and personal computers. These allow you to do everything
THE TELECOMMUNICATIONS SECTOR EVOLUTION AT 30 th SEPTEMBER 2012
 THE TELECOMMUNICATIONS SECTOR EVOLUTION AT 30 th SEPTEMBER 2012 1- Highlights at 30 th September 2012 Evolution of Tariffs (ARPM 1 ), average usage 2 of fixed and mobile telephony and the average monthly
Telecommunications market data tables Q2 2015
 Telecommunications market data tables Q2 2015 1 Market monitor 2 Fixed telecoms market data tables 3 Mobile telecoms market data tables Published: 12 November 2015-1 - 1. Market monitor In the following
Telecommunications Market Report January June 2009
 Office of Utility Regulation Telecommunications Market Report January June 2009 Information Note Document No: OUR 10/03 March 2010 Office of Utility Regulation Suites B1 & B2, Hirzel Court, St Peter Port,
INDUSTRY INFORMATION - TELECOM SUBSCRIPTIONS FOR JULY National Communications Authority
 INDUSTRY INFORMATION - TELECOM SUBSCRIPTIONS FOR JULY 2017 National Communications Authority SEPTEMBER 29, 2017 1 P a g e Table of Contents 1. Introduction... 4 2. Mobile Voice Subscription for July 2017...
QUARTERLY STATISTICAL BULLETIN ON COMMUNICATIONS IN GHANA
 QUARTERLY STATISTICAL BULLETIN ON COMMUNICATIONS IN GHANA Volume 2 Issue 1 NATIONAL COMMUNICATIONS AUTHORITY FIRST QUARTER JANUARY - MARCH, 2017 Communications for Development QUARTERLY STATISTICAL BULLETIN
THE TELECOMMUNICATIONS SECTOR EVOLUTION AT 31 st MARCH 2011
 THE TELECOMMUNICATIONS SECTOR EVOLUTION AT 31 st MARCH 2011 Mobile Telephony Market 1 At the end of the first quarter of 2011, the number of mobile subscribers reached 33 375 498, with a quarterly growth
AN OVERVIEW OF THE ELECTRONIC COMMUNICATIONS MARKET IN THE REPUBLIC OF SERBIA. The Fourth Quarter of 2017
 AN OVERVIEW OF THE ELECTRONIC COMMUNICATIONS MARKET IN THE REPUBLIC OF SERBIA The Fourth Quarter of 2017 The Overview presents the data for the fourth quarter of 2017 along with comparative data for other
QUARTERLY TELECOM STATISTICS
 QUARTERLY TELECOM STATISTICS Quarter 4 (June 212) Report 1. Voice Prepaid Tariffs (Without TAX) 1.1 Weighted Prepaid Tariffs per Operators (Tshs) Jan March 212 On Net Calls 15 15 15 98 3 3 Off Net calls
ANALYSIS OF THE TELECOMMUNICATIONS SECTOR EVOLUTION AT 30 th SEPTEMBER 2011
 ANALYSIS OF THE TELECOMMUNICATIONS SECTOR EVOLUTION AT 30 th SEPTEMBER 2011 1- Highlights at 30 th September 2011 Evolution of Tariffs (ARPM 1 ), average usage 2 of fixed and mobile telephony and the average
MOBILE SERVICES TEXT/DATA NETWORK
 TELEPHONE NETWORK i112 Main telephone lines in operation 1) 1,970 2,098 2,334 2,504 2,440 2,641 i117 Total capacity of local public switching exchanges 3,800 2,632 2,632 2632 2,824 2,824 i1142 % of main
THE TELECOMMUNICATIONS SECTOR EVOLUTION AT 30 th JUNE 2008
 THE TELECOMMUNICATIONS SECTOR EVOLUTION AT 30 th JUNE 2008 Mobile Telephony Market At the end of the second quarter of 2008, the number of mobile subscribers reached 21 411 705, with a growth of 3,86%.
AN OVERVIEW OF THE ELECTRONIC COMMUNICATIONS MARKET IN THE REPUBLIC OF SERBIA
 AN OVERVIEW OF THE ELECTRONIC COMMUNICATIONS MARKET IN THE REPUBLIC OF SERBIA The First Quarter of 2018 The Overview presents the data for the first quarter of 2018 along with comparative data for the
1.1a & b: National Tariffs. Fig.1.1a: On Net National Tariffs. Fig.1.1b: Off Net National Tariffs. 1.1c & d: International Tariffs
 QUARTERLY TELECOM STATISTICS Quarter 3 (March 2013) Report 1. Voice Prepaid Tariffs (Without TAX) 1.1 Weighted Prepaid Tariffs per Operators (Tshs) VodaCom Oct-Dec 2012 On Net Calls 110 62 86 75 90 30
Telecommunications market data tables Q1 2013
 Telecommunications market data tables Q1 2013 1 Market monitor 2 Fixed telecoms market data tables 3 Mobile telecoms market data tables Published: 22 August 2013-1 - 1. Market monitor We have made restatements
INTERNET MARKET IN MOROCCO
 INTERNET MARKET IN MOROCCO Quarterly Observatory* -December 2012- This document is to be considered for information purposes only. Summary Introduction 3 I II Recall of various types of Internet access
ITU Telecommunication/ICT Indicators Tariffs and Traffic
 ITU Telecommunication/ICT Indicators Tariffs and Traffic 30 October 2007 Monika Muylkens Market Information and Statistics (STAT)/Policy and Strategies (POL) Bureau for Telecommunication
Average Revenue per User (ARPU) measures the average monthly revenue generated per customer Average Usage per User (AUPU) measures the average
 measures the average monthly revenue generated per customer Average Usage per User (AUPU) measures the average") Introduction Key Definitions Key Market Trends & Observations Economic Indicators for the BVI Main Telecoms Indicators Total Revenue in the Telecoms Sector Total Mobile Communications Investment Employment
Introduction Key Definitions Key Market Trends & Observations Economic Indicators for the BVI Main Telecoms Indicators Total Revenue in the Telecoms Sector Total Mobile Communications Investment Employment
TELECOMMUNICATIONS CONSUMPTION TREND AND SERVICE BUNDLING
 TELECOMMUNICATIONS CONSUMPTION TREND AND SERVICE BUNDLING Ghana s Experience International Telecommunications Union (ITU) ICT indicators symposium Gaborone, Botswana, November 21-23, 2016 Victor Teppeh
AN OVERVIEW OF THE ELECTRONIC COMMUNICATIONS MARKET IN THE REPUBLIC OF SERBIA
 AN OVERVIEW OF THE ELECTRONIC COMMUNICATIONS MARKET IN THE REPUBLIC OF SERBIA The Second Quarter of 2017 The Overview presents the data for the second quarter of 2017 along with comparative data for the
POSTAL AND TELECOMMUNICATIONS REGULATORY AUTHORITY OF ZIMBABWE (POTRAZ)
") POSTAL AND TELECOMMUNICATIONS REGULATORY AUTHORITY OF ZIMBABWE (POTRAZ) POSTAL AND TELECOMMUNICATIONS SECTOR PERFORMANCE REPORT FOURTH QUARTER 2015 Disclaimer: This report has been prepared based on data
POSTAL AND TELECOMMUNICATIONS REGULATORY AUTHORITY OF ZIMBABWE (POTRAZ) POSTAL AND TELECOMMUNICATIONS SECTOR PERFORMANCE REPORT FOURTH QUARTER 2015 Disclaimer: This report has been prepared based on data
S K Gupta Advisor, TRAI
 S K Gupta Advisor, TRAI 1 Agenda Agenda Telecom Growth pattern Indian Internet & Broadband Demography Need of rural sector Issues with Rural Broadband Way Forward 2 Telecom Growth 600 500 400 300 200 Jun-05
POSTAL AND TELECOMMUNICATIONS REGULATORY AUTHORITY OF ZIMBABWE (POTRAZ)
") POSTAL AND TELECOMMUNICATIONS REGULATORY AUTHORITY OF ZIMBABWE (POTRAZ) POSTAL AND TELECOMMUNICATIONS PERFORMANCE REPORT SECTOR THIRD QUARTER Disclaimer: This report has been prepared based on data provided
POSTAL AND TELECOMMUNICATIONS REGULATORY AUTHORITY OF ZIMBABWE (POTRAZ) POSTAL AND TELECOMMUNICATIONS PERFORMANCE REPORT SECTOR THIRD QUARTER Disclaimer: This report has been prepared based on data provided
8 th World Telecommunication/ICT Indicators Meeting (WTIM-10) Geneva, Switzerland, November 2010
 Geneva, Switzerland, November 2010") 8 th World Telecommunication/ICT Indicators Meeting (WTIM-10) Geneva, Switzerland, 24-26 vember 2010 Contribution to WTIM-10 session 4 Document C/22-E 25 vember 2010 English SOURCE: TITLE: National IT-
8 th World Telecommunication/ICT Indicators Meeting (WTIM-10) Geneva, Switzerland, 24-26 vember 2010 Contribution to WTIM-10 session 4 Document C/22-E 25 vember 2010 English SOURCE: TITLE: National IT-
AN OVERVIEW OF THE TELECOM MARKET IN THE REPUBLIC OF SERBIA
 AN OVERVIEW OF THE TELECOM MARKET IN THE REPUBLIC OF SERBIA The Fourth Quarter of 2016 The Overview presents the data for all four quarters of 2016. The presented data reflect the overall market status
ITU World Telecommunication/ICT Indicators Long Questionnaire 2014
 ITU World Telecommunication/ICT Indicators Long naire 2014 SAMPLE QUESTIONNAIRE All numerical data must be entered WITHOUT any punctuation, i.e. no apostrophes, commas, spaces, etc. All financial data
International gateway liberalization
 International gateway liberalization WSIS Facilitation Meeting on Action Line C6 ITU Headquarters, Geneva, 20 Infrastructure sharing: extending ICT access to all Vaiva Lazauskaite vaiva.lazauskaite@itu.int
Economic and Social Indicators. Information and Communication Technologies (ICT) statistics
 statistics") Economic and Social Indicators Information and Communication Technologies (ICT) statistics - 2016 1. Introduction This is the eleventh issue of the Economic and Social Indicators on Information and Communication
Economic and Social Indicators Information and Communication Technologies (ICT) statistics - 2016 1. Introduction This is the eleventh issue of the Economic and Social Indicators on Information and Communication
TABLE OF CONTENTS. Broadband Key Indicators and Sector Findings. Preface. Subscriber Television Revenue. ICT Development Index Investment
 1 PREFACE 2 The Eastern Caribbean Telecommunications Authority (ECTEL) produces a review of the electronic communications sector annually. This report provides information on the performance and economic
ITU Multi-Countries Workshop for National Focal Points on ICT Indicators and Measurements
 ITU Multi-Countries Workshop for National Focal Points on ICT Indicators and Measurements Nay Pyi Taw, Myanmar 15-18 March 2016 Telecommunication/ICT indicators from administrative data sources Esperanza
Telecommunications Market Information Report October December 2017
 Telecommunications Market Information Report October December 2017 3rd Floor, PCJ Resource Centre 36 Trafalgar Road Kingston 10 Jamaica Phone: 876-968-6053-4 / Fax: 876-929-3635 website: www.our.org.jm
POSTAL AND TELECOMMUNICATIONS REGULATORY AUTHORITY OF ZIMBABWE (POTRAZ) ABRIDGED POSTAL & TELECOMMUNICATION SECTOR PERFORMANCE REPORT
 ABRIDGED POSTAL & TELECOMMUNICATION SECTOR PERFORMANCE REPORT") POSTAL AND TELECOMMUNICATIONS REGULATORY AUTHORITY OF ZIMBABWE (POTRAZ) ABRIDGED POSTAL & TELECOMMUNICATION SECTOR PERFORMANCE REPORT SECOND QUARTER 2018 Disclaimer: This report has been prepared based
POSTAL AND TELECOMMUNICATIONS REGULATORY AUTHORITY OF ZIMBABWE (POTRAZ) ABRIDGED POSTAL & TELECOMMUNICATION SECTOR PERFORMANCE REPORT SECOND QUARTER 2018 Disclaimer: This report has been prepared based
POSTAL AND TELECOMMUNICATIONS REGULATORY AUTHORITY OF ZIMBABWE (POTRAZ)
") POSTAL AND TELECOMMUNICATIONS REGULATORY AUTHORITY OF ZIMBABWE (POTRAZ) POSTAL & TELECOMMUNICATIONS SECTOR PERFORMANCE REPORT THIRD QUARTER 2016 Disclaimer: This report has been prepared based on data
POSTAL AND TELECOMMUNICATIONS REGULATORY AUTHORITY OF ZIMBABWE (POTRAZ) POSTAL & TELECOMMUNICATIONS SECTOR PERFORMANCE REPORT THIRD QUARTER 2016 Disclaimer: This report has been prepared based on data
Telecommunications Market Information Report October - December 2015
 Telecommunications Market Information Report October - December 2015 Telecommunications Market Information Report: October - December 2015 3rd Floor, PCJ Resource Centre 36 Trafalgar Road Kingston 10 Jamaica
ANALYSIS OF THE TELECOMMUNICATIONS SECTOR EVOLUTION AT 30 th JUNE 2011
 ANALYSIS OF THE TELECOMMUNICATIONS SECTOR EVOLUTION AT 30 th JUNE 2011 1- Highlights at 30 June 2011 Evolution of Tariffs (ARPM 1 ), average usage 2 of fixed and mobile telephony and the average monthly
CONSUMER IS NOT OBLIGED TO PAY IF THE NOTICE OF PAYMENT HAS NOT BEEN RECEIVED (RECEIPT-INVOICE)
") 1 CONSUMER IS NOT OBLIGED TO PAY IF THE NOTICE OF PAYMENT HAS NOT BEEN RECEIVED (RECEIPT-INVOICE) The final pricelist charges are calculated with a) the Tax of Fixed Telephony Subscribers, in accordance
1 CONSUMER IS NOT OBLIGED TO PAY IF THE NOTICE OF PAYMENT HAS NOT BEEN RECEIVED (RECEIPT-INVOICE) The final pricelist charges are calculated with a) the Tax of Fixed Telephony Subscribers, in accordance
ICT developments in Morocco
 ICT developments in Morocco Atelier de travail pour la mise en oeuvre d un Observatoire National des Technologies de l Information et de la Communications (ONTIC) 15 Rabat, Morocco Vanessa Gray Market
However, due to differing seasonal patterns, the telecommunications sector tends to account for the
 ( of However, due to differing seasonal patterns, the telecommunications sector tends to account for the fared better than the overall economy, and therefore the share of telecommunications in real GDP
ITU Asia-Pacific ICT Indicators Workshop. Session 7.2: Quality of service, traffic, revenue, investment, employment and Pay TV indicators
 ITU Asia-Pacific ICT Indicators Workshop Manila, Philippines 14-16 March 2018 Session 7.2: Quality of service, traffic, revenue, investment, employment and Pay TV indicators ICT Data and Statistics Division
Quarterly Market Indicators Q2 2017
 Quarterly Market Indicators Disclaimer Page 3 Mobile services Page 4 Fixed line telephony services Page 6 CONTENT Broadband services Definitions Page 8 Page 10 Disclaimer TRA has relied on information
Quarterly Market Indicators Q1 2018
 Quarterly Market Indicators Q1 2018 1 Content Disclaimer Page 3 Mobile services Page 4 Fixed line telephony services Page 6 Broadband services Page 8 Definitions Page 10 2 Disclaimer TRA has relied on
Financial Results Presentation Q1 FY15: Quarter ended 30 June August 2014 Chua Sock Koong Group CEO
 Financial Results Presentation Q1 FY15: Quarter ended 30 June 2014 14 August 2014 Chua Sock Koong Group CEO 1 Forward looking statement important note The following presentation contains forward looking
POSTAL AND TELECOMMUNICATIONS REGULATORY AUTHORITY OF ZIMBABWE (POTRAZ)
") POSTAL AND TELECOMMUNICATIONS REGULATORY AUTHORITY OF ZIMBABWE (POTRAZ) ABRIDGED POSTAL & TELECOMMUNICATIONS SECTOR PERFORMANCE REPORT THIRD QUARTER 2017 Disclaimer: This report has been prepared based
POSTAL AND TELECOMMUNICATIONS REGULATORY AUTHORITY OF ZIMBABWE (POTRAZ) ABRIDGED POSTAL & TELECOMMUNICATIONS SECTOR PERFORMANCE REPORT THIRD QUARTER 2017 Disclaimer: This report has been prepared based
BoR (11) 08. BEREC Report on Alternative Voice and SMS Retail Roaming Tariffs and Retail Data Roaming Tariffs
 08. BEREC Report on Alternative Voice and SMS Retail Roaming Tariffs and Retail Data Roaming Tariffs") BEREC Report on Alternative Voice and SMS Retail Roaming Tariffs and Retail Data Roaming Tariffs February 2011 1. Overview This BEREC Report on Alternative Retail Voice and SMS Roaming Tariffs and Retail
BEREC Report on Alternative Voice and SMS Retail Roaming Tariffs and Retail Data Roaming Tariffs February 2011 1. Overview This BEREC Report on Alternative Retail Voice and SMS Roaming Tariffs and Retail
Digital Agenda Scoreboard 2017 Electronic communications market indicators: Definitions, methodology and footnotes on Member State data
 Digital Agenda Scoreboard 2017 Electronic communications market indicators: Definitions, methodology and footnotes on Member State data Financial indicators, fixed and mobile telephony, broadcasting and
Paraguay - Telecoms, Mobile and Broadband - Statistics and Analyses
 Paraguay - Telecoms, Mobile and Broadband - Statistics and Analyses #1683031 $750 32 pages In Stock Report Description Paraguay s regulator completes 700MHz auction The state-owned incumbent, Corporación
Vanuatu Regulatory Statistical Framework An Overview ITU Asia-Pacific ICT Indicator Workshop, Manilla Philippine 2018
 Vanuatu Regulatory Statistical Framework An Overview ITU Asia-Pacific ICT Indicator Workshop, Manilla Philippine 2018 The Government of The Republic of Vanuatu Overview of Presentation Vanuatu a geopolitical
Quarterly Market indicators. Data at the end of Q4 2013
 Quarterly Market indicators Data at the end of Q4 2013 2014 Contents Disclaimer Page 3 Mobile services Page 4 Broadband services Page 5 Fixed telephony services Page 7 Definitions Page 8 2 Disclaimer TRA
Portugal - Telecoms, Mobile, Broadband and Digital Media - Statistics and Analyses
 Published on Market Research Reports Inc. (https://www.marketresearchreports.com) Home > Portugal - Telecoms, Mobile, Broadband and Digital Media - Statistics and Analyses Portugal - Telecoms, Mobile,
Telecommunications markets indicators in the Kingdom of Bahrain. September 2013
 Telecommunications markets indicators in the Kingdom of Bahrain September 2013 2013 Contents Page Introduction 3 Disclaimer 4 Key market trends and observations in 2012 5 TRA highlights during Q1, Q2 2013
Communications Market Review. July to December 2012
 Communications Market Review Document No: MCA/R/13-1548 Date: 11 April 2013 Table of Contents 1. Reporting parameters... 4 2. Key market outcomes... 6 2.1. The performance of electronic communications
MOBILE PRICE BASKETS (DECEMBER 2007 v1.1)
") MOBILE PRICE BASKETS (DECEMBER 2007 v1.1) Background Three kinds of price indicators: T-Baskets, OECD (http://www.teligen.com/t_basket.asp) OECD-based and OECD-authorized; takes pricing information from
MOBILE PRICE BASKETS (DECEMBER 2007 v1.1) Background Three kinds of price indicators: T-Baskets, OECD (http://www.teligen.com/t_basket.asp) OECD-based and OECD-authorized; takes pricing information from
Independent Communications Authority of South Africa
 Independent Communications Authority of South Africa 3 rd Report on the state of the ICT sector in South Africa 31 st March 2018 ICASA s report on the state of ICT sector in SA - i - March 18 TABLE OF
Operator characteristics
 RÉPUBLIQUE FRANÇAISE July 2013 Key figures for electronic communications and postal markets in France Figures for 2012 Operator characteristics Unless otherwise stated, the figures in this document are
9 th World Telecommunication/ICT Indicators Meeting (WTIM-11) Mauritius, 7-9 December 2011
 Mauritius, 7-9 December 2011") 9 th World Telecommunication/ICT Indicators Meeting (WTIM-11) Mauritius, 7-9 December 2011 Information document Document INF/6-E 30 November 2011 English SOURCE: Ministry of Communications and Information
9 th World Telecommunication/ICT Indicators Meeting (WTIM-11) Mauritius, 7-9 December 2011 Information document Document INF/6-E 30 November 2011 English SOURCE: Ministry of Communications and Information
POSTAL AND TELECOMMUNICATIONS REGULATORY AUTHORITY OF ZIMBABWE (POTRAZ)
") POSTAL AND TELECOMMUNICATIONS REGULATORY AUTHORITY OF ZIMBABWE (POTRAZ) ABRIDGED POSTAL & TELECOMMUNICATIONS SECTOR PERFORMANCE REPORT SECOND QUARTER 2017 Disclaimer: This report has been prepared based
POSTAL AND TELECOMMUNICATIONS REGULATORY AUTHORITY OF ZIMBABWE (POTRAZ) ABRIDGED POSTAL & TELECOMMUNICATIONS SECTOR PERFORMANCE REPORT SECOND QUARTER 2017 Disclaimer: This report has been prepared based
POSTAL AND TELECOMMUNICATIONS REGULATORY AUTHORITY OF ZIMBABWE (POTRAZ)
") POSTAL AND TELECOMMUNICATIONS REGULATORY AUTHORITY OF ZIMBABWE (POTRAZ) ABRIDGED POSTAL & TELECOMMUNICATIONS SECTOR PERFORMANCE REPORT FIRST QUARTER 2017 Disclaimer: This report has been prepared based
POSTAL AND TELECOMMUNICATIONS REGULATORY AUTHORITY OF ZIMBABWE (POTRAZ) ABRIDGED POSTAL & TELECOMMUNICATIONS SECTOR PERFORMANCE REPORT FIRST QUARTER 2017 Disclaimer: This report has been prepared based
MARKET OBSERVATORY : THE TELECOMMUNICATIONS SERVICES MARKET IN FRANCE AT THE FOURTH QUARTER 2004 (declared operators) May 2005
 May 2005") : THE TELECOMMUNICATIONS SERVICES MARKET IN FRANCE AT THE FOURTH QUARTER 20 (declared operators) May 25 2 Introduction At the fourth quarter 20, the electronic communications market in France represented
: THE TELECOMMUNICATIONS SERVICES MARKET IN FRANCE AT THE FOURTH QUARTER 20 (declared operators) May 25 2 Introduction At the fourth quarter 20, the electronic communications market in France represented
COMMUNICATIONS OUTLOOK 2001
 COMMUNICATIONS OUTLOOK 2001 Country: SPAIN Date completed: 23-6-2000 1 TELECOMMUNICATIONS Market Structure and Regulatory Status (Questions 1-10) 1. Please provide details of the regulation of communication
ITU World Telecommunication/ICT Indicators Long Questionnaire 2016
 ITU World Telecommunication/ICT Indicators Long Questionnaire 2016 SAMPLE QUESTIONNAIRE Please complete the Answer and Notes columns in the table below. Black cells must NOT be completed. Please do NOT
DSTI/ICCP/TISP(2000)6. COMMUNICATIONS OUTLOOK 2001 Telecommunications
6. COMMUNICATIONS OUTLOOK 2001 Telecommunications") COMMUNICATIONS OUTLOOK 2001 Telecommunications Country: Denmark Date completed: 17.08.2000 TELECOMMUNICATIONS Market Structure and Regulatory Status (Questions 1-10) 1. Please provide details of the regulation
COMMUNICATIONS OUTLOOK 2001 Telecommunications Country: Denmark Date completed: 17.08.2000 TELECOMMUNICATIONS Market Structure and Regulatory Status (Questions 1-10) 1. Please provide details of the regulation
- statistical data report -
 ccă Romanian Electronic Communications Market - statistical data report - (updated based upon the statistical data corresponding to 1 July 31 December 2016 reporting period) ANCOM/Regulation Executive
ITU SURVEY ON TARIFF POLICIES 2014
 INTERNATIONAL TELECOMMUNICATION UNION Telecommunication Development Bureau ITU SURVEY ON TARIFF POLICIES 2014 Instructions It is recommend to use the online version of this survey available on the ITU
MOBILE SERVICES STATISTICAL INFORMATION 2ND QUARTER 2017
 MOBILE SERVICES STATISTICAL INFORMATION 2ND QUARTER 2017 1st version - 02/08/2017 Index SUMMARY... 4 1. Mobile service penetration rate... 6 2. Mobile Service / active user devices... 7 3. Distribution
POSTAL AND TELECOMMUNICATIONS REGULATORY AUTHORITY OF ZIMBABWE (POTRAZ)
") POSTAL AND TELECOMMUNICATIONS REGULATORY AUTHORITY OF ZIMBABWE (POTRAZ) ABRIDGED POSTAL & TELECOMMUNICATIONS SECTOR PERFORMANCE REPORT FOURTH QUARTER 2018 Disclaimer: This report has been prepared based
POSTAL AND TELECOMMUNICATIONS REGULATORY AUTHORITY OF ZIMBABWE (POTRAZ) ABRIDGED POSTAL & TELECOMMUNICATIONS SECTOR PERFORMANCE REPORT FOURTH QUARTER 2018 Disclaimer: This report has been prepared based
POSTAL AND TELECOMMUNICATIONS REGULATORY AUTHORITY OF ZIMBABWE (POTRAZ)
") POSTAL AND TELECOMMUNICATIONS REGULATORY AUTHORITY OF ZIMBABWE (POTRAZ) ABRIDGED POSTAL & TELECOMMUNICATIONS SECTOR PERFORMANCE REPORT FOURTH QUARTER 2017 Disclaimer: This report has been prepared based
POSTAL AND TELECOMMUNICATIONS REGULATORY AUTHORITY OF ZIMBABWE (POTRAZ) ABRIDGED POSTAL & TELECOMMUNICATIONS SECTOR PERFORMANCE REPORT FOURTH QUARTER 2017 Disclaimer: This report has been prepared based
MOBILE TARIFFS ANALYSIS 1 APRIL TO 30 SEPTEMBER 2018
 MOBILE TARIFFS ANALYSIS 1 APRIL TO PREPARED BY ECONOMIC REGULATION 1 TABLE OF CONENT PAGE NUMBER 1. INTRODUCTION... 6 2. ANALYSIS OF STANDARD PREPAID VOICE TARIFF. 6 2.1 Comparison of Standard Voice Tariff
INTRODUCTION...3 OVERALL INTERNET USAGE...3 PRICING...7 CONCLUSION...10
 Annual Review of Internet Usage 24 INTRODUCTION...3 OVERALL INTERNET USAGE...3 Internet Penetration...4 Broadband...5 Mobile Internet Access...7 PRICING...7 Dial-up...8 Pay-as-you-go...8 Pre-paid Internet
CDMA2000 Expanding the M2M Market
 Norman Lindsey Senior Principal Expert Huawei Technologies (USA) March 2011 www.huawei.com CDMA2000 Expanding the M2M Market HUAWEI TECHNOLOGIES CO., LTD. Key Attributes for a Successful M2M Platform Key
ITU price data collection rules October 2018
 ITU price data collection rules October 2018 A. Rules applied in collecting mobile-cellular prices 1. The prices of the operator with the largest market share (measured by the number of subscriptions)
Electronic communications in France: key figures
 RÉPUBLIQUE FRANÇAISE June 211 Electronic communications in France: key figures Figures for 21 Operator characteristics Unless otherwise stated, the figures in this document are for 21. GENERAL MARKET DATA
Disentangling the broadband divide in Rwanda: supply-side vs demand-side
 Disentangling the broadband divide in Rwanda: supply-side vs demand-side Rwanda is ranked ninth out of 38 African countries in terms of mobile broadband affordability It performs better than leading African
Quarterly Market Indicators Q2 2016
 Quarterly Market Indicators Disclaimer Page 3 Mobile services Broadband services Page 4 Page 5 CONTENT Fixed telephony services Page 7 Definitions Page 8 Disclaimer TRA does not make any representations
Telecommunications Statistics and Market Report Information Note. Channel Islands Competition & Regulatory Authorities
 Telecommunications Statistics and Market Report 2017 Information Note Channel Islands Competition & Regulatory Authorities Document no: 18/24 11 June 2018 Competition and Regulatory Authority Suite 4,
COMPLIANCE RETURN FORM APPLICATION SERVICE PROVIDER
 COMPLIANCE RETURN FORM APPLICATION SERVICE PROVIDER PURSUANT TO THE PROVISIONS OF THE KICA 1998 AND THE KICA AMENDMENT ACT, 2013, AND THE KENYA INFORMATION AND COMMUNICATIONS REGULATIONS AND THE LICENSE
Table 1: Operators Authorized to Provide Public Fixed Domestic Telecommunications Services as at 2010
 2. Fixed Telephony Market Data As at December 2010, there were eight (8) operators authorized to provide fixed domestic telecommunications services to the public over wired or wireless facilities. These
BoR (10) 13. BEREC report on Alternative Retail Voice and SMS Roaming Tariffs and Retail Data Roaming Tariffs
 13. BEREC report on Alternative Retail Voice and SMS Roaming Tariffs and Retail Data Roaming Tariffs") BEREC report on Alternative Retail Voice and SMS Roaming Tariffs and Retail Data Roaming Tariffs March 2010 1. Background Regulation 544/2009 of 18 June 2009 on international roaming 1 requires all operators
BEREC report on Alternative Retail Voice and SMS Roaming Tariffs and Retail Data Roaming Tariffs March 2010 1. Background Regulation 544/2009 of 18 June 2009 on international roaming 1 requires all operators
COMMUNICATIONS OUTLOOK Country: NORWAY Date completed:
 COMMUNICATIONS OUTLOOK 2001 Country: NORWAY Date completed: 15.06.2000 TELECOMMUNICATIONS - REGULATORY ISSUES Market Structure and Regulatory Status (Questions 1-10) 1. Please provide details of the regulation
Public Mobile Telecommunications Networks and Services Tariff Number B32-01
 unlimitedgeneral Tariff Information Service Provider Name Ooredoo Q.S.C. (Formerly Qtel Q.S.C.) License Public Mobile Telecommunications Networks and Services Tariff Number B32-01 Service Name Postpaid
Digital Agenda Scoreboard 2013 Electronic communications market indicators: Definitions, methodology and footnotes on Member State data
 Digital Agenda Scoreboard 2013 Electronic communications market indicators: Definitions, methodology and footnotes on Member State data Broadband indicators Definitions Broadband connection: a connection
RTR Telecom Monitor. Annual Review 2011 BEREC CHAIR 2012 AUSTRIA
 RTR Telecom Monitor Annual Review 211 BEREC CHAIR 212 AUSTRIA Table of contents Preface 5 Section 1 Fixed network 7 Fixed lines and penetration 8 Development of fixed lines 9 Preselected lines and call-by-call
POSTAL AND TELECOMMUNICATIONS REGULATORY AUTHORITY OF ZIMBABWE (POTRAZ)
") POSTAL AND TELECOMMUNICATIONS REGULATORY AUTHORITY OF ZIMBABWE (POTRAZ) ABRIDGED POSTAL AND TELECOMMUNICATIONS SECTOR PERFORMANCE REPORT SECOND QUARTER 2015 Disclaimer: This report has been prepared based
POSTAL AND TELECOMMUNICATIONS REGULATORY AUTHORITY OF ZIMBABWE (POTRAZ) ABRIDGED POSTAL AND TELECOMMUNICATIONS SECTOR PERFORMANCE REPORT SECOND QUARTER 2015 Disclaimer: This report has been prepared based
Cost of smartphones continues the digital divide in Tanzania
 Cost of smartphones continues the digital divide in Tanzania Tanzania is ranked fourth among 49 African countries when comparing the cheapest 1GB of prepaid mobile data, yet the Internet penetration rate
Data Services Market Inquiry Public Hearings
 Data Services Market Inquiry Public Hearings Mr Sipho Maseko Group Chief Executive 18 October 2018 Key themes Key themes 1. A broad view of access to data is needed. This includes the whole ecosystem devices,
Working Party on Communication Infrastructures and Services Policy
 Unclassified DSTI/CDEP/CISP(2017)4/FINAL DSTI/CDEP/CISP(2017)4/FINAL Unclassified Organisation de Coopération et de Développement Économiques Organisation for Economic Co-operation and Development 19-Dec-2017
Evolution from GSM to UMTS (IMT-2000)*
*") Evolution from GSM to UMTS (IMT-2000)* MARIO BAUMGARTEN Siemens Ltda ICN Sao Paulo - BRAZIL * This presentation is a draft submitted by the author and the final version will be available at: http://www.itu
Evolution from GSM to UMTS (IMT-2000)* MARIO BAUMGARTEN Siemens Ltda ICN Sao Paulo - BRAZIL * This presentation is a draft submitted by the author and the final version will be available at: http://www.itu
Nigerian Telecommunications (Services) Sector Report Q2 2016
 Sector Report Q2 2016") Nigerian Telecommunications (Services) Sector Report Q2 2016 01 SEPTEMBER 2016 Telecommunications Data The telecommunications data used in this report were obtained from the National Bureau of Statistics
Nigerian Telecommunications (Services) Sector Report Q2 2016 01 SEPTEMBER 2016 Telecommunications Data The telecommunications data used in this report were obtained from the National Bureau of Statistics