Ch En 475: Introduction to Instrumentation and Signal Processing with Labview
|
|
|
- Cassandra Freeman
- 6 years ago
- Views:
Transcription
1 Ch En 475: Introduction to Instrumentation and Signal Processing with Labview Measurement Instrumentation Rapid, on-line measurement of temperature, pressure, liquid level, flow rate and composition is extremely important in the chemical process industry. Electronic communication of that information from the measurement sensors to a computer interface for data analysis and process control is also essential for safe and effective operation of processes. The two components of a process transducer to make and transmit properties are shown here: measured process variable Sensing Element Transducer Transmitter output signal Most industrial analog now has a standard output range of 4 20 ma or 1 5 VDC. Some common sensors are shown in the table below. Generally the process variable is not measured directly but obtained from a relationship between the measurable property and the desired process variable. For example, RTDs measure resistance but the resistance of the sensing element directly changes with temperature. Orifice and Venturi flow meters measure a pressure drop across an obstruction to obtain the velocity from the Bernoulli relation. Temperature Flow Pressure Level Thermocouple Orifice Bourdon tube Float Thermister Venturi Diaphragm Head device Resistance Temperature Rotameter Bellows Electrical conductivity Detector (RTD) Turbine Strain gauge Vortex-shedding Piezoelectric Thermal mass Piezoresistive It is important to keep in mind the INPUT and OUTPUT characteristics of the transducer that you are using to make a measurement. Generally transducers come stamped or marked with a Zero (Z) value, which is the minimum detectable limit of the sensor, a span (S) which is the range or difference between the maximum and minimum input limits. The gain (K) for the transducer is given by KK = OOOOOOOOOOOO IIIIIIIIII = OOOOOOOOOOOO rrrrrrrrrr SSSSSSSS 1

2 As most transducers are designed to be linear, the gain represents the slope of a straight line when the output variable is plotted against the input variable. (Note: Labview uses a scaling factor to convert from the line signal that it receives to display information in the units of the measured variable. This scale factor is therefore the reciprocal of the transducer s gain.) A linear equation can be used to determine the output, y, from any input variable, x. Thus, yy = KK(xx ZZ) + OO where O is an offset or the value of y when the input value is at the lower limit Z. For example, suppose a temperature transducer has the following specifications: Z = 50ºC, S = 100 ºC (note that the maximum temperature for which this transducer can be used is 150 ºC) with a standard output of 4 20 ma. The gain for this transducer is KK = 20 ma 4 ma 100 = 0.16 mmmm/ and the output from the transducer for a measured temperature, T, would be Signal Processing yy = 0.16 ma (TT 50 ) + 4 ma Once an output signal has been transmitted from a sensor as an analog (or digital) signal, the information needs to be sampled, collected, converted to units of the process variable measured, and made available to you for further analysis and/or to a controller which can then output a response to the final control element, most often a control valve. In the past we have had a Bailey central control system that provided these functions. In the on-line documents for the various projects, you will likely still see instructions on using the Bailey with the apparatus in the UO Lab. However, beginning Fall Semester 2010, the UO Lab has been switched to a distributed control system with individual electronic devices supply the signal to a PC and Labview software provides the signal processing functions and control output mentioned above. This relationship is illustrated here: VI DEVICE A/D converter Front Panel Block Diagram Transducers Analog Input Channels, ai n Computer running Labview 2
3 Multiple transducers can be used to measure flow, temperature, etc., at various locations within the process and Labview controls through which channel of the device the data are received and at what sampling rate for each transducer. Labview then converts the data to the process variable units for that transducer and allows the user to visualize, analyze, store and manipulate the data collected for the measured process variables as well as to set up a control loop to provide both open- and closedloop control of the control variable. The projects you will do in ChEn 475 have been interfaced with Labview for you, but to work effectively with the control and measurement system in the lab, you should have a good understanding of how the interface and software work. In Labview, measurements are set up as Virtual Instruments (VI). The user interface consists of a Block Diagram area and a Front Panel area. You create the user interface that you will see in the Front Panel window. This window will contain all of the virtual buttons, meters, output displays, controls, etc., to provide the user with the measured information from the process and control of the process. The GUI interface in the Front Panel is created by dropping control and display objects from tool palettes. It is what will be seen when RUN is selected to initiate measurements and control. As the GUI is created in the Front Panel, icons of the controls and objects dropped into the interface are also displayed in the Block Diagram window. In addition to creating the user interface, you must also tell Labview where to get signals, how to process them, and where to send that information in the objects available in the GUI you created. The Block Diagram allows you to make interconnections between the objects and to define how the signal is treated by the objects. The remainder of this document is a simple, introductory tutorial illustrating how one can use Labview to connect two analog transducers for automated measurement of flow and pressure in a pumped system. It shows the steps of creating the VI, setting up the Front Panel, and making connections in the Block Diagram. At the end of the tutorial, you will have a working interface to sample and visualize the pressure and flow rate measurements made in a system pumping water. Configuring Pressure and Flow Rate Transducers (Analog Inputs) in Labview Set Up the Control Loop LabVIEW allows you to create a graphical user interface that has switches, gauges, and other devices. You essentially create a program which begins to run when you start it and shut it down when you stop it. This is accomplished by putting everything in a while loop. 1. Open a new, blank VI in LabVIEW and separate the front panel and block diagram (control T). 2. Right-click on the block diagram and expand the Functions window by clicking on the to expand the box. 3. Navigate to Express>>Exec Control and click on While Loop with button 4. Draw a loop on the block diagram. Your window should resemble the one shown here: 3

4 Note: This while loop comes with a stop button pre-attached (see front panel for the button), chosen for convenience, as opposed to the while loop found in Programming>>Structures, where a stop button would need to be manually added in the front panel and attached in the block diagram. A while loop tells Labview to do what is in the loop while the VI is running. The stop button tells it when to stop executing the command and is necessary for this type of application. Configure the Flowrate Sensor 1. Right-click on the block diagram and navigate to Functions>>Express>>Input>>DAQ Assistant. 2. Place the DAQ Assistant inside the while loop on the block diagram, you will see a configuration box. a. Choose Acquire Signals>>Analog Input>>Voltage. b. You will then see a page with the DAQ devices listed. Note: The DAQ Assistant represents the physical module that one uses to collect data or send signals. There can be input DAQs or output DAQs. An input DAQ collects information, while an output DAQ sends out signals, in this application to power devices. There needs to be one DAQ Assistant for every physical module attached to the computer. The NI-6008 comes pre-configured to read voltage signals (mostly 1-5 Volts), while the NI-9211 comes pre-configured to read thermocouples (other DAQs can read them but would require specific scaling parameters to have accurate temperature readings). For this tutorial, you will use only an input DAQ assistant. For the PBL you will you both input and output DAQs. On an output DAQ, one chooses generate signal >> digital output (note: the input DAQ is analog) and either line (for one channel) or port (for all channels on the module). Then timing setting are usually designated as 1 sample on demand. 4
 which has provided the following calibration data (Also available at http://uolab.groups.et.byu.")
5 3. This window allows you to configure what the analog signal from channel ai0 will do. 4. Change the name of the channel from Voltage to Flowrate. a. Right-click on the word Voltage and select Rename. b. Change the name to Flowrate. 5. The flow meter is made by the McMillian Company (model 13157) which has provided the following calibration data (Also available at 5
6 Figure 1 Calibration data for the flow meter. a. The flow meter outputs a voltage. b. At 5.0 volts, the flowrate is 1.0 L/min. At 0.50 volts, the flowrate is 0.1 L/min. Labview now needs to be told this information so that the output will read in L/min. 6. Under the Custom Scaling box, select Create New. 7. You have several options available to calibrate this signal. a. Linear: Allows you to specify a slope and intercept (gain and offset). The calibration data shown in Figure 1 are fairly linear so they could be fit to a straight line (in Excel or Mathcad) and the resulting slope and intercept could be used. b. Map Ranges: Allows you to input two points for the ranges of input and output. Labview then assumes a straight line model to obtain the gain. Two of the points in Figure 1 could be used with this option. c. Polynomial: Allows you to specify the coefficients in a polynomial. The coefficients are obtained by fitting the calibration data in Excel or Mathcad. 6
7 d. Table: If the calibration data don t seem to follow either a polynomial or a straight line, a table of data can be entered. LabView will then interpolate linearly between the table points. 8. Select Linear and rename the calibration Flow Meter Linear. a. Figure 2 contains a linear fit of the calibration data found in Figure Flowrate (L/min) y = x R² = Voltage (V) Figure 2 Fit of flowmeter calibration data to a straight line model. b. In the Scaling Parameters, change the slope to 0.20 and the intercept to 0. Note: Labview is doing the opposite of what the transducer does the input for Labview is the line signal (voltage in this case) and the output is the flow rate. The scale factor is therefore the inverse of the gain that the transducer uses to produce the line signal from the measured variable. c. In the Units, type L/min in the Scaled box. d. Click OK. This will return you to DAQ configuration window. e. Under Settings under the Voltage Input Setup, change the Signal Input Range to correspond to the min and the max of the calibration curve for the scaled output (L/min). i. Change the Max to 1 and the Min to 0. ii. Ensure that L/min is found in the Scaled Units box. 9. Set the timing settings. a. The timing settings affect how often LabVIEW the read the input from the channel. b. Select Continuous Samples from the Acquisition Mode box. 10. Once done, your window should look like this: 7

8 11. Click OK. Configure the Pressure Sensor 1. To configure the pressure sensor, begin in the DAQ window, click on the button under Channel Settings, and select Voltage. 2. Select channel ai1 on the device and click OK. This will cause another channel to appear in the Channel Settings box. 8

9 3. Rename this channel from Voltage to Pressure. 4. The pressure sensor is made by Cole Parmer. The label on the sensor indicates the voltage range to be 1 to 5 volts and the maximum pressure to be 30 psig. a. This means that at 5 volts, the pressure is 30 psig. b. Though not explicitly stated, you can assume the pressure is 0 psig at 1 volt. 5. Tell LabVIEW the scaling by selecting Create New under the Custom Scaling box. 6. Select Map Ranges a. Name the scale Pressure Calibration. b. Change the Pre-Scaled Maximum value to 5 and the Minimum value to 1. c. Change the Scaled Values to 30 and 0 for the maximum and minimum respectively. d. In the Units, type psig in the Scaled box. e. Click OK. This will return you to DAQ configuration window. f. Under Settings under the Voltage Input Setup, change the Signal Input Range to correspond to the min and the max of the calibration curve for the scaled output (psig). g. Set the timing settings by selecting Continuous Samples from the Acquisition Mode box. 7. Once done, your window should look like this. 9

10 8. Click OK and your block diagram should now look like the following: 10

11 Add the Gauges to Display the Measured Pressure and Flow Rates Now that LabVIEW knows how to interpret the signals sent to the board, you need to provide a convenient and useful display of the output results for the user in the GUI you are developing in the Front Panel window. 1. On the Front Panel, right-click and navigate to Numerical Indicators. 2. Select Gauge and place the gauge on the front panel. (This gauge will be used to output the pressure.) 3. Right-click on the gauge and select Properties. 4. On the Appearance tab, change the Label to Pressure psig. 5. On the Scale tab, change the Scale Range minimum to 0 and the maximum to Click OK and rescale the gauge to the desired size by dragging on the Front Panel. 7. Using a similar procedure, add a digital output (Right-click>>Num Inds>>Num Ind) for the pressure. Rename as appropriate. 8. Using a similar procedure, add a Meter and a Num Ind for the flowrate. (Don t forget to rename each gauge and change the range.) 9. Your window should now look like the following: Connect the Gauges to the DAQ All that remains is to connect the gauges to the DAQ and set up the interrelationships of the objects you have created in the user interface. 11

12 1. Right-click on the block diagram and select Sig Manip>>Split Signals. (Note: on some machines you may have to search a little for this, but you should be able to find it under Express > Signal Manipulation > Split Signals. 2. Place the signal split icon on the block diagram as shown: 3. Drag the signal split down just enough to create two signals. 4. Connect the top signal (ai0 - the analog input channels are numbered from ai0 down starting at the top of the icon) to one of the flowrate boxes. 5. Connect the bottom signal (ai1) to one of the pressure boxes. 12
13 6. Beginning at the unconnected flowrate box, drag a line to the middle of the line currently connecting the signal splitter and the first flowrate box. 7. Do the same thing for the unconnected pressure box. 13
14 8. Finally, connect the DAQ to the splitter by drawing a line from the arrow next to the word data to the signal splitter. 9. If your block diagram is somewhat unorganized and lines are hidden or blocked, you can clean the diagram up by dragging objects around to where you want them (and the lines will follow and change with the drag), by right clicking on the wire and selecting Clean up Wire or you can simply press CNTRL+U, which will organize the Block Diagram for you. 10. Now you are ready to go into the lab and connect up the actual equipment. Labview will help you make the right connections. a. Right click on the DAQ and select Properties. b. Select the Connection Diagram tab in the upper pane. c. Selecting the Flow Rate channel and Labview will show the pin out for connecting the flow transducer to the device; selecting the Pressure channel will show the pin out for the pressure transducer. You may see something like on the last page. Create Temperature DAQ This section will cover how to make a new DAQ assistant for the thermocouple. Most of the steps will be omitted to test what you have learned. 1. Create a new DAQ assistant to use a thermocouple input within the while loop 2. Specify the thermocouple type within the configuration tab (look at the connector to determine type) 3. Set the acquisition mode to match the pressure/flow DAQ 14
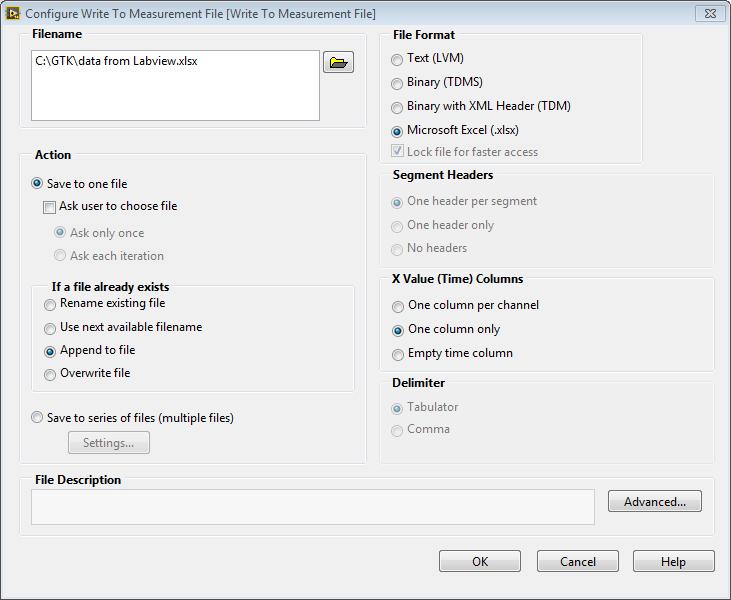
15 4. Create two read outs on the front panel Create Write to Measurement file loop Now you will learn how to write the flow, pressure and temperature data to a measurement file. At this point your block diagram should look something like what is shown on the next page: (It is not intended that you copy the front panel indicators. The indicators pictured here are not likely to be used for this application. They are intended to be place holders, allowing you to learn the idea and then apply it to your system.) 1. Add a case structure loop to the right of the temperature DAQ Programming >>Structures>>Case Structure 15
16 2. Right click the green question mark of the case structure and select Create Control. This will create an on/off Boolean switch in the front panel with a corresponding figure wired to the loop, which can be retitled as appropriate. 3. Place a write to measurement file inside the case structure Programming>>File I/O>>Write Meas F.. 4. Choose parameters for the file. The ones chosen as follows allow for new data to be appended or added each time data is written saved in an Excel file with one time column. It is recommended that the file be saved on the students J:\ drive. Click OK. The block diagram should look as on the next page. 16
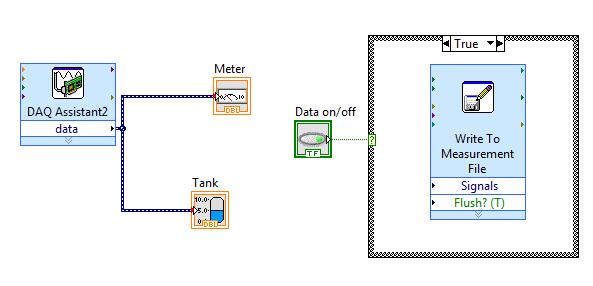
17 17

18 5. Now connect the data channels from both DAQs to the signals input on the write to measurement file using a merge signals found in Express>>Sig Manip>> Merge Signals. The lines should be branched, meaning the wire spool cursor should be held over the wire until it is blinking and then clicked. On the flow/pressure DAQ the line should be taken before the split signal. It will look something like below: 18

19 Create Digital Output to Start/Stop Pump Labview allows one to send out a signal as well as process an incoming one. In this part you will configure a digital output that will allow you to start and stop the peristaltic pump. 1. Right-click on the block diagram and navigate to Functions>>Express>>Output>>DAQ Assistant Note: Like the Input DAQ, each output DAQ represents a physical module (or in this case a side of one the NI USB-6008). You can tell the difference between the input and output DAQ by the way the arrow points from data. 2. The DAQ will then process and open a dialogue box as shown below. Here you want to generate a signal that is a digital output. There are two options line or port output. Line means one channel. Port means every channel. Here choose line output. 3. Next you will be prompted to select the channel where the output will be attached. Take a moment to review the digital terminal assignments for the USB-6008, found on the UO Lab webpage under hints for the instrumentation and labview experiment (or follow the hyperlink). Note where the digital output are on the USB In this case select Port 0/line 0 and then click finish. 19
 for the pump and wire it to the DAQ. The way it is wired, what is normally thought of as on (i.e. a lighted indicator) will be off.")
20 4. A dialogue will pop up that will ask you to invert the line and allow you to change the timing settings. Keep these on 1 sample on demand. 5. The last task is to create a control (on/off button) for the pump and wire it to the DAQ. The way it is wired, what is normally thought of as on (i.e. a lighted indicator) will be off. Keep switched as demonstrated below when the pump is off. 20

21 6. The system is now ready to be wired. Double click on either DAQ Assistant, click on the Connection Diagram in the upper left and a diagram like below will appear. 7. The positive and negative wires for the flow meter and pressure transducer are found in the hints folder on the UO Lab website under Transducer instructions and flow sensor instructions. The thermocouple wires are shown on the wiring diagram. All thermocouples are consistent in their color coding. The wiring for the pump can be found here. Use that with the digital terminal assignments (the ground is the negative end). You are now ready to connect to the flow meter, pressure transducer and thermocouple! Have Mike or John check your wiring before you plug the cart in or turn anything on. 21
Ch En 475: Introduction to Instrumentation and Signal Processing with Labview
 Ch En 475: Introduction to Instrumentation and Signal Processing with Labview Measurement Instrumentation Rapid, on-line measurement of temperature, pressure, liquid level, flow rate and composition is
Determination of Drag Coefficient
 DEPARTMENT OF MECHANICAL, INDUSTRIAL AND MANUFACTURING ENGINEERING MIMU 505 - MEASUREMENT AND ANALYSIS Determination of Drag Coefficient You will need to bring a zip disk or USB storage device to the lab
Lab Exercise 2: Data Acquisition with NI LabVIEW
 Objective When you have completed this exercise, you will be able: To use the DAQ Assistant to acquire analog data measurements with NI LabVIEW To use Write to Measurement express VI to log real time data
PHY 351/651 LABORATORY 1 Introduction to LabVIEW
 PHY 351/651 LABORATORY 1 Introduction to LabVIEW Introduction Generally speaking, modern data acquisition systems include four basic stages 1 : o o A sensor (or transducer) circuit that transforms a physical
STATE COLLEGE OF NEW YORK COLLEGE OF TECHNOLOGY CANTON, NEW YORK COURSE OUTLINE MFGT INSTRUMENTATION AND CONTROLS
 STATE COLLEGE OF NEW YORK COLLEGE OF TECHNOLOGY CANTON, NEW YORK COURSE OUTLINE MFGT 220 - INSTRUMENTATION AND CONTROLS Prepared By: Daniel Miller Revised By: Daniel Miller 4/5/12 CANINO SCHOOL OF ENGINEERING
BE/EE189 Design and Construction of Biodevices Lecture 5. BE/EE189 Design and Construction of Biodevices - Caltech
 BE/EE189 Design and Construction of Biodevices Lecture 5 LabVIEW Programming Data acquisition DAQ system Signals and signal conditioning Nyquist frequency NI ELVIS II NI-DAQmx and DAQ assistant LabVIEW
Introduction to Labview and Temperature Measurement
 Introduction to Labview and Temperature Measurement Objective This lab is intended to familiarize you with the LABVIEW software and the data acquisition board used in this class and with temperature measurements
Strain and Force Measurement
 NORTHEASTERN UNIVERSITY DEPARTMENT OF MECHANICAL, INDUSTRIAL AND MANUFACTURING ENGINEERING MIMU 0-MEASUREMENT AND ANALYSIS Strain and Force Measurement OBJECTIVES The primary objective of this experiment
LabVIEW Tutorials. T.1 Temperature Measurement and Cold Junction Compensation (CJC) LUMS School of Science and Engineering
 LUMS School of Science and Engineering") LabVIEW Tutorials T.1 Temperature Measurement and Cold Junction Compensation (CJC) LUMS School of Science and Engineering Umer Hassan & Muhammad Sabieh Anwar Introduction: In this tutorial we shall learn
LabVIEW Tutorials T.1 Temperature Measurement and Cold Junction Compensation (CJC) LUMS School of Science and Engineering Umer Hassan & Muhammad Sabieh Anwar Introduction: In this tutorial we shall learn
Version 1.1. COPYRIGHT 1999 Tufts University and Vernier Software. ISBN (Windows) ISBN (Macintosh)
 ISBN (Macintosh)") Logger Pro Tutorials Version 1.1 COPYRIGHT 1999 Tufts University and Vernier Software ISBN 0-918731-92-5 (Windows) ISBN 0-918731-91-7 (Macintosh) Distributed by Vernier Software 8565 S.W. Beaverton-Hillsdale
Logger Pro Tutorials Version 1.1 COPYRIGHT 1999 Tufts University and Vernier Software ISBN 0-918731-92-5 (Windows) ISBN 0-918731-91-7 (Macintosh) Distributed by Vernier Software 8565 S.W. Beaverton-Hillsdale
Homework Assignment 9 LabVIEW tutorial
 Homework Assignment 9 LabVIEW tutorial Due date: Wednesday, December 8 (midnight) For this homework assignment, you will complete a tutorial on the LabVIEW data acquistion software. This can be done on
OpenStax-CNX module: m Thermometer VI * National Instruments
 OpenStax-CNX module: m12209 1 Thermometer VI * National Instruments This work is produced by OpenStax-CNX and licensed under the Creative Commons Attribution License 1.0 Exercise 1 Complete the following
Data Acquisition Laboratory
 Session 2559 Data Acquisition Laboratory Asad Yousuf Savannah State University Abstract The essential element to automate your system for data collection and analysis is termed as the data acquisition.
Engineering Project-I. Module 1: Familiarization of LabVIEW and the Vernier Toolkit
 Engineering Project-I Module 1: Familiarization of LabVIEW and the Vernier Toolkit PREPARED BY Academic Services Unit January 2012 Applied Technology High Schools, 2012 Module 1: Familiarization of LabVIEW
Data acquisition hardware
 Data acquisition hardware Data acquisition (DAQ) is the process of sampling signals that measure real world physical conditions and converting the resulting samples into digital numeric values that can
Data Acquisition HANS-PETTER HALVORSEN,
 Telemark University College Department of Electrical Engineering, Information Technology and Cybernetics Data Acquisition HANS-PETTER HALVORSEN, 2011.10.14 Faculty of Technology, Postboks 203, Kjølnes
ENGR 1000, Introduction to Engineering Design
 ENGR 1000, Introduction to Engineering Design Unit 2: Data Acquisition and Control Technology Lesson 2.1: Programming Line Outputs for the NI USB-6008 in LabVIEW Hardware: 12 VDC power supply Several lengths
Basic Data Acquisition with LabVIEW
 Basic Data Acquisition with LabVIEW INTRODUCTION This tutorial introduces the creation of LabView Virtual Instruments (VI s), in several individual lessons. These lessons create a simple sine wave signal,
Small rectangles (and sometimes squares like this
 Lab exercise 1: Introduction to LabView LabView is software for the real time acquisition, processing and visualization of measured data. A LabView program is called a Virtual Instrument (VI) because it,
Introduction to National Instruments LabVIEW and Data Acquisition (DAQ)
") Introduction to National Instruments LabVIEW and Data Acquisition (DAQ) Danial J. Neebel, Joseph R. Blandino, and David J. Lawrence, College of Integrated Science and Technology James Madison University
Introduction to National Instruments LabVIEW and Data Acquisition (DAQ) Danial J. Neebel, Joseph R. Blandino, and David J. Lawrence, College of Integrated Science and Technology James Madison University
To demonstrate wide range of experiments, applications and advanced control techniques using industry standard instrumentation and controls.
 MI 330 UNIVERSAL PROCESS CONTROL TRAINER OBJECTIVE To demonstrate wide range of experiments, applications and advanced control techniques using industry standard instrumentation and controls. FEATURES
Industrial Wet/Wet Differential Pressure Transducer
 Industrial Wet/Wet Differential Pressure Transducer With High Over Pressure Capacity mv/v Output 0-5 Vdc Output 4-20 ma Output Model MD1-002DV Model MB1-100DV L 735 Basic Unit 1 bar = 14.5 psi 1 kg/cm
Using DataQuest on a Handheld
 Using DataQuest on a Handheld Appendix B This appendix gives an overview of using the Vernier DataQuest application on a TI-Nspire handheld. It includes information on accessing the common tools in the
Computer Interfacing Using LabView
 Computer Interfacing Using LabView Physics 258 Last revised September 25, 2005 by Ed Eyler Purpose: Note: To write a simple LabView program that digitizes data using an ADC on a data acquisition card,
Dept. of Electrical, Computer and Biomedical Engineering. Data Acquisition Systems and the NI LabVIEW environment
 Dept. of Electrical, Computer and Biomedical Engineering Data Acquisition Systems and the NI LabVIEW environment Data Acquisition (DAQ) Use of some data acquisition technique can be convenient, when not
Purpose of Today s Presentation
 Metering, Monitoring, and Verification APPA Institute for Facilities Management February 6, 2014 Purpose of Today s Presentation To provide a broad understanding of: Metering installation and application
Computer Essentials Session 1 Lesson Plan
 Note: Completing the Mouse Tutorial and Mousercise exercise which are available on the Class Resources webpage constitutes the first part of this lesson. ABOUT PROGRAMS AND OPERATING SYSTEMS Any time a
1. Learn about LabView software and its different components
 SfwrEng 4aa3/4ga3 Lab 1 Lab Sessions: Week starting Sept. 21, 2009. Pre-lab reports Due: Week Starting Sept. 21, 2009 at the start of lab sessions. Lab-Reports Due: Week Starting Oct. 5, 2009 at the start
Scanner 2000 microefm QuickStart. Installing the Scanner Remote Mount. Direct Mount NUFLO. Part No , Rev. A
 NUFLO Part No. 30165024, Rev. A Scanner 2000 microefm QuickStart Installing the Scanner 2000 H L H L Flow Direct Mount To install the Scanner 2000 microefm using a direct mount to an orifice or cone meter
Learn the three palettes. Learn how data is passed in LabVIEW. Create a subvi using two different methods.
 UNM The LabVIEW Programming Environment and Basic Operations Introduction In this hands-on, you will learn about the LabVIEW programming environment. You will also write a simple Virtual Instrument (VI)
Logger Pro Resource Sheet
 Logger Pro Resource Sheet Entering and Editing Data Data Collection How to Begin How to Store Multiple Runs Data Analysis How to Scale a Graph How to Determine the X- and Y- Data Points on a Graph How
Clamp-On Digital Multimeters
 Clamp-On Digital Multimeters GS-Mark EN61010-1 Approval Voltage Category III 600 V, Pollution Degree II AC/DC Current Clamp Highly Accurate 1999, 2500, 3999, 4300 Counts Resolution MAX, Data Hold, PEAK,
Step-by-Step Data Acquisition Part II Exercise 2: Generating an Analog Output Waveform
 Step-by-Step Data Acquisition Part II Exercise 2: Generating an Analog Output Waveform In this exercise, you will use the DAQ Assistant to build a LabVIEW VI that generates and outputs an analog waveform.
ENGR 1000, Introduction to Engineering Design
 ENGR 1000, Introduction to Engineering Design Unit 2: Data Acquisition and Control Technology Lesson 2.2: Programming Line Inputs with Boolean Values Hardware: 12 VDC power supply Several lengths of wire
Data Acquisition in LabVIEW
 University College of Southeast Norway Data Acquisition in LabVIEW Hans-Petter Halvorsen, 2016.10.28 http://home.hit.no/~hansha Preface This tutorial explains the basic concepts of a Data Acquisition in
User Manual Digi-Sense 12-Channel Benchtop Data Logging Thermocouple Thermometer
 User Manual Digi-Sense 12-Channel Benchtop Data Logging Thermocouple Thermometer Model: 92000-01 THE STANDARD IN PRECISION MEASUREMENT Table of Contents Introduction... 3 Unpacking... 3 Initial Setup...3
NI mydaq HANS-PETTER HALVORSEN, Telemark University College Department of Electrical Engineering, Information Technology and Cybernetics
 Telemark University College Department of Electrical Engineering, Information Technology and Cybernetics NI mydaq HANS-PETTER HALVORSEN, 2012.01.20 Faculty of Technology, Postboks 203, Kjølnes ring 56,
University of Michigan Department of Aerospace Engineering 5ft 7ft Wind Tunnel Data Acquisition Bible
 University of Michigan Department of Aerospace Engineering 5ft 7ft Wind Tunnel Data Acquisition Bible Richard B. Choroszucha riboch@umich.edu 16.V.2010 Contents List of Figures vi I Gathering Data 1 1
Using LabVIEW. with. BiPOM Boards. Quick Start Guide. Document Revision: Date: 18 September, 2009
 Using LabVIEW with BiPOM Boards Quick Start Guide Document Revision: 1.01 Date: 18 September, 2009 BiPOM Electronics, Inc. 16301 Blue Ridge Road, Missouri City, Texas 77489 Telephone: 1-713-283-9970. Fax:
Conductivity Transmitters
 Conductivity Transmitters CDTX-90 Series Starts at $ 576 Electronics Only Display in µs, ms, kω, MΩ, ppm (TDS) Simulate Function Programmable Temperature Compensation Relay Options Dual Output Option Allows
Appendix C. Vernier Tutorial
 C-1. Vernier Tutorial Introduction: In this lab course, you will collect, analyze and interpret data. The purpose of this tutorial is to teach you how to use the Vernier System to collect and transfer
INTRODUCTION TO LABVIEW
 INTRODUCTION TO LABVIEW 2nd Year Microprocessors Laboratory 2012-2013 INTRODUCTION For the first afternoon in the lab you will learn to program using LabVIEW. This handout is designed to give you an introduction
Appendix E: Software
 Appendix E: Software Video Analysis of Motion Analyzing pictures (movies or videos) is a powerful tool for understanding how objects move. Like most forms of data, video is most easily analyzed using a
Create a worksheet that collects, displays and saves temperature data
 DASYLab Techniques Create a worksheet that collects, displays and saves temperature data This document describes how to create a worksheet that acquires and processes temperature data using Measurement
Tutorial - Introduction to LabScribe and the IX-ELVIS
 Tutorial - Introduction to LabScribe and the IX-ELVIS Background In addition to its prototyping capabilities, the iworx Bioinstrumentation Breadboard for the National Instruments Educational Laboratory
NAME EET 2259 Lab 3 The Boolean Data Type
 NAME EET 2259 Lab 3 The Boolean Data Type OBJECTIVES - Understand the differences between numeric data and Boolean data. -Write programs using LabVIEW s Boolean controls and indicators, Boolean constants,
Purpose of Today s Presentation
 Metering, Monitoring, and Verification Part 1 APPA Institute for Facilities Management Scottsdale, AZ September 15, 2015 Purpose of Today s Presentation To provide a broad understanding of: Metering installation
Hands-on Lab 2: LabVIEW NI-DAQ Basics 2
 Hands-on Lab 2: LabVIEW NI-DAQ Basics 2 Recall that the final objective is position regulation using computer-controlled state feedback. Computer control requires both software, like LabVIEW and hardware,
The LabVIEW Programming Environment and Basic Operations
 Page 1 of 14 UNM The LabVIEW Programming Environment and Basic Operations Introduction In this hands-on, you will learn about the LabVIEW programming environment. You will also write a simple Virtual Instrument
Install the Software and Hardware
 WHERE TO START WITH YOUR NI 4350/4351 This document explains how to begin using your National Instruments 4350/4351 high-precision temperature and voltage meters. The NI 4350/4351 (NI 435x) products include
EDX-10 Series. Compact Recording System
 3-51 EDX-10 Series Compact Recording System Compact & lightweight, with a simple configuration, all channels synchronous 20 khz high-speed sampling (For 4 channels) Control Unit EDX-10B A unit controls
Hardware: Acquiring Data and Communicating with Instruments
 Hardware: Acquiring Data and Communicating with Instruments 4 Acquiring a Signal This chapter introduces you to the Express VIs you use to acquire data and communicate with instruments on Windows. These
Digital Panel Meters
 Digital Panel Meters For, Process, Voltage and Current DP63000 Starts at 81 DP63000B-E, 90, Thermocouple Inputs RTD Inputs Programmable Offset Selectable F or C with 1 or 0.1 Degree Resolution 3 Selectable
Read Temperature Data
 Read Temperature Data Exercise 5 Completed front panel and block diagram In this exercise, you will create a program using SensorDAQ s Analog Express VI to collect temperature data and display it on a
Labview. Masood Ejaz
 Labview A Tutorial By Masood Ejaz Note: This tutorial is a work in progress and written specially for CET 3464 Software Applications in Engineering Technology, a course offered as part of BSECET program
Physics 101, Lab 1: LINEAR KINEMATICS PREDICTION SHEET
 Physics 101, Lab 1: LINEAR KINEMATICS PREDICTION SHEET After reading through the Introduction, Purpose and Principles sections of the lab manual (and skimming through the procedures), answer the following
Honeywell HC-900 with Acromag 967EN Modbus/TCP Module as Remote I/O
 Acromag, Incorporated 30765 S Wixom Rd, PO Box 437, Wixom, MI 48393-7037 USA Tel: 248-295-0880 Fax: 248-624-9234 www.acromag.com Honeywell HC-900 with Acromag 967EN Modbus/TCP Module as Remote I/O Contents:
Datalogging in LabVIEW
 Telemark University College Department of Electrical Engineering, Information Technology and Cybernetics Datalogging in LabVIEW HANS-PETTER HALVORSEN, 2011.01.04 Faculty of Technology, Postboks 203, Kjølnes
Vernier SensorDAQ User s Manual
 Vernier SensorDAQ User s Manual Vernier SensorDAQ User s Manual 2011 by Vernier Software & Technology. All rights reserved. You are entitled to reproduce parts of this manual for use in your educational
CONTENTS. 1- INTRODUCTION 1.1 Introduction 1.2 General Applications and Benefits 1.3 Identification 2- HARDWARE
 1 CONTENTS 1- INTRODUCTION 1.1 Introduction 1.2 General Applications and Benefits 1.3 Identification 2- HARDWARE 3- SOFTWARE DESCRIPTION 3.1 Introduction 3.2 TVS-1000 software 3.3 Software Installation
Labview Lab 2. Vern Lindberg. April 16, 2012
 Labview Lab 2 Vern Lindberg April 16, 2012 1 Temperature Measurement Thermistors are sensitive semiconductor devices that can measure temperature over a restricted temperature range. The thermistors we
TMA Standard Operating Procedure [Updated April 30, 2015]
![TMA Standard Operating Procedure [Updated April 30, 2015]](/thumbs/71/65555959.jpg "TMA Standard Operating Procedure [Updated April 30, 2015]") Thermomechanical Analysis Q400 Location of Machine: Composites Lab, RFM 1218 Location of SOP and Machine Operating & Safety Manual: Composites Lab website under resources; Composites Lab TRACS site; and
Thermomechanical Analysis Q400 Location of Machine: Composites Lab, RFM 1218 Location of SOP and Machine Operating & Safety Manual: Composites Lab website under resources; Composites Lab TRACS site; and
CHAPTER IV Computerized Data-acquisition Systems
 CHAPTER IV Computerized Data-acquisition Systems The signal outputting a sensor is usually an analog signal. Post-processing methods involve, however, complex mathematical formulations. The data recorded
Above Threshold Warning of Temperature Data
 Above Threshold Warning of Temperature Data Exercise 6 Completed front panel and block diagram. The hidden case Celsius is also shown in this picture. In the following exercise, you will create a program
Appendix 1: DataStudio with ScienceWorkshop Sensors Tech Tips
 Appendix 1: DataStudio with ScienceWorkshop Sensors Tech Tips Section 1: Starting an experiment 1.1 Opening a file 1. Open the File menu and select Open Activity. 2. In the Open dialog box, navigate to
EDX-10 Series. Compact Recording System
 3-49 EDX-10 Series Compact Recording System Compact, lightweight, with a simple configuration, all channels synchronous 20 khz high-speed sampling (For 4 channels) Control Unit EDX-10B A unit controls
Expandable Modular Data Acquisition System inet-400 Series
 Expandable Modular Data Acquisition System inet-400 Series inet-555 665 Complete Starter System USB 2.0 High Speed Data Acquisition Hardware for Windows XP SP2, Vista or 7 (XP/VS/7) Analog and Digital
Standard Operating Procedure For The Kaye Validator 2000 Thermal Mapping System
 Standard Operating For The Kaye Validator 2000 Thermal Mapping System SOP No: V01/SOP/505/15 Version No: 01 No of Copies issued: 01 Copy Number: 01 PharmaTherm Limited Circulation: 1. Mr Andrew Varley,
LABVIEW LAB SKILLS ACTIVITY 1 PROGRAMING ENVIRONMENT
 LABVIEW LAB SKILLS ACTIVITY 1 PROGRAMING ENVIRONMENT WHAT IS LABVIEW? LabVIEW is a graphical programing language designed for scientists and engineers for experimental control and data acquisition. Most
Using LoggerPro. Nothing is more terrible than to see ignorance in action. J. W. Goethe ( )
") Using LoggerPro Nothing is more terrible than to see ignorance in action. J. W. Goethe (1749-1832) LoggerPro is a general-purpose program for acquiring, graphing and analyzing data. It can accept input
Using LoggerPro Nothing is more terrible than to see ignorance in action. J. W. Goethe (1749-1832) LoggerPro is a general-purpose program for acquiring, graphing and analyzing data. It can accept input
Quick Start Training Guide
 Quick Start Training Guide Table of Contents 1 INTRODUCTION TO MAPLESIM... 5 1.1 USER INTERFACE... 5 2 WORKING WITH A SAMPLE MODEL... 7 2.1 RUNNING A SIMULATION... 7 2.2 GRAPHICAL OUTPUT... 7 2.3 3D VISUALIZATION...
The data acquisition components, and their relationship to each other, are shown below.
 Data acquisition system Part (1) Digital inputs output and counter You can think of a data acquisition system as a collection of software and hardware that connects you to the physical world. A typical
MadgeTech 4 Software User Guide:
 MadgeTech 4 Software User Guide: Getting to Know the Software: Here is a starting screenshot of the MadgeTech 4 software. As you can see in the figure, there are three main tabs in the top left. In the
TNG-3B derives its operating power from the serial port. The DTR, RTS, and both data lines are all used, and must be properly connected.
 TNG-3B FAQ December 4, 2004 1. What s a TNG? TNG is pronounced thing as in The Cat in the Hat by Dr. Seuss, and stands for totally neat gadget. TNG-3B is the third in an evolutionary line of simple data
Advanced NI-DAQmx Programming Techniques with LabVIEW
 Advanced NI-DAQmx Programming Techniques with LabVIEW Agenda Understanding Your Hardware Data Acquisition Systems Data Acquisition Device Subsystems Advanced Programming with NI-DAQmx Understanding Your
Technical Note: Integrating a C-sense pco 2 Sensor to a Sea-Bird Electronics SBE 19 CTD
 Sea-Bird Electronics CTDs are capable of accepting a 0-5 volt analog signal through an auxiliary port on the instrument enabling it to record data from a Turner Designs C-Sense pco2 sensor. Fundamental
GEORGIA INSTITUTE OF TECHNOLOGY School of Electrical and Computer Engineering ECE 2020 Fall 2017 Lab #1: Digital Logic Module
 GEORGIA INSTITUTE OF TECHNOLOGY School of Electrical and Computer Engineering ECE 2020 Fall 2017 Lab #1: Digital Logic Module GOAL To introduce the physical implementation of digital logic circuits including
Tutorial 3: Using the Waveform Viewer Introduces the basics of using the waveform viewer. Read Tutorial SIMPLIS Tutorials SIMPLIS provide a range of t
 Tutorials Introductory Tutorials These tutorials are designed to give new users a basic understanding of how to use SIMetrix and SIMetrix/SIMPLIS. Tutorial 1: Getting Started Guides you through getting
Lab 4 - Data Acquisition
 Lab 4 - Data Acquisition 1/13 Lab 4 - Data Acquisition Report A short report is due at 8:00 AM on the Thursday of the next week of classes after you complete this lab. This short report does NOT need to
Module 2, Add on lesson Introduction to the NXT and Mindstorms software. Student. 45 minutes
 Module 2, Add on lesson Introduction to the NXT and Mindstorms software Student 45 minutes Purpose of this lesson Write a basic program using LEGO Mindstorms Download and run programs on the NXT Materials
Kulite DAQ. Data Acquisition Software User s Manual. Version 3.2.0
 Kulite DAQ Data Acquisition Software User s Manual Version 3.2.0 Table of Contents Kulite DAQ Overview... 3 Main Window... 4 1. Menu bar... 4 2. Interface selection... 5 3. Found devices... 5 4. Sorting...
2 Lab 2: LabVIEW and Control System Building Blocks
 2 Lab 2: LabVIEW and Control System Building Blocks 2.1 Introduction Controllers are built from mechanical or electrical building blocks. Most controllers are implemented in a program using sensors to
Level control with DeltaV using MPC
 Faculty of Technology Level control with DeltaV using MPC Fakultet for teknologiske fag Adresse: Kjølnes ring 56, 3918 Porsgrunn, telefon 35 02 62 00, www.hit.no Bachelorutdanning - Masterutdanning Ph.D.
User Manual for Portable National Instruments Board, Bridge Amplifiers, and VI Logger Software
 1 User Manual for Portable National Instruments Board, Bridge Amplifiers, and VI Logger Software David Saxby, School of Human Kinetics, Faculty of Health Science, University of Ottawa Last modified: 16
You will be prompted to start video or register now, exit out of this pop up to continue to the program
 Aspen Plus Tutorial Start Menu -> All Programs -> Aspen Plus -> Aspen Plus V9 You will be prompted to start video or register now, exit out of this pop up to continue to the program If you want to start
ME 365 EXPERIMENT 3 INTRODUCTION TO LABVIEW
 ME 365 EXPERIMENT 3 INTRODUCTION TO LABVIEW Objectives: The goal of this exercise is to introduce the Laboratory Virtual Instrument Engineering Workbench, or LabVIEW software. LabVIEW is the primary software
Microsoft Word for Report-Writing (2016 Version)
") Microsoft Word for Report-Writing (2016 Version) Microsoft Word is a versatile, widely-used tool for producing presentation-quality documents. Most students are well-acquainted with the program for generating
Microsoft Word for Report-Writing (2016 Version) Microsoft Word is a versatile, widely-used tool for producing presentation-quality documents. Most students are well-acquainted with the program for generating
LABORATORY USE OF A MICROCOMPUTER (Last Revision: August 27, 2000)
") LABORATORY USE OF A MICROCOMPUTER (Last Revision: August 27, 2000) ABSTRACT: A program, LabVIEW, is used to enable a microcomputer to acquire and manipulate data and to generate output voltages. TEXT REFERENCE:
LABORATORY USE OF A MICROCOMPUTER (Last Revision: August 27, 2000) ABSTRACT: A program, LabVIEW, is used to enable a microcomputer to acquire and manipulate data and to generate output voltages. TEXT REFERENCE:
Fox Thermal Instruments, Inc.
 Fox Thermal Instruments, Inc. THERMAL MASS FLOW METER & TEMPERATURE TRANSMITTER FT3 View www.foxthermalinstruments.com 399 Reservation Road Marina, CA. 93933 104845 Rev. D Notice FOX THERMAL INSTRUMENTS
ECE 451 Automated Microwave Measurements Laboratory. Experiment No. 2. Automated RF Power Detection Using LabVIEW
 Introduction ECE 451 Automated Microwave Measurements Laboratory Experiment No. 2 Automated RF Power Detection Using LabVIEW Experiment design is undoubtedly the most difficult aspect of an engineering
LABQUEST 2 DATA LOGGER
 Page 29 LABQUEST 2 DATA LOGGER OBJECTIVES: 1. To introduce the fundamentals of the use of the LabQuest 2 data logger. 2. To illustrate the use of Logger Pro graphing software to graph and analyze data
Spectroscopic Analysis: Peak Detector
 Electronics and Instrumentation Laboratory Sacramento State Physics Department Spectroscopic Analysis: Peak Detector Purpose: The purpose of this experiment is a common sort of experiment in spectroscopy.
5450 NW 33rd Ave, Suite 104 Fort Lauderdale, FL Fruitland Ave Los Angeles, CA UM Channel Monitor.
 5450 NW 33rd Ave, Suite 104 Fort Lauderdale, FL 33309 3211 Fruitland Ave Los Angeles, CA 90058 UM-600 6-Channel Monitor Version 2 Installation and Operation Manual Rev. G P/N145F-12990 PCO 00007462 (c)
Notes on installing and using the OM-USB-5201 and OM-USB-5203 data logging devices
 Notes on installing and using the OM-USB-5201 and OM-USB-5203 data logging devices Thank you for purchasing the OM-USB-5201 or OM-USB-5203 device from Omega Engineering! Please read this sheet to help
C100 Portable Multifunction
 C100 Portable Multifunction Superior Accuracy as compared to Competitors! Wahl C100 Simultaneous Measurement and Generation Rugged IP54 Construction for On Site Use Quick Connect Terminals Measurement
Operation Manual for Multifunctional Data Logger. HUATO Electronic Co., LTD.
 Operation Manual for Multifunctional Data Logger HUATO Electronic Co., LTD. Contents Contents...2 1. Introduction...1 1.1 Features...1 1.2 Structure for S210 multifunctional data logger...1 1.3 LCD symbols
Module 2, Add on lesson Introduction to the NXT and Mindstorms software. Teacher. 45 minutes
 Module 2, Add on lesson Introduction to the NXT and Mindstorms software Teacher 45 minutes Purpose of this lesson Write a basic program using LEGO Mindstorms Download and run programs on the NXT Materials
0 Graphical Analysis Use of Excel
 Lab 0 Graphical Analysis Use of Excel What You Need To Know: This lab is to familiarize you with the graphing ability of excels. You will be plotting data set, curve fitting and using error bars on the
Forston Labs LabNavigator
 Forston Labs LabNavigator (Order Code LabNavigator) Overview Welcome to LabNavigator. This guide will get you started with basic data collection. More information is available in the LabNavigator Reference
Linear Control Systems LABORATORY
 Islamic University Of Gaza Faculty of Engineering Electrical Engineering Department Linear Control Systems LABORATORY Prepared By: Eng. Adham Maher Abu Shamla Under Supervision: Dr. Basil Hamed Experiments