Delivering 5000 Desktops with Citrix XenDesktop
|
|
|
- Linette Sutton
- 6 years ago
- Views:
Transcription


1 Delivering 5 Desktops with Citrix XenDesktop Validation Report and Recommendations for a Scalable VDI Deployment using Citrix XenDesktop and Provisioning Services, NetApp Storage and VMWare Server Virtualization
2 TABLE OF CONTENTS INTRODUCTION... 3 CITRIX XENDESKTOP OVERVIEW... 3 EXECUTIVE SUMMARY... 4 Key Findings... 5 METHODOLOGY AND WORKLOAD... 5 Workload Details LoginVSI from Login Consultants... 5 Component Scalability Results... 6 XENDESKTOP DESKTOP DELIVERY CONTROLLER (DDC)... 7 SINGLE SERVER SCALABILITY... 8 PROVISIONING SERVICES SCALABILITY... 9 FINDINGS... 1 The Desktop and Desired User Experience... 1 Citrix XenDesktop Desktop Delivery Controller... 1 Storage Recommendations Server Hardware Findings Server Virtualization Findings Additional Implications for Scalability Design LARGE SCALE TEST RESULTS Test Details Summary of Large Scale Test Results Session Performance and Session Start up Times Desktop Delivery Controller and Provisioning Services Performance DESKTOP DELIVERY CONTROLLER PERFORMANCE CITRIX PROVISIONING SERVICES (PVS) PERFORMANCE NetApp Storage Performance VMWare Virtual Center and ESX Performance ESX PERFORMANCE SUMMARY APPENDIX A BLADE SERVER HARDWARE AND DEPLOYMENT APPENDIX B NETWORK DIAGRAM REFERENCES
3 Introduction This document is intended to provide advanced technical personnel - architects, engineers and consultants with data to assist in the planning, design and deployment of a Citrix XenDesktop hosted VM-based (VDI) solution that scales to 5 desktops. This document presents the findings of internal Citrix testing that simulates a large enterprise deployment of VDI desktops. This document provides data generated from a sample deployment, in which a single OS image is provisioned to 5, unique desktop users. This document is not intended to provide definitive guidance on scalability, and the data should be interpreted and adapted for your specific environment s. To help you understand the data, some examples of possible recommendations are made throughout the document to adjust to different scenarios. The information gathered from this testing is part of a comprehensive and constantly growingguidebook to scalability. Please reference the XenDesktop Scalability Guidelines at for an understanding how to scale in building blocks to many tens of thousands of desktops. Citrix XenDesktop Overview IT organizations today are looking for new ways to address their desktop challenges, whether it be rapid provisioning, Windows 7 migrations, security, patching and updating, or remote access. They are exploring solutions for current business initiatives, such as outsourcing, compliance and globalization. Many are interested in bring your own computer policies, to enable IT to get out of the business of managing hardware and focus on the core software and intellectual property that is central to the line of business. Citrix XenDesktop offers the most powerful and flexible desktop virtualization solution available on the market, enabling organizations to start delivering desktops as a service to users on any device, anywhere. With FlexCast delivery technology, XenDesktop can match the virtual desktop model to the performance, security, flexibility and cost requirements of each group of users across the enterprise. This document focuses on the scalability and test results of one of the six FlexCast delivery models: hosted VM-based desktops, or VDI. 3


4 Executive Summary Citrix internally tested a sample VDI deployment designed for high-availability and simulated real-world workloads using XenDesktop 4. The end-to-end environment included more than 33 Windows XP virtual desktops. In addition, key components were individually tested to determine their ability to support more than 5 desktops. Combining the complete system results with the individual component tests enabled Citrix to extrapolate results to support a single virtual desktop infrastructure design that can deliver at least 5 desktops. The full VDI infrastructure was built using the following components: o Desktop Delivery Controller for brokering, remoting and managing the virtual desktop o Citrix Provisioning Services for OS provisioning o NetApp centralized storage for storing user profiles, write cache and relevant databases o HP Blade servers for hosting the VMs o VMWare ESX and vcenter as the server virtualization infrastructure o Cisco datacenter network switches 4
5 Key Findings o Workloads and Boot or Logon Storms (from rapid concurrent or simultaneous user logons) have the largest impact to how you scale and size this VDI design o Desktop Delivery Controllers can be virtualized and have roles divided amongst them for best scalability and resiliency o Citrix Provisioning Services, with the release of 5.1 SP2, has demonstrated unparalleled scale (with over 3 users per physical server) and reliability in this VDI deployment. o Virtual Machine density will vary with OS, workload and of course server hardware Methodology and Workload Testing was done in two phases - individual component scalability and full-system scalability. Central to both phases of testing is the use of a tool that simulates real-world workloads, as well as an internally built tool to measure session startup times (providing expected user logon times). Workload Details LoginVSI from Login Consultants One of the most critical factors of designing a scalable VDI deployment is understanding the true user workflow and planning adequately in terms of server and storage capacity, while setting a standard for the user experience throughout. To accurately represent a real-world user workflow, the third-party tools from Login Consultants were used throughout the full system testing. These tools also take measures of in-session response time, providing a way to measure the expected user experience in accessing their desktop throughout large scale testing, including login storms. The widely available workload simulation tool, LoginVSI 1.x, was also coupled with the use of the idle pool (feature in XenDesktop) to spin up sessions, simulating a scenario of all users coming in to work at the same time and logging on. (Login VSI is freeware and can be downloaded from Login VSI is a benchmarking methodology that calculates an index based on the amount of simultaneous sessions that can be run on a single machine. The objective is to find the point at which 5
6 the number of sessions generates too much load that end user experience would be noticeably e degraded. Login VSI simulates a medium-heavy workload user (intensive knowledge worker) running generic applications like: Microsoft Office 27, Internet Explorer including Flash applets and Adobe Acrobat Reader (Note: For the purposes of this test, applications were installed locally, not streamed or hosted). Like real users, the scripted session will leave multiple applications open at the same time. Every session will average about 2% minimal user activity, similar to real world usage. Note that during each 18 minute loop users open and close files a couple of time per minutes which is probably more intensive that most users. Each loop will open and use: Outlook 27, browse 1 messages & type new message. Internet Explorer, one instance is left open, one instance is browsed to Microsoft.com, VMware.com and Citrix.com (locally cached copies of these websites). Word 27, one instance to measure response time (9 times), one instance to review, edit and print a random document. Solidata PDF writer & Acrobat Reader, the word document is printed to PDF and reviewed. Excel 27, a very large randomized sheet is opened and edited. PowerPoint 27, a random presentation is reviewed and edited. 3 Breaks (4, 2 & 4 seconds) are included to emulate real world usage. Component Scalability Results The following components were tested for individual scalability: Desktop Delivery Controller (DDC) VMWare ESX Server on blade servers Provisioning Services (note this testing was done as part of full-scale system tests) 6

7 XenDesktop Desktop Delivery Controller (DDC) The DDCs were virtualized on ESX server and some of the roles of the DDC were assigned to specific DDCs, an approach often taken in Citrix XenApp deployments. The DDCs were configured such that: DDC 1: Farm Master and Pool Management DDC 2 & 3: VDA Registrations and XML Brokering In this environment, 3 DDCs (4vCPU, 4GB RAM) were shown to be able to sustain a farm size of 6 desktops and proved stable handling over 12k logons from a pool of 565 users. It was necessary to have multiple Virtual Center instances to support this scale; each VC instance required a new XenDesktop desktop group. In the testing 5 VCs were used with the following distribution: 2 x 2 Desktops 2 x 7 Desktop 1 x 6 Desktops The stability of the deployment was validated using the following method: All VMs were powered on using Idle Pool Management. This feature of XenDesktop allows the environment to be automatically brought up in a controlled manner in advance of peak user activity. 7
8 An initial logon storm was created by logging users on at a rate of ~3 per second. Followed by a steady load as users logged off, rebooted and VDAs re-registered. Single Server Scalability The Single Server Scalability tests are focused on determining the number of Virtual Desktops a given target machine can support. There are many permutations of tests that could be performed to evaluate specific features or architectures. As this testing is a precursor to more comprehensive scalability tests and guidelines, exploring a broad set of configurations was not within the scope of the project. The methodology used is based on Project Virtual Reality Check (Project VRC: project VRC was collaboration between two Consulting companies (Login Consultants and PQR) with the objective of measuring hypervisor scalability using Login VSI 1.. The key differences are between the testing methodology used at Citrix and that of Project VRC are: Provisioning Services was included and enables Pooled XP Desktops running from a single common vdisk. Some changes were made to the session logon scripts to prevent unnecessary file copy operations that would impact the PVS Write Cache; this operation was intended for XenApp environments. Connections are brokered via the XenDesktop DDC, not direct connections. The XP Virtual Desktops have been allocated 512MB RAM, compared to 1GB in the case of ProjectVRC. Roaming users have been used instead of local profiles, as this would be representative of a VDI deployment. Each of the hardware platforms tested were intended to show scalability in memory and CPU bound conditions along with cases where the environment was rich in memory and CPU resources. VM Density used in Large Scale Testing The following specifications were used. o Windows XP pooled desktops o 1vCPU and 512MB RAM. o 1.5 GB PVS Cache on NFS (NetApp 317HA) o HP BL46c Dual Quad Core (1.86GHz L532) 16GiB RAM o HP BL46c Dual Quad Core (2.5GHz L542) 32GB RAM o ESX 3.5 Update 4 o VMs/Host o VMs/Core o 28 o 3.5 o 5 o
9 Note that at smaller scale, slightly higher single server density was possible, however at large scale we noticed some degradation of performance. Testing showed that with 34 desktops on the BL46c 16GB blade that ballooning was occurring and was unable to free enough memory. This caused the ESX host to start to swap the guest memory to the storage tier. This impacted the end user experience as pages the guest believed to be in memory were actually on disk, causing an increase in latency for accessing those pages. A reduction in the number of guests per host removed the swapping behavior and removed the impact on the end user experience that was seen when the environment was being scaled out. Testing with 32GB RAM, 52 desktops were possible though the system was close to becoming CPU bound. To avoid the risk of impacting user experience, we slightly reduced density used in the large-scale tests. Provisioning Services Scalability The scalability of Provisioning Services builds on the results from the SSS testing. As we increased the number of desktops being streamed from PVS, we monitored the Login VSI score and the logon time to ensure that the end user experience remained acceptable. Standard Perfmon metrics were also captured to understand the characteristics of PVS and streaming pooled desktops. As the full-system scalability testing was conducted and users added to the maximum capacity of the hardware, it was observed that ONE physical Provisioning Server could easily support the 33 desktops. This is a significant improvement from earlier testing of previous versions of the technology. 9
10 Findings To build a 5 VDI desktop deployment, the findings of this round of testing indicates some new guidance in our overall approach to scalability, to be captured in a comprehensive scalability guide in the near future: The Desktop and Desired User Experience Ensuring proper design of a large-scale VDI deployment requires that you have a good understanding of how the users on average will be using their desktops and applications. The two critical elements are login storms and the in-session workload. The test environment is capable of supporting a login storm of 5 desktops based on test data. LoginVSI workload was for a medium type of user as described in the Methodology section. If the user workload varies greatly on average from the one described in this design, then you need to model the workload on at least a single-server basis to gain approximations for sizing servers and storage components differently. Citrix XenDesktop Desktop Delivery Controller XenDesktop Desktop Delivery Controller configuration was an enterprise installation with the following adjustments to allow distribution of roles to 3 virtualized brokers: Farm master (DDC1) Registry configured so that the DDC rejects VDA registrations. Pool Management throttling was configured at 4 desktops, overriding the default of 1% of the pool size (~16-17 desktops depending on the group. Configured as the preferred Farm Master. VDA registration and XML brokering (DDC2 and DDC3) The above pool management configuration change was made in case pool management failed over to a different VDA. This configuration was tested to support 5 sessions. 1

11 Storage Recommendations For a large VDI deployment, a scalable storage solution is a cost-effective and reliable solution. The NetApp FAS317HA was used with 2 controllers, 7 x 3GB drives for storage and PAMII cards. The PAM II modules in the NetApp FAS317HA filer did not offer any gains as the workload on the storage was write focused. For this version of XenDesktop and VDI design, the PAM II cards are not required and would be not recommended Otherwise, this particular configuration of NetApp is recommended as designed here for 5 users, with the assumption that there will be some potential degradation in a complete failover situation (where one NetApp controller fails complete or similar failure). To tune the NetApp sizing for your particular failover/recovery needs, it s recommended to work with a NetApp sales engineer. The FAS317 was running OnTap version with PAMII cards enabled. One aggregate per controller with multiple volumes created on each aggregate per the layout shown below. 11
12 Server Hardware Findings For hosting the actual virtual desktops, a blade server configuration is recommended. In this design, approximately 5 VMs/host was achieved using the following: HP BL46 2 x 1.86Ghz Intel Xeon L532 Quad Core (8MiB L2 Cache 166Mhz Bus) 1 x 36GB HDD SAS 1K rpm 16 GB RAM 667Mhz Dual Broadcom 1Gb NICs QLogic QMH2462 Dual Port Fibre Channel HBA HP BL46c 2 x 2.5Ghz Intel Xeon L542 Quad Core (12MiB L2 Cache 1333Mhz Bus) 1 x 72GB HDD SAS 1K rpm 32 GB RAM 667Mhz Dual Broadcom 1Gb NICs QLogic QMH2462 Dual Port Fibre Channel HBA Using similar hardware configuration but with newer updated Intel Nehalem processors (55xx series) and memory configurations 64-96GB should provide significantly increased VM density. For Provisioning Services, dedicated servers were used and over-specified for this design of 5 desktops. An HP BL68 was used: Citrix PVS Server camb5e1b2 OS: Windows 28 64bit Service Pack: 1 Make: HP Model: BL68 CPU: 4 x Intel E GHz RAM: 64GiB Disk: 2 x 72GB 1k SAS Network: 8 x 1GbE Provisioning Services 5.1 SP2 From the test data, this server was highly underutilized. The 24 core server is clearly over specified. With a peak of < 3%, this would equate to 7.2 cores. A dual quad core server would expect to be able to handle this load, though may be too close to the maximum utilization; hence instead of two 24 core servers, three 8 core servers would be sufficient. 12
13 Server Virtualization Findings In our testing, two desktop groups were configured, pointing at two different VMWare Virtual Center servers. Virtual Center 1 would run 164 desktop sessions on 32 blades. Virtual Center 2 would run 178 desktop sessions on 61 blades. Based on VMware best practice for the software versions used (VMWare ESX 3.5 Update 4) and published maximums (2 VMs per Virtual Center) the environment had to be split over 2 Virtual Center instances. Since then, VMWare has released version 4. that has higher limits than the 2 VMs tested in version 3.5 (note that in version 4, the limit is respectively 3 and 45 for 32bit and 64bit guests). In general, the recommendation would be to have the least number of Virtual Centers configured. No changes were made or recommended from a standard installation. Servers were placed into logical clusters, with one cluster matching one blade enclosure. VMware ESX 3.5. build was used on all ESX hosts in the environment. Each host is configured with a single virtual switch with both vmnic and vmnic1 connected. The VM Network is configured with vmnic as active and vmnic1 as standby. o This is used for ICA, PVS and general network traffic The Service Console is not specifically bound to a specific vmic VMotion is configured with vmnic1 as active and vmnic as standby o This is used for NFS and VMotion traffic 13
14 Service Console was allocated 8MiB. NFS configuration changes were made as per current NetApp guidance in the NetApp Technical Report TR-3428 NTP was configured to sync time. ESX hosts were installed with the latest HP ESX utilities for monitoring hardware. Due to interrupt sharing issues between the vmkernel and the service console USB was disabled in the BIOS. See VMWare KB article Note that while the BIOS disabled USB, USB was still available from the ilo so remote keyboard access was still available. Additional Implications for Scalability Design Don t place the PVS vdisk on a CIFS share. o Windows does not cache files from file shares in memory, thus each time a call is made to the PVS server to it in turn has to reach out to the shared storage. Ensure VMware Virtual Center hasn t set a resource limit on your Virtual Machine o When we moved from the DDC testing which used 256MiB guests to the large-scale test we increased the VM memory back to 512MiB however for some reason a limit was placed on the memory resources available to the guest of 256MiB. This resulted in a VM which appeared to have 512MiB RAM but was limited to only using 256MiB of physical RAM and the rest was held in the VMware swap file, leading to huge increase in our storage IO to the SAN which crippled the large scale environment down to less than 1 desktops. Check: Virtual Machine Properties -> Resources -> Memory -> Limit: Don t place too many Virtual Machines on VMFS volumes o Not applicable to the NFS implementation, but seen with SSS testing using local VMFS volumes and also FC attached VMFS volumes. Impact was most noticeable on user logon time with it quickly increasing with more than 4 active VMs on a single VMFS volume. Splitting this on to multiple volumes on the same number of disks alleviated the problem..net 3.5 SP1 (+ later windows updates) is necessary to improve scalability of the DDC 14
15 o Without this update applied we would see VDAs deregister as users began to login to the system. This was seen with ~15 desktops and higher. The Microsoft fixes to.net addressed the problem and allowed testing to achieve ~6 desktops. By default Pool Management will attempt to start 1% of the total pool size. In a large environment this may be more than Virtual Center can cope with. o The number of concurrent requests can be throttled by editing the Pool Management Service configuration file: o C:\Program Files\Citrix\VMManagement\CdsPoolMgr.exe.config o Modify the <appsetting> section by adding the line: o <add key="maximumtransitionrate" value="2"/> o The Pool Management service needs to be restarted to read the new configuration. o If VMware DRS is being used a lower value should be set as DRS needs additional time to determine guest placement before powering it on. In our testing with DRS enabled the rate of 2 was used. o In our testing we allowed DRS to do the initial VM placement through a full run, DRS was then disabled and this allowed the MaxiumumTransisionRate to be increased to 4 without VC becoming overloaded. Details on assigning the farm master roles can be found in CTX Note that the XenDesktop PowerShell SDK can also be used to configure the preferred farm master. To stop the farm master handling connections, see the MaxWorkers registry key in CTX PVS NIC teaming can simplify the deployment of the PVS server. o NIC teaming also improves the reliability, as one PVS server has one IP address, if a network connection fails, the remaining connections take over the load and the PVS server continues to operate on its current IP. This is especially useful for failover and HA as only one IP address needs to be specified for the login server per host. This also allows the network layer to handle the load balancing of client connections over the available NICs. 15
16 Large Scale Test Results Test Details The test run of 3312 desktops comprised of an idle pool spin up with the following details: o All sessions launched within approximately 6 minutes. o Individual logon times tracked to ensure logon performance did not degrade significantly. o All running the Login VSI 1.1 workload and their response times logged. o At the end of the VSI workload phase the users would logout. This triggers Pool Management to shutdown then restart the desktop. o PVS HA testing to ensure all desktops would continue to run in the event of a PVS server failure. o Use the various product management consoles during the test to ensure they remain responsive to general admin tasks. Environment: Two desktop groups, pointing at two different Virtual Center servers. o Virtual Center 1 ran 164 desktop sessions on 32 blades. o Virtual Center 2 ran 178 desktop sessions on 61 blades. o Based on VMware best practice and published maximums the environment had to be split over 2 Virtual Center instances. Within the Virtual Center individual clusters are created for each blade chassis (of up to 16 blade servers). o Virtual Center 1 has clusters for two chassis of the more powerful blade servers. Virtual Center 2 hosts clusters for the other four chassis of blades. 16

17 Summary of Large Scale Test Results Powering on all 3312 desktops ready for users to login took less than 6 minutes using XenDesktop Idle Pool Management capability. Using a launch rate of 17/minute, 99% of users logged on in 31 minutes. PVS was shown to be able to run 3312 desktops from a HA pair of servers. In a separate test one of the PVS servers was shutdown triggering a HA failover. The ~16 sessions transferred to the other server within 8 minutes. The scalability of the environment was verified through analysis of the logon times, Login VSI test response times and performance metrics gathered from all the major components. The perfmon data confirms that a number of the servers were oversized and could easily handle more load than was placed on them in this test. It took on average 19 seconds from launching the ICA file to having a fully running desktop. Login VSI response times indicate the system remained at an acceptable performance level for all users during the test. Session Performance and Session Start up Times LoginVSI results illustrate the capture of response time against the count of sessions launched. You can observe that the max response time increases nominally as session count increases, but that overall, average response times stay within the 2ms for the duration. 17
18 Max Response_Time Min Response_Time Average Response_Time Response time (ms) Active Sessions o Total Sessions Launched o 3312 o Uncorrected Optimal Performance Index (UOPI) o 3312 o Stuck Session Count before UOPI (SSC) o o Lost Session Count before UOPI (LSC) o 44 o Corrected Optimal Performance Index (COPI = UOPI (SSC*5%) LSC) o 3268 Session start-up time is a measure of the time taken from starting the ICA client on the client launcher, having received the ICA file from a successful XML brokering request, to the session loading and the STAT mini agent (a.net application loaded by the windows start-up folder) loading. This method of calculating start-up time is the closest approximation to true user logon time in such a test environment Logon times can be seen to fit mostly in band between seconds though with some stray sessions taking close to 4 seconds near the end of the logon storm and the earlier users and part way through their first workload run. 18
19 Min Max Average 11 secs 39 secs 19 seconds Desktop Delivery Controller and Provisioning Services Performance Where available, the data is presented for the environment during the spin up phase, which is controlled via XenDesktop Idle Pool Management and during the test run; where the Login VSI 1.x workload is run in all the sessions until all desktops have run the full set of scripts at least once, then a file is dropped on a network share which triggers the Login VSI scripts to initiate a logoff when they next complete a full run of the scripts. As the desktops were configured to reboot on logoff, additional load is placed on the systems when users begin to logoff and then idle pool management powers them back on again. Standard Microsoft Windows perfmon counters were used to collect the following performance metrics. Desktop Delivery Controller Performance 19
20 As mentioned previously, 3 DDCs were used in this test with specific roles assigned. All are running as Virtual Machines on a separate ESX server to the desktop VMs. Configured with 4vCPU and 4GB RAM, running on a HP BL46c with 2 x 1.8 GHz Quad Core L532 CPU and 16 GB RAM. DDC1: Farm Master + Pool Management Pool Spin Up % Processor Time: _Total (4vCPU) During Test Run :1:54 13:14:48 13:18:43 13:22:38 13:26:33 13:3:27 13:34:21 13:38:15 13:42:9 13:46:3 13:49:57 13:53:51 13:57:45 14:1:39 14:5:33 14:9:27 14:13:21 14:17:15 14:21:9 14:25:3 14:28:57 15:15:45 15:2:8 15:24:31 15:28:54 15:33:17 15:37:4 15:42:3 15:46:26 15:5:49 15:55:11 15:59:33 16:3:56 16:8:18 16:12:41 16:17:3 16:21:26 16:25:49 16:3:12 16:34:35 16:38:59 XenDesktop Services % Processor Time :1:54 13:14:55 13:18:58 13:23: 13:27:1 13:31:2 13:35:3 13:39:4 13:43:6 13:47:7 13:51:8 13:55:9 13:59:1 14:3:11 14:7:13 14:11:14 14:15:15 14:19:16 14:23:17 14:27:18 15:15:59 15:2:36 15:25:14 15:29:51 15:34:28 15:39:5 15:43:43 15:48:19 15:52:56 15:57:33 16:2:9 16:6:46 16:11:23 16:15:59 16:2:36 16:25:13 16:29:5 16:34:28 16:39:6 Process % Processor Time CdsPoolMgr Process % Processor Time CdsImaProxy Process % Processor Time CdsController Process % Processor Time CitrixManagementServer Process % Processor Time ImaSrv Process % Processor Time CdsPoolMgr Process % Processor Time CdsImaProxy Process % Processor Time CdsController Process % Processor Time CitrixManagementServer Process % Processor Time ImaSrv The main item to note is that during pool spin up the high usage process is the CdsPoolMgr process. This is expected is it drives Virtual Center to start the guests up. The two peaks of the IMA service during Pool Spin up are caused by the UI taking the two desktop groups out of Maintenance Mode. During the test run itself IMASrv is responsible for brokering all the desktops, and so the zone master takes the most load while making 2
21 the decision on desktop assignment. In the later stage of the run desktops are starting to logoff and so the Pool Management Service is starting to shutdown and restart the desktops. 21
22 Memory Committed Megabytes 4, 4, 3,5 3,5 3, 3, 2,5 2,5 MiB 2, MiB 2, 1,5 1,5 1, 1, :1:54 13:15:23 13:19:55 13:24:25 13:28:55 13:33:24 13:37:54 13:42:23 13:46:53 13:51:22 13:55:52 14::21 14:4:51 14:9:2 14:13:5 14:18:19 14:22:49 14:27:18 15:16:27 15:21:33 15:26:39 15:31:45 15:36:5 15:41:56 15:47:1 15:52:7 15:57:12 16:2:16 16:7:21 16:12:27 16:17:32 16:22:37 16:27:42 16:32:48 16:37:55 The memory usage on this DDC grows significantly towards the end of the run as users log off. This will trigger the tainting detection code to shutdown the VM. Once shutdown pool management will power it back on again. Further investigation is required to better understand the dramatic memory increase at the end of the test. It s suspected that given enough time garbage collection would correct the spike. PhysicalDisk -- % Idle Time -- _Total :1:54 13:14:55 13:18:58 13:23: 13:27:1 13:31:2 13:35:3 13:39:4 13:43:6 13:47:7 13:51:8 13:55:9 13:59:1 14:3:11 14:7:13 14:11:14 14:15:15 14:19:16 14:23:17 14:27:18 15:15:59 15:2:36 15:25:14 15:29:51 15:34:28 15:39:5 15:43:43 15:48:19 15:52:56 15:57:33 16:2:9 16:6:46 16:11:23 16:15:59 16:2:36 16:25:13 16:29:5 16:34:28 16:39:6 Context Switches (per second) :1:54 13:15:9 13:19:27 13:23:42 13:27:58 13:32:13 13:36:28 13:4:44 13:44:59 13:49:15 13:53:3 13:57:45 14:2: 14:6:16 14:1:31 14:14:46 14:19:2 14:23:17 14:27:32 15:16:13 15:21:5 15:25:56 15:3:48 15:35:39 15:4:31 15:45:22 15:5:13 15:55:4 15:59:55 16:4:45 16:9:36 16:14:27 16:19:18 16:24:9 16:29:1 16:33:53 16:38:45 22
23 Network Utilisation (Mbps) Mbps 2.5 Mbps :1:54 13:15:23 13:19:55 13:24:25 13:28:55 13:33:24 13:37:54 13:42:23 13:46:53 13:51:22 13:55:52 14::21 14:4:51 14:9:2 14:13:5 14:18:19 14:22:49 14:27:18 15:16:27 15:21:33 15:26:39 15:31:45 15:36:5 15:41:56 15:47:1 15:52:7 15:57:12 16:2:16 16:7:21 16:12:27 16:17:32 16:22:37 16:27:42 16:32:48 16:37:55 Mbps Received Mbps Sent Mbps Received Mbps Sent The spikes in network traffic at the end of the test correspond to the desktops being shutdown and restarted by the pool management service. This traffic is between the DDC and the Virtual Center servers, as can be seen by the corresponding increase on traffic on both VC at this time. 23
24 DDC2: XML + VDA registration Pool Spin Up % Processor Time: _Total (4vCPU) During Test Run :1:53 13:14:47 13:18:41 13:22:34 13:26:28 13:3:22 13:34:15 13:38:9 13:42:3 13:45:56 13:49:5 13:53:44 13:57:38 14:1:31 14:5:25 14:9:19 14:13:12 14:17:6 14:2:59 14:24:53 14:28:47 15:15:44 15:2:7 15:24:3 15:28:53 15:33:16 15:37:38 15:42:1 15:46:23 15:5:46 15:55:8 15:59:3 16:3:52 16:8:14 16:12:36 16:16:58 16:21:2 16:25:42 16:3:4 16:34:26 16:38:48 XenDesktop Services % Processor Time :1:53 13:14:54 13:18:55 13:22:56 13:26:56 13:3:57 13:34:58 13:38:58 13:42:59 13:47: 13:51:1 13:55:2 13:59:3 14:3:3 14:7:4 14:11:5 14:15:5 14:19:6 14:23:7 14:27:8 15:15:59 15:2:36 15:25:13 15:29:5 15:34:27 15:39:3 15:43:41 15:48:17 15:52:53 15:57:29 16:2:5 16:6:42 16:11:18 16:15:54 16:2:3 16:25:6 16:29:43 16:34:19 16:38:56 Process % Processor Time CdsPoolMgr Process % Processor Time CdsImaProxy Process % Processor Time CdsController Process % Processor Time CitrixManagementServer Process % Processor Time ImaSrv Process % Processor Time CdsPoolMgr Process % Processor Time CdsImaProxy Process % Processor Time CdsController Process % Processor Time CitrixManagementServer Process % Processor Time ImaSrv In contrast to DDC1 the load is noticeably lower. The main active process is the CdsController which handles communication with the VDA including heartbeats and initial registration. 24
25 Memory Committed Megabytes 4, 4, 3,5 3,5 3, 3, 2,5 2,5 MiB 2, MiB 2, 1,5 1,5 1, 1, :1:53 13:15:22 13:19:52 13:24:2 13:28:49 13:33:19 13:37:48 13:42:17 13:46:46 13:51:15 13:55:44 14::13 14:4:43 14:9:11 14:13:4 14:18:9 14:22:38 14:27:8 15:16:27 15:21:33 15:26:38 15:31:43 15:36:49 15:41:54 15:46:59 15:52:3 15:57:8 16:2:12 16:7:17 16:12:21 16:17:26 16:22:31 16:27:35 16:32:4 16:37:45 PhysicalDisk -- % Idle Time -- _Total :1:53 13:14:54 13:18:55 13:22:56 13:26:56 13:3:57 13:34:58 13:38:58 13:42:59 13:47: 13:51:1 13:55:2 13:59:3 14:3:3 14:7:4 14:11:5 14:15:5 14:19:6 14:23:7 14:27:8 15:15:59 15:2:36 15:25:13 15:29:5 15:34:27 15:39:3 15:43:41 15:48:17 15:52:53 15:57:29 16:2:5 16:6:42 16:11:18 16:15:54 16:2:3 16:25:6 16:29:43 16:34:19 16:38:56 Due to some previous memory leak tracing for the IMA Service, user mode stack trace database was being created for the imasrv.exe. This extra tracing was causing the higher than normal disk utilization, showing a steady baseline of 2% utilisation. Context Switches (per second) :1:53 13:15:8 13:19:23 13:23:38 13:27:53 13:32:8 13:36:23 13:4:38 13:44:52 13:49:8 13:53:22 13:57:38 14:1:53 14:6:7 14:1:22 14:14:37 14:18:52 14:23:7 14:27:22 15:16:13 15:21:4 15:25:55 15:3:47 15:35:38 15:4:29 15:45:2 15:5:1 15:55: 15:59:51 16:4:41 16:9:31 16:14:22 16:19:12 16:24:3 16:28:53 16:33:44 16:38:34 Network Utilisation (Mbps) 25

26 Mbps 2.5 Mbps :1:53 13:15:22 13:19:52 13:24:2 13:28:49 13:33:19 13:37:48 13:42:17 13:46:46 13:51:15 13:55:44 14::13 14:4:43 14:9:11 14:13:4 14:18:9 14:22:38 14:27:8 15:16:27 15:21:33 15:26:38 15:31:43 15:36:49 15:41:54 15:46:59 15:52:3 15:57:8 16:2:12 16:7:17 16:12:21 16:17:26 16:22:31 16:27:35 16:32:4 16:37:45 Mbps Received Mbps Sent Mbps Received Mbps Sent DDC3: XML + VDA registration Pool Spin Up % Processor Time: _Total (4vCPU) During Test Run :1:54 13:14:47 13:18:42 13:22:35 13:26:29 13:3:22 13:34:16 13:38:1 13:42:3 13:45:57 13:49:51 13:53:44 13:57:38 14:1:32 14:5:26 14:9:19 14:13:13 14:17:6 14:21: 14:24:53 14:28:47 15:15:44 15:2:6 15:24:29 15:28:51 15:33:13 15:37:36 15:41:58 15:46:21 15:5:42 15:55:4 15:59:26 16:3:48 16:8:1 16:12:32 16:16:54 16:21:16 16:25:38 16:3: 16:34:22 16:38:45 26
27 XenDesktop Services % Processor Time :1:54 13:14:55 13:18:56 13:22:56 13:26:57 13:3:58 13:34:59 13:38:59 13:43: 13:47:1 13:51:2 13:55:2 13:59:3 14:3:4 14:7:5 14:11:5 14:15:6 14:19:6 14:23:7 14:27:8 15:15:58 15:2:35 15:25:11 15:29:48 15:34:24 15:39:1 15:43:38 15:48:14 15:52:5 15:57:26 16:2:2 16:6:38 16:11:14 16:15:5 16:2:26 16:25:3 16:29:39 16:34:15 16:38:52 Process % Processor Time CdsPoolMgr Process % Processor Time CdsImaProxy Process % Processor Time CdsController Process % Processor Time CitrixManagementServer Process % Processor Time ImaSrv Process % Processor Time CdsPoolMgr Process % Processor Time CdsImaProxy Process % Processor Time CdsController Process % Processor Time CitrixManagementServer Process % Processor Time ImaSrv The load profile is as expected similar to DDC2. In contrast to DDC1 the load is noticeably lower. The main active process is the CdsController which handles communication with the VDA including heartbeats and initial registration. Memory Committed Megabytes 4, 4, 3,5 3,5 3, 3, 2,5 2,5 MiB 2, MiB 2, 1,5 1, 5 13:1:54 13:15:23 13:19:52 13:24:21 13:28:5 13:33:19 13:37:49 13:42:18 13:46:47 13:51:16 13:55:45 14::14 14:4:43 14:9:12 14:13:41 14:18:1 14:22:39 14:27:8 1,5 1, 5 15:16:26 15:21:31 15:26:36 15:31:41 15:36:46 15:41:51 15:46:56 15:52: 15:57:5 16:2:9 16:7:14 16:12:18 16:17:22 16:22:27 16:27:31 16:32:36 16:37:41 27

28 28 PhysicalDisk -- % Idle Time -- _Total Context Switches (per second) :1:54 13:14:55 13:18:56 13:22:56 13:26:57 13:3:58 13:34:59 13:38:59 13:43: 13:47:1 13:51:2 13:55:2 13:59:3 14:3:4 14:7:5 14:11:5 14:15:6 14:19:6 14:23:7 14:27: :15:58 15:2:35 15:25:11 15:29:48 15:34:24 15:39:1 15:43:38 15:48:14 15:52:5 15:57:26 16:2:2 16:6:38 16:11:14 16:15:5 16:2:26 16:25:3 16:29:39 16:34:15 16:38: :1:54 13:15:9 13:19:24 13:23:39 13:27:54 13:32:9 13:36:24 13:4:38 13:44:53 13:49:8 13:53:23 13:57:38 14:1:53 14:6:8 14:1:23 14:14:37 14:18:52 14:23:7 14:27: :16:12 15:21:3 15:25:54 15:3:44 15:35:35 15:4:26 15:45:17 15:5:7 15:54:57 15:59:48 16:4:38 16:9:28 16:14:18 16:19:9 16:23:59 16:28:49 16:33:4 16:38:31
29 Network Utilisation (Mbps) Mbps :1:54 13:15:23 13:19:52 13:24:21 13:28:5 13:33:19 13:37:49 13:42:18 13:46:47 13:51:16 13:55:45 14::14 14:4:43 14:9:12 14:13:41 14:18:1 14:22:39 14:27:8 Mbps :16:26 15:21:31 15:26:36 15:31:41 15:36:46 15:41:51 15:46:56 15:52: 15:57:5 16:2:9 16:7:14 16:12:18 16:17:22 16:22:27 16:27:31 16:32:36 16:37:41 Mbps Received Mbps Sent Mbps Received Mbps Sent Citrix Provisioning Services (PVS) Performance There are 2 PVS servers handling the 3312 desktops in the environment. The processor and memory configuration for these servers can clearly be seen to significantly over-specified. The servers 8 gigabit NICs were configured as NIC team, the blade chassis had 4x1GbE uplink to the core switch. The PVS servers are each running on BL68c blades with 4 x E GHz hex core CPUs, with 64GB RAM. 29
30 PVS Server Pool Spin Up During Test Run % Processor Time: _Total (4 x 6 Core CPUs) :1:53 13:16:39 13:22:26 13:28:13 13:34: 13:39:48 13:45:35 13:51:22 13:57:9 14:2:56 14:8:43 14:14:3 14:2:16 14:26:3 14:31:49 14:37:36 14:43:23 14:49:9 14:54:56 15::43 15:15:58 15:2:34 15:25:1 15:29:47 15:34:23 15:39: 15:43:36 15:48:12 15:52:48 15:57:25 16:2:1 16:6:37 16:11:13 16:15:49 16:2:25 16:25:1 16:29:37 16:34:14 16:38:5 Memory Committed Megabytes MiB 6, 5,9 5,8 5,7 5,6 5,5 5,4 5,3 5,2 5,1 5, MiB 6, 5,9 5,8 5,7 5,6 5,5 5,4 5,3 5,2 5,1 5, 13:1:53 13:17:22 13:23:51 13:3:21 13:36:5 13:43:2 13:49:5 13:56:19 14:2:49 14:9:18 14:15:47 14:22:16 14:28:46 14:35:15 14:41:44 14:48:13 14:54:42 15:1:11 15:16:26 15:21:31 15:26:35 15:31:4 15:36:45 15:41:5 15:46:54 15:51:59 15:57:3 16:2:8 16:7:12 16:12:16 16:17:21 16:22:25 16:27:3 16:32:34 16:37:39 3
31 PhysicalDisk -- % Idle Time -- _Total :1:53 13:16:39 13:22:26 13:28:13 13:34: 13:39:48 13:45:35 13:51:22 13:57:9 14:2:56 14:8:43 14:14:3 14:2:16 14:26:3 14:31:49 14:37:36 14:43:23 14:49:9 14:54:56 15::43 15:15:58 15:2:34 15:25:1 15:29:47 15:34:23 15:39: 15:43:36 15:48:12 15:52:48 15:57:25 16:2:1 16:6:37 16:11:13 16:15:49 16:2:25 16:25:1 16:29:37 16:34:14 16:38:5 Network Utilisation (Mbps) (8 Teamed 1GbE NICs) Mbps 2 15 Mbps :1:53 13:17:22 13:23:51 13:3:21 13:36:5 13:43:2 13:49:5 13:56:19 14:2:49 14:9:18 14:15:47 14:22:16 14:28:46 14:35:15 14:41:44 14:48:13 14:54:42 15:1:11 Mbps Received Mbps Sent 15:16:26 15:21:31 15:26:35 15:31:4 15:36:45 15:41:5 15:46:54 15:51:59 15:57:3 16:2:8 16:7:12 16:12:16 16:17:21 16:22:25 16:27:3 16:32:34 16:37:39 Mbps Received Mbps Sent Peak traffic occurs during the user logon phase of the test run with a peak close to 2.3Gbps. 31
32 PVS Server Pool Spin Up During Test Run % Processor Time: _Total (4 x 6 Core CPUs) :1:53 13:16:39 13:22:26 13:28:14 13:34:1 13:39:48 13:45:35 13:51:22 13:57:9 14:2:56 14:8:43 14:14:29 14:2:16 14:26:3 14:31:49 14:37:36 14:43:22 14:49:9 14:54:55 15::42 15:15:58 15:2:34 15:25:11 15:29:47 15:34:23 15:39: 15:43:36 15:48:12 15:52:48 15:57:24 16:2: 16:6:36 16:11:12 16:15:48 16:2:24 16:25: 16:29:36 16:34:13 16:38:49 The 24 core server is clearly over specified. With a peak of < 3%, this would equate to 7.2 cores. A dual quad core server would expect to be able to handle this load, though may be too close to the maximum utilisation; hence instead of two 24 core servers, three 8 core servers would expect to be sufficient. Memory Committed Megabytes MiB 6, 5,9 5,8 5,7 5,6 5,5 5,4 5,3 5,2 5,1 5, MiB 6, 5,9 5,8 5,7 5,6 5,5 5,4 5,3 5,2 5,1 5, 13:1:53 13:17:22 13:23:52 13:3:21 13:36:51 13:43:2 13:49:5 13:56:19 14:2:49 14:9:18 14:15:47 14:22:16 14:28:45 14:35:14 14:41:43 14:48:12 14:54:41 15:1:1 15:16:26 15:21:31 15:26:36 15:31:4 15:36:45 15:41:5 15:46:54 15:51:59 15:57:3 16:2:7 16:7:12 16:12:16 16:17:2 16:22:24 16:27:29 16:32:33 16:37:38 32
33 PhysicalDisk -- % Idle Time -- _Total :1:53 13:16:39 13:22:26 13:28:14 13:34:1 13:39:48 13:45:35 13:51:22 13:57:9 14:2:56 14:8:43 14:14:29 14:2:16 14:26:3 14:31:49 14:37:36 14:43:22 14:49:9 14:54:55 15::42 15:15:58 15:2:34 15:25:11 15:29:47 15:34:23 15:39: 15:43:36 15:48:12 15:52:48 15:57:24 16:2: 16:6:36 16:11:12 16:15:48 16:2:24 16:25: 16:29:36 16:34:13 16:38:49 Network Utilisation (Mbps) (8 Teamed 1GbE NICs) Mbps 2 Mbps :1:53 13:17:22 13:23:52 13:3:21 13:36:51 13:43:2 13:49:5 13:56:19 14:2:49 14:9:18 14:15:47 14:22:16 14:28:45 14:35:14 14:41:43 14:48:12 14:54:41 15:1:1 15:16:26 15:21:31 15:26:36 15:31:4 15:36:45 15:41:5 15:46:54 15:51:59 15:57:3 16:2:7 16:7:12 16:12:16 16:17:2 16:22:24 16:27:29 16:32:33 16:37:38 Mbps Received Mbps Sent Mbps Received Mbps Sent This network load mirrors the load seen on the other PVS server, with a peak close to 2.2Gbps. 33
34 NetApp Storage Performance Analysis concentrates on the actual test run rather than the spin up phase as the load is significantly higher. The following summary (courtesy of NetApp) captures the critical read/write and IOPS info for the 3312 desktop test. Averages for 3312 Virtual Desktops Reads Writes Mean Network Read/Write ratio 11.5% 88.5% Max Network Read/Write ratio 2.5% 79.5% Mean Disk Read/Write ratio 14.2% 85.8% Max Disk Read/Write ratio 17.8% 82.2% IOPS Mean IOPS per desktop 4.4 Max Average IOPS per desktop 27.7 Analysis o Never did more than 2 CPUS of the 4 on the storage controllers become fully utilised, staying well within normal operating limits with significant headroom for further growth if performance during a cluster failover is not required. o The average latency for all protocols was well within reasonable performance, which would provide an excellent end user experience. o During the start and end of the test run the CIFS workload was a 5% player in protocol usage. This is seen as a large amount of reads during the beginning of the test (when user profiles are loaded) and a large amount of writes at the end of the test (when profiles are written back). o The remaining duration of the test NFS played the predominate role being utilised for PVS client side cache. o FCP (Fibre Channel) played very little if no part in the workload seen on the filer. FCP was limited to database traffic for the various components in the environment. o The majority of all IO s were writes across all protocols. o Average and Max Disk utilization was never more than 4% which suggests there could be headroom to accept more virtual machines on to these controllers. o In the event of a cluster failure the data indicates the filer could handle 3-4 desktops with minimal or no performance degradation. 34
35 VMWare Virtual Center and ESX Performance Two blade servers have been installed as physical Virtual Center servers. Within each VC a cluster is created for each blade chassis of up to 16 ESX hosts. As there are two different hardware specs in the lab the number of Virtual Desktops hosted on each VC isn t quite balanced. Virtual Center 1 Blade Chassis # Hosts # Virtual Machines camb4e camb4e Total During the testing only 164 desktops were actively used. The remaining VMs remained powered off though would still be enumerated by Virtual Center and XenDesktop Pool Management. These additional VMs are present from earlier broker scalability testing. Virtual Center 2 Blade Chassis # Hosts # Virtual Machines camr3e camr3e camr5e camr5e Total In addition to the desktops above, VC2 also manages camr5e2b13 which hosts some infrastructure VMs, e.g. 3 x Brokers and 1 x NetApp performance monitor. Out of the 1773 desktop VMs only 178 were powered on. As with VC1 these additional VMs were present from earlier testing at higher host densities. 35
36 camr3e2b15: Virtual Center 1 Pool Spin Up During Test Run % Processor Time: _Total (2 x 4 Core CPUs) :1:53 13:16:53 13:22:54 13:28:54 13:34:55 13:4:55 13:46:55 13:52:56 13:58:56 14:4:57 14:1:57 14:16:57 14:22:58 14:28:58 14:34:59 14:4:59 14:46:59 14:53: 14:59: 15:5:1 15:11:21 15:16:22 15:21:22 15:26:22 15:31:23 15:36:23 15:41:23 15:46:24 15:51:24 15:56:24 16:1:25 16:6:25 16:11:25 16:16:26 16:21:26 16:26:26 16:31:27 16:36:27 16:41:27 Process -- % Processor Time -- vpxd :1:53 13:16:53 13:22:54 13:28:54 13:34:55 13:4:55 13:46:55 13:52:56 13:58:56 14:4:57 14:1:57 14:16:57 14:22:58 14:28:58 14:34:59 14:4:59 14:46:59 14:53: 14:59: 15:5:1 15:11:21 15:16:22 15:21:22 15:26:22 15:31:23 15:36:23 15:41:23 15:46:24 15:51:24 15:56:24 16:1:25 16:6:25 16:11:25 16:16:26 16:21:26 16:26:26 16:31:27 16:36:27 16:41:27 The vpxd service is exercised when XenDesktop Pool Management is requesting VMs be powered up or shut down. This can be seen during the spin up phase and at the end of the test run. As this server has 8 cores, the peak at ~2% would be equivalent to 2 cores being fully utilised. 36
37 37 Memory Committed Megabytes PhysicalDisk -- % Idle Time -- _Total 1,5 1,55 1,6 1,65 1,7 1,75 1,8 1,85 1,9 1,95 2, 13:1:53 13:17:23 13:23:54 13:3:24 13:36:55 13:43:25 13:49:56 13:56:26 14:2:57 14:9:27 14:15:57 14:22:28 14:28:58 14:35:29 14:41:59 14:48:29 14:55: 15:1:3 MiB 1,5 1,55 1,6 1,65 1,7 1,75 1,8 1,85 1,9 1,95 2, 15:11:21 15:16:52 15:22:22 15:27:52 15:33:23 15:38:53 15:44:24 15:49:54 15:55:24 16::55 16:6:25 16:11:55 16:17:26 16:22:56 16:28:26 16:33:57 16:39:27 MiB :1:53 13:16:53 13:22:54 13:28:54 13:34:55 13:4:55 13:46:55 13:52:56 13:58:56 14:4:57 14:1:57 14:16:57 14:22:58 14:28:58 14:34:59 14:4:59 14:46:59 14:53: 14:59: 15:5: :11:21 15:16:22 15:21:22 15:26:22 15:31:23 15:36:23 15:41:23 15:46:24 15:51:24 15:56:24 16:1:25 16:6:25 16:11:25 16:16:26 16:21:26 16:26:26 16:31:27 16:36:27 16:41:27
38 Network Utilisation (Mbps) Mbps Mbps :1:53 13:17:23 13:23:54 13:3:24 13:36:55 13:43:25 13:49:56 13:56:26 14:2:57 14:9:27 14:15:57 14:22:28 14:28:58 14:35:29 14:41:59 14:48:29 14:55: 15:1:3 15:11:21 15:16:52 15:22:22 15:27:52 15:33:23 15:38:53 15:44:24 15:49:54 15:55:24 16::55 16:6:25 16:11:55 16:17:26 16:22:56 16:28:26 16:33:57 16:39:27 NIC1: Mbps Received NIC1: Mbps Sent NIC1: Mbps Received NIC1: Mbps Sent NIC2: Mbps Received NIC2: Mbps Sent NIC2: Mbps Received NIC2: Mbps Sent 38
39 camr3e2b16: Virtual Center 2 Pool Spin Up During Test Run % Processor Time: _Total (2 x 4 Core CPUs) :1:53 13:16:53 13:22:54 13:28:54 13:34:55 13:4:55 13:46:55 13:52:56 13:58:56 14:4:57 14:1:57 14:16:58 14:22:58 14:28:58 14:34:59 14:4:59 14:47: 14:53: 14:59: 15:5:1 15:16:23 15:21:23 15:26:23 15:31:24 15:36:24 15:41:24 15:46:25 15:51:25 15:56:25 16:1:26 16:6:26 16:11:26 16:16:27 16:21:27 16:26:27 16:31:28 16:36:28 16:41:29 Process -- % Processor Time -- vpxd :1:53 13:16:53 13:22:54 13:28:54 13:34:55 13:4:55 13:46:55 13:52:56 13:58:56 14:4:57 14:1:57 14:16:58 14:22:58 14:28:58 14:34:59 14:4:59 14:47: 14:53: 14:59: 15:5:1 15:16:23 15:21:23 15:26:23 15:31:24 15:36:24 15:41:24 15:46:25 15:51:25 15:56:25 16:1:26 16:6:26 16:11:26 16:16:27 16:21:27 16:26:27 16:31:28 16:36:28 16:41:29 The load on vpxd is consistent between the two VC servers. As this server has 8 cores, the peak at ~23% would be equivalent to a little more than 2 cores being fully utilised. 39
40 Memory Committed Megabytes MiB 2, 1,95 1,9 1,85 1,8 1,75 1,7 1,65 1,6 1,55 1,5 13:1:53 13:17:23 13:23:54 13:3:24 13:36:55 13:43:25 13:49:56 13:56:26 14:2:57 14:9:27 14:15:58 14:22:28 14:28:58 14:35:29 14:41:59 14:48:3 14:55: 15:1:31 MiB 2, 1,95 1,9 1,85 1,8 1,75 1,7 1,65 1,6 1,55 1,5 15:16:53 15:22:23 15:27:54 15:33:24 15:38:54 15:44:25 15:49:55 15:55:25 16::56 16:6:26 16:11:56 16:17:27 16:22:57 16:28:28 16:33:58 16:39:28 The memory used on each VC is similar, though VC2 is ~3MiB higher. This is to be expected as it s managing twice the number of ESX hosts and a higher number of VM guests. PhysicalDisk -- % Idle Time -- _Total :1:53 13:16:53 13:22:54 13:28:54 13:34:55 13:4:55 13:46:55 13:52:56 13:58:56 14:4:57 14:1:57 14:16:58 14:22:58 14:28:58 14:34:59 14:4:59 14:47: 14:53: 14:59: 15:5:1 15:16:23 15:21:23 15:26:23 15:31:24 15:36:24 15:41:24 15:46:25 15:51:25 15:56:25 16:1:26 16:6:26 16:11:26 16:16:27 16:21:27 16:26:27 16:31:28 16:36:28 16:41:29 4
41 Network Utilisation (Mbps) Mbps Mbps :1:53 13:17:23 13:23:54 13:3:24 13:36:55 13:43:25 13:49:56 13:56:26 14:2:57 14:9:27 14:15:58 14:22:28 14:28:58 14:35:29 14:41:59 14:48:3 14:55: 15:1:31 15:16:53 15:22:23 15:27:54 15:33:24 15:38:54 15:44:25 15:49:55 15:55:25 16::56 16:6:26 16:11:56 16:17:27 16:22:57 16:28:28 16:33:58 16:39:28 NIC1: Mbps Received NIC1: Mbps Sent NIC1: Mbps Received NIC1: Mbps Sent NIC2: Mbps Received NIC2: Mbps Sent NIC2: Mbps Received NIC2: Mbps Sent 41
42 ESX Performance The test environment consists of 2 different hardware configurations running the desktop workload. The data below is from a BL46c with 32 GB RAM and 2 x L542 Quad Core CPU. Pool Spin Up During Test Run CPU Usage (2 x L542 Quad Core 2.5GHz CPU) Percent :1:11 13:16:51 13:23:31 13:3:11 13:36:51 13:43:31 13:5:11 13:56:51 14:3:32 14:1:12 14:16:52 14:23:32 14:3:12 14:36:52 14:43:32 14:5:12 14:56:52 Percent :3:32 15:1:12 15:16:52 15:23:32 15:3:12 15:36:52 15:43:32 15:5:12 15:56:52 16:3:32 16:1:12 16:16:52 16:23:32 16:3:12 16:36:52 16:43:32 CPU Usage (Average) CPU Usage (Average) 1 CPU Usage (Average) 2 CPU Usage (Average) 3 CPU Usage (Average) 4 CPU Usage (Average) 5 CPU Usage (Average) 6 CPU Usage (Average) 7 CPU Usage (Average) CPU Usage (Average) 1 CPU Usage (Average) 2 CPU Usage (Average) 3 CPU Usage (Average) 4 CPU Usage (Average) 5 CPU Usage (Average) 6 CPU Usage (Average) 7 42
 Memory Shared Common (Average) Memory Granted (Average) Memory Swap")
43 Memory Usage MiB Percent MiB :1:11 13:18:51 13:27:31 13:36:11 13:44:51 13:53:31 14:2:12 14:1:52 14:19:32 14:28:12 14:36:52 14:45:32 14:54:12 % 15:4:52 15:12:12 15:19:32 15:26:52 15:34:12 15:41:32 15:48:52 15:56:12 16:3:32 16:1:38 16:17:58 16:25:18 16:32:38 16:39:58 Memory Balloon (Average) Memory Shared Common (Average) Memory Granted (Average) Memory Swap Used (Average) Memory Active (Average) Average Memory Usage (%) Memory Balloon (Average) Memory Shared Common (Average) Memory Granted (Average) Memory Swap Used (Average) Memory Active (Average) Average Memory Usage (%) Disk Usage Kilobytes/second KBps KBps :1:12 13:16:32 13:22:52 13:29:12 13:35:32 13:41:52 13:48:12 13:54:32 14::52 14:7:12 14:13:32 14:19:52 14:26:12 14:32:32 14:38:52 14:45:12 14:51:32 14:57:52 15:3:52 15:9:52 15:15:52 15:21:52 15:27:52 15:33:52 15:39:52 15:45:52 15:51:52 15:57:52 16:3:52 16:9:52 16:15:52 16:21:52 16:27:52 16:33:52 16:39:52 16:45:52 Disk Read Rate vmhba:: Disk Read Rate vmhba:: Disk Write Rate vmhba:: Disk Write Rate vmhba:: This traffic is on the local physical disk of the ESX host, rather than tracking the activity of the VMs as these are on NFS shared storage. The frequency of the disk activity would suggest some logging, perhaps of performance data from the VMs. The rate of traffic appears to be proportional to the number of running virtual machines. Network Utilisation (Mbps) Mbps 1 5 Mbps :1:11 13:16:31 13:22:51 13:29:11 13:35:31 13:41:51 13:48:11 13:54:31 14::52 14:7:12 14:13:32 14:19:52 14:26:12 14:32:32 14:38:52 14:45:12 14:51:32 14:57:52 15:4:52 15:1:32 15:16:12 15:21:52 15:27:32 15:33:12 15:38:52 15:44:32 15:5:12 15:55:52 16:1:32 16:7:12 16:12:52 16:18:32 16:24:12 16:29:52 16:35:32 16:41:12 vmnic: Mbps Sent vmnic1: Mbps Sent vmnic: Mbps Sent vmnic1: Mbps Sent vmnic: Mbps Receive vmnic1: Mbps Receive vmnic: Mbps Receive vmnic1: Mbps Receive 43
44 Summary Spend extra time and care on how you simulate the user workload as it highly impacts all design recommendations. o Don t forget to consider the entire user population and how and when login storms will occur. Use free and reputable tools like LoginVSI from Login Consultants to simulate real-worldlike user workloads. Design for failover, your infrastructure size will depend on what user experience you want during failover (degraded or not, and how much). o Use central storage and blade servers for scale and reliability. Virtualize most major components of XenDesktop o Provisioning server in this design was not virtualized, and given the high scalability; you should dedicate a physical server to it in your design. It will be an option to run PVS virtualized, but look for recommendations on this in an upcoming document. 44
45 Appendix A Blade Server Hardware and Deployment The test environment consists of primarily HP Blade servers. Some additional servers hosting infrastructure of specific test components are detailed later in this report. VMware ESX was installed on the 2 different specification BL46 servers, labelled (V1) and (V2), which were used to host both Windows XP Desktops and a small number of VMs for XenDesktop Brokers (DDCs). The BL68 servers were used to host two Citrix Provisioning Services and a Microsoft SQL Server. These machines were somewhat over specified for their roles. BL46c (v1) 1.86Ghz Dual Processor Quad Core 16GB RAM 2 x 1.86Ghz Intel Xeon L532 Quad Core (8MiB L2 Cache 166Mhz Bus) 1 x 36GB HDD SAS 1K rpm 16 GB RAM 667Mhz Dual Broadcom 1Gb NICs QLogic QMH2462 Dual Port Fibre Channel HBA Product Overview: BL46c (v2) 2.5Ghz Dual Processor Quad Core 32GB RAM 2 x 2.5Ghz Intel Xeon L542 Quad Core (12MiB L2 Cache 1333Mhz Bus) 1 x 72GB HDD SAS 1K rpm 32 GiB RAM 667Mhz Dual Broadcom 1Gb NICs QLogic QMH2462 Dual Port Fibre Channel HBA Product Overview: 45
 1Mhz Bus) 2 x 72GB HDD SAS 1K rpm 64 GiB RAM 667Mhz 8 x Broadcom 1Gb NICs QLogic QMH2462 Dual Port")
46 BL68 G5 2.4Ghz Quad Processor Hex Core 64GB RAM 4 x 2.4Ghz Intel Xeon E745 Hex Core (9MiB L2 Cache (12MiB L3 Cache) 1Mhz Bus) 2 x 72GB HDD SAS 1K rpm 64 GiB RAM 667Mhz 8 x Broadcom 1Gb NICs QLogic QMH2462 Dual Port Fibre Channel HBA Product Overview: 46
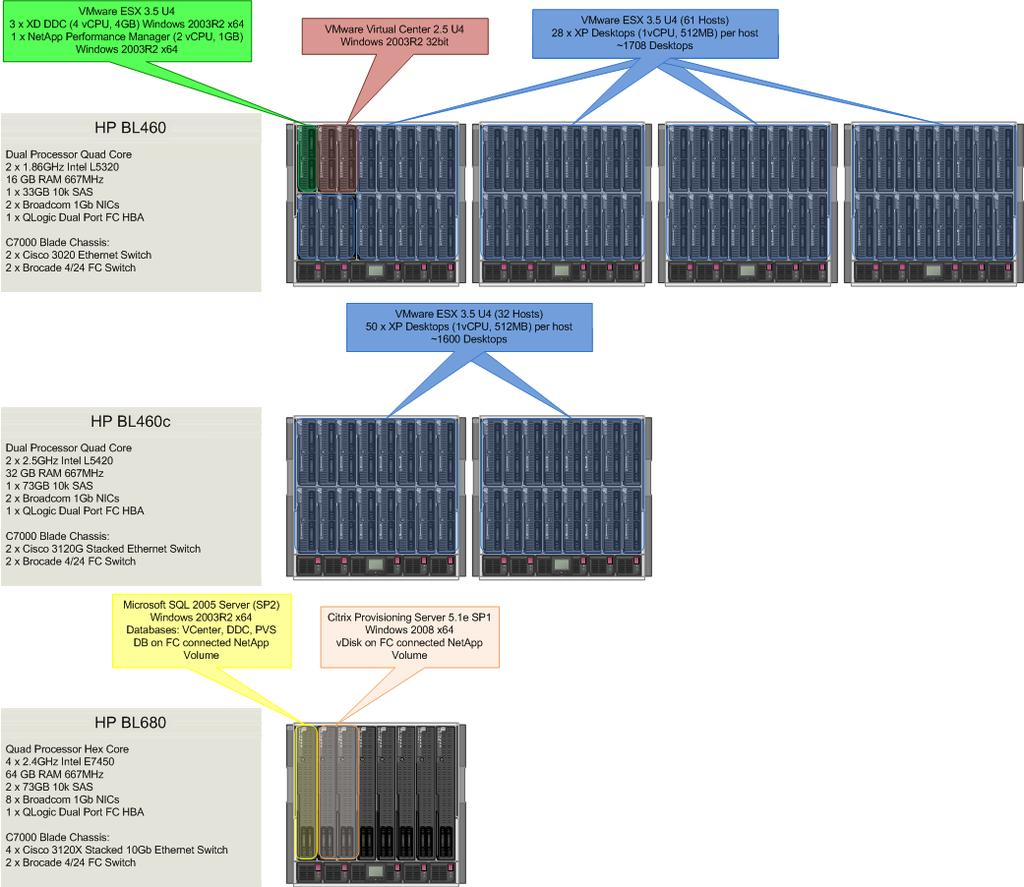
47 Blade Deployment 47

48 Appendix B Network Diagram This is predominately HP blade based environment running the virtual machines. Dell 195 1U Servers are used to run many ICA clients on the same server to connect into the environment. The environment was originally designed to use Fibre Channel for storage traffic, however in this testing NFS was used as it offer greatly simplified management and scalability. All traffic is passed to either a top of rack Cisco 296-G switch or via the Cisco blade switch modules in the blades back to a central Cisco 451 chassis. This chassis houses multiple 1GbE and 1GbE line cards in addition to the supervisor modules. Where the blade switches support stacking this feature has been used. 48

49 Fibre Channel Storage Network Fibre Channel network is only used for databases on SQL server running on one of the BL68 blades servers. All other storage traffic uses NFS over Ethernet links. 49
Scalability Testing with Login VSI v16.2. White Paper Parallels Remote Application Server 2018
 Scalability Testing with Login VSI v16.2 White Paper Parallels Remote Application Server 2018 Table of Contents Scalability... 3 Testing the Scalability of Parallels RAS... 3 Configurations for Scalability
Test Methodology We conducted tests by adding load and measuring the performance of the environment components:
 Scalability Considerations for Using the XenApp and XenDesktop Service Local Host Cache Feature with Citrix Cloud Connector Author: Jahed Iqbal Overview The local host cache feature in the XenApp and XenDesktop
Citrix XenDesktop 5.5 on VMware 5 with Hitachi Virtual Storage Platform
 Citrix XenDesktop 5.5 on VMware 5 with Hitachi Virtual Storage Platform Reference Architecture Guide By Roger Clark August 15, 2012 Feedback Hitachi Data Systems welcomes your feedback. Please share your
Parallels Remote Application Server. Scalability Testing with Login VSI
 Parallels Remote Application Server Scalability Testing with Login VSI Contents Introduction... 3 Scalability... 4 Testing the Scalability of Parallels RAS... 4 Configurations for Scalability Testing...
Dell EMC Ready Architectures for VDI
 Dell EMC Ready Architectures for VDI Designs for Citrix Virtual Apps and Desktops on VxRail and vsan Ready Nodes October 2018 H17344.1 Validation Guide Abstract This validation guide describes the architecture
Performance Lab Report & Architecture Overview Summary of SnapVDI Features and Performance Testing Using Login VSI
 by American Megatrends, Inc. Performance Lab Report & Architecture Overview Summary of SnapVDI Features and Performance Testing Using Login VSI Table of Contents Executive Summary... 4 1. Introduction...
EMC Virtual Infrastructure for Microsoft Exchange 2007 Enabled by EMC CLARiiON CX4-120 and VMware vsphere 4.0 using iscsi
 EMC Virtual Infrastructure for Microsoft Exchange 27 Enabled by EMC CLARiiON CX4-12 and Applied Technology Abstract This white paper details a solution built and tested using EMC CLARiiON CX4-12 and VMware
Citrix VDI Scalability Testing on Cisco UCS B200 M3 server with Storage Accelerator
 Citrix VDI Scalability Testing on Cisco UCS B200 M3 server with Storage Accelerator First Published: February 19, 2014 Last Modified: February 21, 2014 Americas Headquarters Cisco Systems, Inc. 170 West
Consulting Solutions WHITE PAPER Citrix XenDesktop XenApp 6.x Planning Guide: Virtualization Best Practices
 Consulting Solutions WHITE PAPER Citrix XenDesktop XenApp 6.x Planning Guide: Virtualization Best Practices www.citrix.com Table of Contents Overview... 3 Scalability... 3 Guidelines... 4 Operations...
VMWare Horizon View 6 VDI Scalability Testing on Cisco 240c M4 HyperFlex Cluster System
 VMWare Horizon View 6 VDI Scalability Testing on Cisco 240c M4 HyperFlex Cluster System First Published: August 25, 2016 Last Modified: August 31, 2016 Americas Headquarters Cisco Systems, Inc. 170 West
Performance Characterization of the Dell Flexible Computing On-Demand Desktop Streaming Solution
 Performance Characterization of the Dell Flexible Computing On-Demand Desktop Streaming Solution Product Group Dell White Paper February 28 Contents Contents Introduction... 3 Solution Components... 4
XenApp and XenDesktop 7.12 on vsan 6.5 All-Flash January 08, 2018
 XenApp and XenDesktop 7.12 on vsan 6.5 All-Flash January 08, 2018 1 Table of Contents 1. Executive Summary 1.1.Business Case 1.2.Key Results 2. Introduction 2.1.Scope 2.2.Audience 3. Technology Overview
Adobe Acrobat Connect Pro 7.5 and VMware ESX Server
 White Paper Table of contents 2 Tested environments 3 Benchmarking tests 3 Performance comparisons 7 Installation requirements 7 Installing and configuring the VMware environment 1 Supported virtual machine
EMC Business Continuity for Microsoft Applications
 EMC Business Continuity for Microsoft Applications Enabled by EMC Celerra, EMC MirrorView/A, EMC Celerra Replicator, VMware Site Recovery Manager, and VMware vsphere 4 Copyright 2009 EMC Corporation. All
Dell EMC Ready Architectures for VDI
 Dell EMC Ready Architectures for VDI Designs for Citrix Virtual Apps and Desktops on Dell EMC XC Family October 2018 H17391.1 Validation Guide Abstract This validation guide describes the architecture
Evaluation Report: HP StoreFabric SN1000E 16Gb Fibre Channel HBA
 Evaluation Report: HP StoreFabric SN1000E 16Gb Fibre Channel HBA Evaluation report prepared under contract with HP Executive Summary The computing industry is experiencing an increasing demand for storage
Cisco UCS-Mini with B200 M4 Blade Servers High Capacity/High Performance Citrix Virtual Desktop and App Solutions
 In Collaboration with Intel May 2015 Cisco UCS-Mini with B200 M4 Blade Servers High Capacity/High Performance Citrix Virtual Desktop and App Solutions Presenters: Frank Anderson Desktop Virtualization
Reference Architecture: Lenovo Client Virtualization with Citrix XenDesktop and System x Servers
 Reference Architecture: Lenovo Client Virtualization with Citrix XenDesktop and System x Servers Last update: 27 March 2017 Version 1.4 Reference Architecture for Citrix XenDesktop Contains performance
IBM Emulex 16Gb Fibre Channel HBA Evaluation
 IBM Emulex 16Gb Fibre Channel HBA Evaluation Evaluation report prepared under contract with Emulex Executive Summary The computing industry is experiencing an increasing demand for storage performance
W H I T E P A P E R. What s New in VMware vsphere 4: Performance Enhancements
 W H I T E P A P E R What s New in VMware vsphere 4: Performance Enhancements Scalability Enhancements...................................................... 3 CPU Enhancements............................................................
Optimizing XenApp for the Virtual Data Center
 Optimizing XenApp for the Virtual Data Center April 11 th, 2012 Shawn Bass Citrix CTP & Microsoft MVP Independent Consultant www.shawnbass.com @ShawnBass Jim Moyle Citrix CTP Lead European Solutions Consultant
Dell EMC Ready Architectures for VDI
 Dell EMC Ready Architectures for VDI Designs for VMware Horizon on VxRail and VSAN Ready Nodes September 2018 H17341.1 Validation Guide Abstract This validation guide describes the architecture and performance
Performance Report: Multiprotocol Performance Test of VMware ESX 3.5 on NetApp Storage Systems
 NETAPP TECHNICAL REPORT Performance Report: Multiprotocol Performance Test of VMware ESX 3.5 on NetApp Storage Systems A Performance Comparison Study of FC, iscsi, and NFS Protocols Jack McLeod, NetApp
A Performance Characterization of Microsoft SQL Server 2005 Virtual Machines on Dell PowerEdge Servers Running VMware ESX Server 3.
 A Performance Characterization of Microsoft SQL Server 2005 Virtual Machines on Dell PowerEdge Servers Running VMware ESX Server 3.5 Todd Muirhead Dell Enterprise Technology Center www.delltechcenter.com
Dell EMC Ready Architectures for VDI
 Dell EMC Ready Architectures for VDI Designs for VMware Horizon on Dell EMC XC Family September 2018 H17386 Validation Guide Abstract This validation guide describes the architecture and performance of
INTEGRATED INFRASTRUCTURE FOR VIRTUAL DESKTOPS ENABLED BY EMC VNXE3300, VMWARE VSPHERE 4.1, AND VMWARE VIEW 4.5
 White Paper INTEGRATED INFRASTRUCTURE FOR VIRTUAL DESKTOPS ENABLED BY EMC VNXE3300, VMWARE VSPHERE 4.1, AND VMWARE VIEW 4.5 EMC GLOBAL SOLUTIONS Abstract This white paper describes a simple, efficient,
Citrix Provisioning Services and Machine Creation Services a technology comparison. Marius Leu, The Campus Ronald Grass, Citrix Systems GmbH
 Citrix Provisioning Services and Machine Creation Services a technology comparison Marius Leu, The Campus Ronald Grass, Citrix Systems GmbH Agenda Why should we use Provisioning Technologies? How Provisioning
Virtualizing SQL Server 2008 Using EMC VNX Series and VMware vsphere 4.1. Reference Architecture
 Virtualizing SQL Server 2008 Using EMC VNX Series and VMware vsphere 4.1 Copyright 2011, 2012 EMC Corporation. All rights reserved. Published March, 2012 EMC believes the information in this publication
Citrix XenDesktop with Provisioning Server for VDI on Dell Compellent SC8000 All Flash Arrays for 3,000 Users
 Citrix XenDesktop with Provisioning Server for VDI on Dell Compellent SC8000 All Flash Arrays for 3,000 Users A Dell Compellent VDI Reference Architecture Dell Compellent Technical Solutions December 2013
EMC Virtual Infrastructure for Microsoft Applications Data Center Solution
 EMC Virtual Infrastructure for Microsoft Applications Data Center Solution Enabled by EMC Symmetrix V-Max and Reference Architecture EMC Global Solutions Copyright and Trademark Information Copyright 2009
DELL EMC READY BUNDLE FOR VIRTUALIZATION WITH VMWARE AND FIBRE CHANNEL INFRASTRUCTURE
 DELL EMC READY BUNDLE FOR VIRTUALIZATION WITH VMWARE AND FIBRE CHANNEL INFRASTRUCTURE Design Guide APRIL 0 The information in this publication is provided as is. Dell Inc. makes no representations or warranties
Microsoft SQL Server in a VMware Environment on Dell PowerEdge R810 Servers and Dell EqualLogic Storage
 Microsoft SQL Server in a VMware Environment on Dell PowerEdge R810 Servers and Dell EqualLogic Storage A Dell Technical White Paper Dell Database Engineering Solutions Anthony Fernandez April 2010 THIS
EMC Infrastructure for Virtual Desktops
 EMC Infrastructure for Virtual Desktops Enabled by EMC Celerra Unified Storage (FC), VMware vsphere 4.1, VMware View 4.5, and VMware View Composer 2.5 Reference Architecture Copyright 2010 EMC Corporation.
I appreciate those of you who provided questions for today s webinar and since I received them before finalizing this presentation I was able to work
 I appreciate those of you who provided questions for today s webinar and since I received them before finalizing this presentation I was able to work the answers in for many of the posed questions. Some
Reference Architecture: Lenovo Client Virtualization with Citrix XenDesktop and ThinkSystem Servers
 Reference Architecture: Lenovo Client Virtualization with Citrix XenDesktop and ThinkSystem Servers Last update: 22 January 2018 Version 1.2 Configuration Reference Number: VDICX01XX73 Reference Architecture
Nutanix Complete Cluster Reference Architecture for Virtual Desktop Infrastructure
 Nutanix Complete Cluster Reference Architecture for Virtual Desktop Infrastructure with VMware vsphere 5 and View 5 Table of Contents 1. Executive Summary...1 2. Introduction to Project Colossus...2 2.1.
EMC VSPEX END-USER COMPUTING
 IMPLEMENTATION GUIDE EMC VSPEX END-USER COMPUTING Citrix XenDesktop 7.1 and VMware vsphere for up to 500 Virtual Desktops Enabled by EMC VNXe3200 and EMC Powered Backup EMC VSPEX Abstract This describes
Best Practices for Deploying a Mixed 1Gb/10Gb Ethernet SAN using Dell EqualLogic Storage Arrays
 Dell EqualLogic Best Practices Series Best Practices for Deploying a Mixed 1Gb/10Gb Ethernet SAN using Dell EqualLogic Storage Arrays A Dell Technical Whitepaper Jerry Daugherty Storage Infrastructure
Agenda. Flexcast Management Architecture XenDesktop 7: Install, Manage, Support Migration/upgrade Best Practices Demo Upgrade tips (if time permits)
") side 1 side 2 Agenda Flexcast Management Architecture XenDesktop 7: Install, Manage, Support Migration/upgrade Best Practices Demo Upgrade tips (if time permits) side 3 FlexCast Management Architecture
side 1 side 2 Agenda Flexcast Management Architecture XenDesktop 7: Install, Manage, Support Migration/upgrade Best Practices Demo Upgrade tips (if time permits) side 3 FlexCast Management Architecture
Solution Track 4 Design a Scalable Virtual Desktop Infrastructure
 Solution Track 4 Design a Scalable Virtual Desktop Infrastructure Irene Yeoh System Consultant, VCP VMware, Inc. September 2008 Basics of Virtual Desktop Infrastructure (VDI) Ease of provisioning Migration
Microsoft Exchange Server 2010 Performance on VMware vsphere 5
 Microsoft Exchange Server 2010 Performance on VMware vsphere 5 Performance Study TECHNICAL WHITE PAPER Table of Contents Introduction.... 3 Experimental Configuration and Methodology... 3 Test-Bed Configuration....
Citrix Ready Setup for XenDesktop on Datrium DVX
 Citrix Ready Setup for XenDesktop on Datrium DVX 385 Moffett Park Dr. Sunnyvale, CA 94089 844-478-8349 www.datrium.com Technical Report Introduction This document covers the setup and use of Citrix XenDesktop
Microsoft Office SharePoint Server 2007
 Microsoft Office SharePoint Server 2007 Enabled by EMC Celerra Unified Storage and Microsoft Hyper-V Reference Architecture Copyright 2010 EMC Corporation. All rights reserved. Published May, 2010 EMC
Delll and Citrix-Kaviza VDI-in-a-Box Reference Architecture 1
 Delll and Citrix-K Kaviza VDI-in-a-Box Referencee Architecturee Technical White Paper: Citrix XenServer Version Dell Desktop Virtualization Solutions 1 P age Dell and Kaviza R eference Architecture Contents
EMC INFRASTRUCTURE FOR VIRTUAL DESKTOPS ENABLED BY EMC VNX SERIES (NFS),VMWARE vsphere 4.1, VMWARE VIEW 4.6, AND VMWARE VIEW COMPOSER 2.
,VMWARE vsphere 4.1, VMWARE VIEW 4.6, AND VMWARE VIEW COMPOSER 2.") EMC INFRASTRUCTURE FOR VIRTUAL DESKTOPS ENABLED BY EMC VNX SERIES (NFS),VMWARE vsphere 4.1, VMWARE VIEW 4.6, AND VMWARE VIEW COMPOSER 2.6 Reference Architecture EMC SOLUTIONS GROUP August 2011 Copyright
EMC INFRASTRUCTURE FOR VIRTUAL DESKTOPS ENABLED BY EMC VNX SERIES (NFS),VMWARE vsphere 4.1, VMWARE VIEW 4.6, AND VMWARE VIEW COMPOSER 2.6 Reference Architecture EMC SOLUTIONS GROUP August 2011 Copyright
Datrium Technical Note Citrix Ready Setup for XenDesktop on Datrium DVX
 Datrium Technical Note Citrix Ready Setup for XenDesktop on Datrium DVX June 2017 TR-2017-03-1 Copyright 2017 Datrium, Inc. All Rights Reserved. This product is protected by U.S. and international copyright
White Paper. The impact of virtualization security on your VDI environment
 The impact of virtualization security on your VDI environment Contents Introduction...3 What is VDI?...3 Virtualization security challenges...3 Choosing the right virtualization security solution...4 Conclusion...7
VMware vsphere with ESX 4.1 and vcenter 4.1
 QWERTYUIOP{ Overview VMware vsphere with ESX 4.1 and vcenter 4.1 This powerful 5-day class is an intense introduction to virtualization using VMware s vsphere 4.1 including VMware ESX 4.1 and vcenter.
Dell EMC XC Series Appliances A Winning VDI Solution with Scalable Infrastructure
 Dell EMC XC Series Appliances A Winning VDI Solution with Scalable Infrastructure The linear scalability of the Dell EMC XC series appliances powered by Nutanix for VDI deployments. Dell EMC Engineering
Virtualization with VMware ESX and VirtualCenter SMB to Enterprise
 Virtualization with VMware ESX and VirtualCenter SMB to Enterprise This class is an intense, five-day introduction to virtualization using VMware s immensely popular Virtual Infrastructure suite including
Nutanix Reference Architecture Version 1.1 July 2016 RA-2022
 Citrix XenDesktop on vsphere Nutanix Reference Architecture Version 1.1 July 2016 RA-2022 Copyright Copyright 2016 Nutanix, Inc. Nutanix, Inc. 1740 Technology Drive, Suite 150 San Jose, CA 95110 All rights
BlackBerry Enterprise Server for Microsoft Exchange Version: 5.0. Performance Benchmarking Guide
 BlackBerry Enterprise Server for Microsoft Exchange Version: 5.0 Performance Benchmarking Guide Published: 2009-08-31 SWD-760382-0831035819-001 Contents 1 BlackBerry Enterprise Server for Microsoft Exchange...
Exchange Server 2007 Performance Comparison of the Dell PowerEdge 2950 and HP Proliant DL385 G2 Servers
 Exchange Server 2007 Performance Comparison of the Dell PowerEdge 2950 and HP Proliant DL385 G2 Servers By Todd Muirhead Dell Enterprise Technology Center Dell Enterprise Technology Center dell.com/techcenter
Deploying EMC CLARiiON CX4-240 FC with VMware View. Introduction... 1 Hardware and Software Requirements... 2
 Deploying EMC CLARiiON CX4-240 FC with View Contents Introduction... 1 Hardware and Software Requirements... 2 Hardware Resources... 2 Software Resources...2 Solution Configuration... 3 Network Architecture...
The impact of virtualization security on your VDI environment
 ENTERPRISE The impact of virtualization security on your VDI environment Contents Introduction... 3 What is VDI?... 3 Virtualization security challenges... 3 Choosing the right virtualization security
Surveillance Dell EMC Storage with Bosch Video Recording Manager
 Surveillance Dell EMC Storage with Bosch Video Recording Manager Sizing and Configuration Guide H13970 REV 2.1 Copyright 2015-2017 Dell Inc. or its subsidiaries. All rights reserved. Published December
EMC INFRASTRUCTURE FOR VMWARE VIEW 5.0
 Reference Architecture EMC INFRASTRUCTURE FOR VMWARE VIEW 5.0 EMC VNX Series (NFS), VMware vsphere 5.0, VMware View 5.0, VMware View Persona Management, and VMware View Composer 2.7 Simplify management
VMWARE HORIZON 6 ON HYPER-CONVERGED INFRASTRUCTURES. Horizon 6 version 6.2 VMware vsphere 6U1 / VMware Virtual SAN 6U1 Supermicro TwinPro 2 4 Nodes
 TECHNICAL WHITE PAPER SEPTEMBER 2016 VMWARE HORIZON 6 ON HYPER-CONVERGED INFRASTRUCTURES Horizon 6 version 6.2 VMware vsphere 6U1 / VMware Virtual SAN 6U1 Supermicro TwinPro 2 4 Nodes Table of Contents
Performance & Scalability Testing in Virtual Environment Hemant Gaidhani, Senior Technical Marketing Manager, VMware
 Performance & Scalability Testing in Virtual Environment Hemant Gaidhani, Senior Technical Marketing Manager, VMware 2010 VMware Inc. All rights reserved About the Speaker Hemant Gaidhani Senior Technical
[TITLE] Virtualization 360: Microsoft Virtualization Strategy, Products, and Solutions for the New Economy
![[TITLE] Virtualization 360: Microsoft Virtualization Strategy, Products, and Solutions for the New Economy](/thumbs/85/92753915.jpg "[TITLE] Virtualization 360: Microsoft Virtualization Strategy, Products, and Solutions for the New Economy") [TITLE] Virtualization 360: Microsoft Virtualization Strategy, Products, and Solutions for the New Economy Mounir Chaaban & Riaz Salim Account Technology Strategist Microsoft Corporation Microsoft s Vision
[TITLE] Virtualization 360: Microsoft Virtualization Strategy, Products, and Solutions for the New Economy Mounir Chaaban & Riaz Salim Account Technology Strategist Microsoft Corporation Microsoft s Vision
EMC INFRASTRUCTURE FOR CITRIX XENDESKTOP 7
 Reference Architecture EMC INFRASTRUCTURE FOR CITRIX XENDESKTOP 7 Simplify management and decrease total cost of ownership Guarantee a superior desktop experience Ensure a successful virtual desktop deployment
XenDesktop Planning Guide: Image Delivery
 Consulting Solutions WHITE PAPER Citrix XenDesktop XenDesktop Planning Guide: Image Delivery ( / Machine Creation ) www.citrix.com Overview With previous versions of XenDesktop (version 4 and prior), the
The scalability and economics of delivering Citrix Virtual App and Desktop services from Microsoft Azure
 White Paper July 2018 The scalability and economics of delivering Citrix Virtual App and Desktop services from Microsoft Azure Given business dynamics seasonal peaks, mergers, acquisitions, and changing
Virtualization of the MS Exchange Server Environment
 MS Exchange Server Acceleration Maximizing Users in a Virtualized Environment with Flash-Powered Consolidation Allon Cohen, PhD OCZ Technology Group Introduction Microsoft (MS) Exchange Server is one of
WHITE PAPER Using Marathon everrun MX 6.1 with XenDesktop 5 Service Pack 1
 WHITE PAPER Using Marathon everrun MX 6.1 with XenDesktop 5 Service Pack 1 www.citrix.com Contents Introduction... 2 Executive Overview... 2 Marathon everrun MX 6.1 (description by Marathon Technologies)...
EMC INFRASTRUCTURE FOR VMWARE VIEW 5.1
 Reference Architecture EMC INFRASTRUCTURE FOR VMWARE VIEW 5.1 EMC VNX Series (NFS), VMware vsphere 5.0, VMware View 5.1, VMware View Storage Accelerator, VMware View Persona Management, and VMware View
Consulting Solutions WHITE PAPER Citrix XenDesktop XenApp Planning Guide: Virtualization Best Practices
 Consulting Solutions WHITE PAPER Citrix XenDesktop XenApp Planning Guide: Virtualization Best Practices www.citrix.com Overview Desktop virtualization comprises of many different types of virtual desktops.
TechTalk. Simplifying Application Delivery to the Virtual Desktop. February Daniel Feller, Sr. Architect Worldwide Consulting Solutions
 TechTalk Simplifying Application Delivery to the Virtual Desktop February 2009 Daniel Feller, Sr. Architect Worldwide Consulting Solutions Agenda Simplifying the Desktop Integrated Architecture Technical
Active System Manager Release 8.2 Compatibility Matrix
 Active System Manager Release 8.2 Compatibility Matrix Notes, cautions, and warnings NOTE: A NOTE indicates important information that helps you make better use of your computer. CAUTION: A CAUTION indicates
EMC END-USER COMPUTING
 EMC END-USER COMPUTING Citrix XenDesktop 7.9 and VMware vsphere 6.0 with VxRail Appliance Scalable, proven virtual desktop solution from EMC and Citrix Simplified deployment and management Hyper-converged
W H I T E P A P E R. Comparison of Storage Protocol Performance in VMware vsphere 4
 W H I T E P A P E R Comparison of Storage Protocol Performance in VMware vsphere 4 Table of Contents Introduction................................................................... 3 Executive Summary............................................................
Virtual Desktop Infrastructure with Dell Fluid Cache for SAN
 Virtual Desktop Infrastructure with Dell Fluid Cache for SAN This Dell technical white paper describes the tasks to deploy a high IOPS (heavy user), 800-user, virtual desktop environment in a VMware Horizon
Reference Architecture
 EMC Solutions for Microsoft SQL Server 2005 on Windows 2008 in VMware ESX Server EMC CLARiiON CX3 Series FCP EMC Global Solutions 42 South Street Hopkinton, MA 01748-9103 1-508-435-1000 www.emc.com www.emc.com
Microsoft RemoteFX for Remote Desktop Virtualization Host Capacity Planning Guide for Windows Server 2008 R2 Service Pack 1
 Microsoft RemoteFX for Remote Desktop Virtualization Host Capacity Planning Guide for Windows Server 2008 R2 Service Pack 1 Microsoft Corporation Published: March 2011 Abstract Microsoft RemoteFX delivers
Reference Architecture: Lenovo Client Virtualization with VMware Horizon and System x Servers
 Reference Architecture: Lenovo Client Virtualization with VMware Horizon and System x Servers Last update: 29 March 2017 Version 1.7 Reference Architecture for VMware Horizon (with View) Contains performance
Dell EMC. Vblock System 340 with VMware Horizon 6.0 with View
 Dell EMC Vblock System 340 with VMware Horizon 6.0 with View Version 1.0 November 2014 THE INFORMATION IN THIS PUBLICATION IS PROVIDED "AS IS." VCE MAKES NO REPRESENTATIONS OR WARRANTIES OF ANY KIND WITH
Maintaining End-to-End Service Levels for VMware Virtual Machines Using VMware DRS and EMC Navisphere QoS
 Maintaining End-to-End Service Levels for VMware Virtual Machines Using VMware DRS and EMC Applied Technology Abstract This white paper describes tests in which Navisphere QoS Manager and VMware s Distributed
DELL EMC READY BUNDLE FOR VIRTUALIZATION WITH VMWARE AND ISCSI INFRASTRUCTURE
 DELL EMC READY BUNDLE FOR VIRTUALIZATION WITH VMWARE AND ISCSI INFRASTRUCTURE Design Guide APRIL 2017 1 The information in this publication is provided as is. Dell Inc. makes no representations or warranties
Managing Performance Variance of Applications Using Storage I/O Control
 Performance Study Managing Performance Variance of Applications Using Storage I/O Control VMware vsphere 4.1 Application performance can be impacted when servers contend for I/O resources in a shared storage
EMC Infrastructure for Virtual Desktops
 EMC Infrastructure for Virtual Desktops Enabled by EMC Unified Storage (FC), Microsoft Windows Server 2008 R2 Hyper-V, and Citrix XenDesktop 4 Proven Solution Guide EMC for Enabled
Citrix XenDesktop 7.6, Provisioning Services 7.6 and the XenDesktop Setup Wizard with Write Cache and Personal vdisk Drives
 Citrix XenDesktop 7.6, Provisioning Services 7.6 and the XenDesktop Setup Wizard with Write Cache and Personal vdisk Drives Using Personal vdisks and Write Cache drives with XenDesktop 7.6 Prepared by
Dell PowerEdge R910 SQL OLTP Virtualization Study Measuring Performance and Power Improvements of New Intel Xeon E7 Processors and Low-Voltage Memory
 Dell PowerEdge R910 SQL OLTP Virtualization Study Measuring Performance and Power Improvements of New Intel Xeon E7 Processors and Low-Voltage Memory A Dell Technical White Paper Dell, Inc. Waseem Raja
Terminal Services Scalability Study
 Terminal Services Scalability Study Part 1 The Effect of CPS 4.0 Microsoft Windows Terminal Services Citrix Presentation Server 4.0 June 2007 Table of Contents 1 Executive summary 3 2 Introduction 4 2.1
Personal vdisk Implementation Guide. Worldwide Technical Readiness
 Worldwide Technical Readiness Table of Contents Table of Contents... 2 Overview... 3 Implementation Guide... 4 Pre-requisites... 5 Preparing PVS vdisk to be used with Personal vdisk... 6 Creating a Desktop
EMC Integrated Infrastructure for VMware. Business Continuity
 EMC Integrated Infrastructure for VMware Business Continuity Enabled by EMC Celerra and VMware vcenter Site Recovery Manager Reference Architecture Copyright 2009 EMC Corporation. All rights reserved.
VMware vsphere with ESX 4 and vcenter
 VMware vsphere with ESX 4 and vcenter This class is a 5-day intense introduction to virtualization using VMware s immensely popular vsphere suite including VMware ESX 4 and vcenter. Assuming no prior virtualization
[TITLE] Virtualization 360: Microsoft Virtualization Strategy, Products, and Solutions for the New Economy
![[TITLE] Virtualization 360: Microsoft Virtualization Strategy, Products, and Solutions for the New Economy](/thumbs/72/67616055.jpg "[TITLE] Virtualization 360: Microsoft Virtualization Strategy, Products, and Solutions for the New Economy") [TITLE] Virtualization 360: Microsoft Virtualization Strategy, Products, and Solutions for the New Economy Mounir Chaaban Account Technology Strategist Microsoft Corporation Microsoft s Vision Enabling
[TITLE] Virtualization 360: Microsoft Virtualization Strategy, Products, and Solutions for the New Economy Mounir Chaaban Account Technology Strategist Microsoft Corporation Microsoft s Vision Enabling
EMC INFRASTRUCTURE FOR CITRIX XENDESKTOP 5.6
 Proven Solutions Guide EMC INFRASTRUCTURE FOR CITRIX XENDESKTOP 5.6 EMC VNX Series (NFS), VMware vsphere 5.0, Citrix XenDesktop 5.6, and Citrix Profile Manager 4.1 Simplify management and decrease TCO
Cisco Validated Design. July 2011
 Reference Architecture-Based Design Citrix XenDesktop Built on FlexPod Citrix XenDesktop Using Cisco Unified Computing System, VMware vsphere, and NetApp Storage Cisco Validated Design July 2011 Contents
DATA PROTECTION IN A ROBO ENVIRONMENT
 Reference Architecture DATA PROTECTION IN A ROBO ENVIRONMENT EMC VNX Series EMC VNXe Series EMC Solutions Group April 2012 Copyright 2012 EMC Corporation. All Rights Reserved. EMC believes the information
Dell EMC Ready Architectures for VDI
 Dell EMC Ready Architectures for VDI Designs for Citrix XenDesktop and XenApp for Dell EMC XC Family September 2018 H17388 Deployment Guide Abstract This deployment guide provides instructions for deploying
Evaluation Report: Improving SQL Server Database Performance with Dot Hill AssuredSAN 4824 Flash Upgrades
 Evaluation Report: Improving SQL Server Database Performance with Dot Hill AssuredSAN 4824 Flash Upgrades Evaluation report prepared under contract with Dot Hill August 2015 Executive Summary Solid state
BUILDING THE RIGHT INFRASTRUCTURE FOR VDI
 BUILDING THE RIGHT INFRASTRUCTURE FOR VDI Doing it right! #ILTACON #ILTA145 LISA STONE Client Systems Architect Cornerstone.IT Lisa.Stone@Cornerstone.IT WHAT S UNDER THE HOOD? Real World Remediation XenApp
Virtualization with VMware ESX and VirtualCenter SMB to Enterprise
 Virtualization with VMware ESX and VirtualCenter SMB to Enterprise This class is an intense, four-day introduction to virtualization using VMware s immensely popular Virtual Infrastructure suite including
VMware vsphere with ESX 6 and vcenter 6
 VMware vsphere with ESX 6 and vcenter 6 Course VM-06 5 Days Instructor-led, Hands-on Course Description This class is a 5-day intense introduction to virtualization using VMware s immensely popular vsphere
Disclaimer This presentation may contain product features that are currently under development. This overview of new technology represents no commitme
 ADV1582BE Solve your Citrix Problems with VMware Technologies Nick Jeffries, Senior Solutions Architect, VMware Sebastian Brand, Lead Systems Engineer, VMware #VMworld #ADV1582BE Disclaimer This presentation
EMC Virtual Architecture for Microsoft SharePoint Server Reference Architecture
 EMC Virtual Architecture for Microsoft SharePoint Server 2007 Enabled by EMC CLARiiON CX3-40, VMware ESX Server 3.5 and Microsoft SQL Server 2005 Reference Architecture EMC Global Solutions Operations
What s New in VMware vsphere 4.1 Performance. VMware vsphere 4.1
 What s New in VMware vsphere 4.1 Performance VMware vsphere 4.1 T E C H N I C A L W H I T E P A P E R Table of Contents Scalability enhancements....................................................................
TPC-E testing of Microsoft SQL Server 2016 on Dell EMC PowerEdge R830 Server and Dell EMC SC9000 Storage
 TPC-E testing of Microsoft SQL Server 2016 on Dell EMC PowerEdge R830 Server and Dell EMC SC9000 Storage Performance Study of Microsoft SQL Server 2016 Dell Engineering February 2017 Table of contents
Microsoft v12.39
 Microsoft.70-693.v12.39 Number: 70-693 Passing Score: 800 Time Limit: 120 min File Version: 12.39 http://www.gratisexam.com/ Copyright?2006-2011 Lead2pass.com, All Rights Reserved. Vendor: Microsoft Exam