Development of an interface that allows MDX based data warehouse queries by less experienced users
|
|
|
- Colin Hunter
- 5 years ago
- Views:
Transcription
1 Development of an interface that allows MDX based data warehouse queries by less experienced users Mariana Duprat André Monat Escola Superior de Desenho Industrial 400
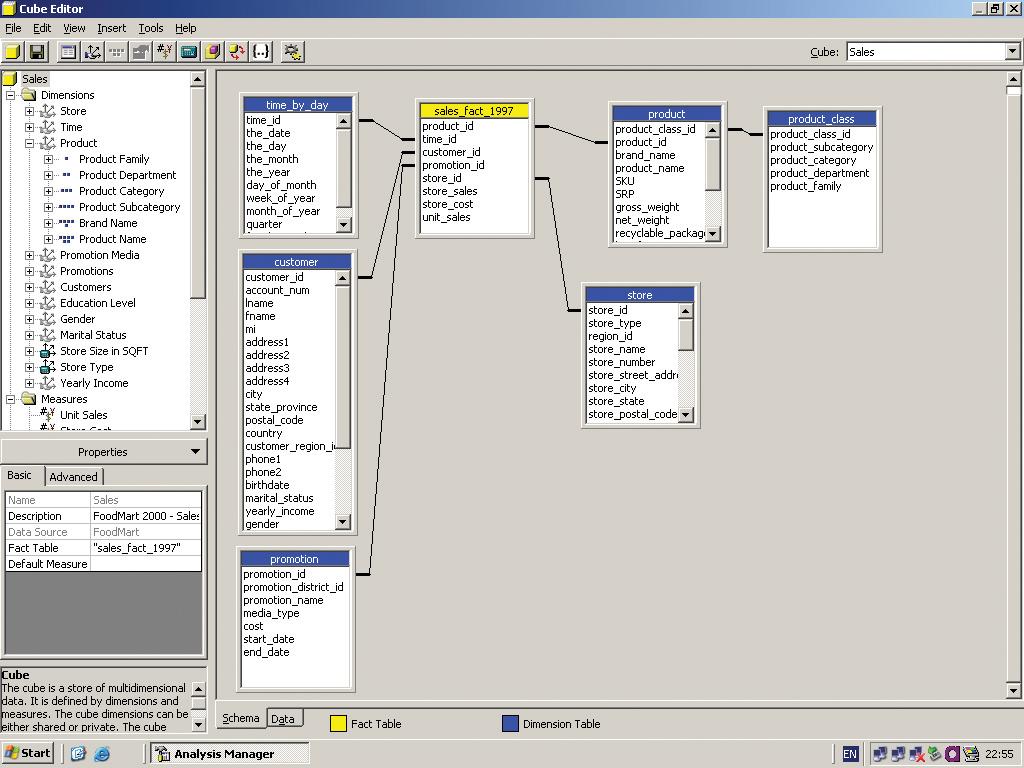
2 Introduction Data analysis is a fundamental resource when we are interested in collecting, organizing and comparing information. It gives us a more accurate vision of the situation in focus, allowing our decisions to be more consistent. As result, we achieve a better awareness of the context we are inserted in. Normally, it makes also possible to foresee the outcome of our immediate decisions. In brief, data analysis performs a pivotal role in modern management. In order to be effective, proper information must be available for all ranks of a company. More specifically, strategic information must be available among high rank managers so they can take well based decisions. These high rank managers can not rely only on ordinary reports from the Information Technology (IT) sector of the companies. This type of managers frequently needs specific reports for specific decisions. Normally these reports take time to be built and are delivered only when they are no longer needed. This happens because professionals from the IT sectors of the companies are quite busy people. They are normally involved in solving daily problems. They can not stop their ordinary tasks to provide reports for strategic decision making. Unfortunately, management is a highly competitive process. There is a proper time for taking a decision and reports must be available when they are really needed. Otherwise they become useless. For daily information, we rely on what is called OLTP (On Line Transactional Processing) Databases. These databases are not efficient in providing strategic reports. They are designed for queries concerning our routine operations. Besides, any query applied to this type of database must be expressed through a formal computing language (for instance SQL). Therefore, non IT experts can not have direct access to data stored in OLTP systems. This is the main reason to disregard OLTP systems as decision making tools. OLAP Databases (On Line Analytical Processing) are quite different. They are designed in order to allow non IT experts to build the reports they need. OLAP Databases (and other OLAP systems) are able to store a gigantic amount of information based on historical data. Analyzing this data, managers are able to conclude about trends, market segments, client patterns among others possible conclusions. In order to make possible analyses from non IT experts, OLAP databases, known as Data Warehouses, are built according to a quite intuitive architecture. This architecture involves a fact table and dimensions and is called star architecture or star schema. For instance, for a supermarket chain, the Food Mart example available for Microsoft OLAP systems. The fact table stores numeric values henceforth called measures. These measures are numeric attributes of facts concerning the business involved. For instance, for a supermarket, the sell of each product could be regarded as a fact to be stored for further analysis and price, discount, weight and number of units its numeric attributes. Dimension tables provide the relation between the fact and its features. In the example of a supermarket chain, we could regard Customer, Store, Product, Data and Time as dimensions for the fact we chose to store. These dimensions traditionally have attributes concerning the sell of a product. For instance, we can analyze the sell of food products (attribute of Product dimension) according to married and single customers (since gender is an attribute of the Customer dimension). This allows us to built reports as the one shown in Picture 2.
3 Analysis Manager There are several tools for creating OLAP system according to a star schema. Microsoft makes available the Analysis Manager tool for using with her database systems created by Access or SQL Server systems. It is also possible to work with data imported from other formats and systems. This tool, combined with Excel or FrontPage, becomes an intuitive front end system for building reports from the data stored in the data warehouse. Analysis Manager uses a formal language called MDX (multidimensional expression) for building reports. Most of time, the usage of this language is transparent to users since they may remain completely unaware about its existence. Nevertheless, when we want to use the full potential of Analysis Manager, MDX may become a necessary and visible tool. For instance, MDX is essential when we want to create new measures based in calculations over already existing measures. Some complex reports may need the usage of MDX too. This language has functions that are able to execute very useful operations, like the ordering of the members, the creation of new calculated measures based in hierarchies, the exhibit of data according to filters based on criteria defined by the user, among others. Nevertheless, MDX is a formal computing language. The usage of such language requires an IT expert and therefore contradicts our previous wish of data and specific reports available to everybody. The ideal result would be to combine the many possibilities offered by the MDX functions with the facilities offered by the interfaces of the familiar programs of Microsoft. How complex Analysis Manager can be Let s analyze a scenario where the usage of analysis manager may become hard for non-it experts. Suppose we are interesting in obtaining the two top selling states from February to June of the year 1998 in a supermarket chain. In order to illustrate, we are going to use again the largely available Microsoft Foodmart 2000 OLAP database, and its cube Sales. First, the software does not allow us to select only these two months. We can either select the whole level or one member of this level. Therefore, it is possible to select a specific Quarter or to view data concerning all months but not only the two selected months. In order to achieve such result, we should run the following MDX Query: WITH MEMBER [Measures].[Store Sales 1998 Feb-Jun] AS SUM([Time].[1998].[Q1].[2]:[Time].[1998].[Q2].[6],[Measures].[ Store Sales]) SELECT {[Store Sales 1998 Feb-Jun]} ON COLUMNS, {[Store].[USA].Children} ON ROWS FROM [Sales] Despite the Microsoft claims that MDX is intuitive and easy to understand we believe mangers have difficulties in dealing with such languages since even the ordinary macro languages, available in Excel spreadsheets, are known only by a minority of the users. Some Excel features, as pivot tables and reports, are known only by 10% of the users! Using other programs, like Excel, for example, the selection of these specific members, months ranging from February to 402
4 June, would be quite simple. So, until this point we would not encounter much trouble, although we would have already left the Analysis Manager interface. However, when filtering the two top selling states, we would have no other choice. Excel does not have a tool to aid us either. Therefore, we would have to use an expression with even more complex functions, as shown bellow: {TOPCOUNT ([State]. [USA].CHILDREN, 2,[Store Sales 1998 Feb-Jun]} With this expression (TOPCOUNT) the two top selling states will be filtered. Now, putting the two expressions together: WITH MEMBER [Measures].[Store Sales 1998 Feb-Jun] AS SUM([Time].[1998].[Q1].[2]:[Time].[1998].[Q2].[6],[Measures].[ Store Sales]) SELECT {[Store Sales 1998 Feb-Jun]} ON COLUMNS, {TOPCOUNT([Store].[USA].Children,2,[Store Sales 1998 Feb-Jun])} ON ROWS FROM [Sales] We finally achieved the desired result; however, our old wish of data and specific reports available to everybody would not be fulfilled. There are programs that work as an interface between the users and a complex data warehouse like the one we are analyzing. Nevertheless, in a scenario similar to the one shown above, the only option would be the use of the MDX language. New software Parameters The existing programs that work with OLAP systems using MDX may seem complicated for less experienced users, limiting its resources. However, the simplification that is being presented is not based in the translation of all the existing functions nor of all possible queries in order to satisfy the needs of these users. A research of Microsoft reports was made in order to reduce the overall set of MDX functions to the most used. Common sense was also considered in the definition of this restricted set of MDX functions. The development of a more user-friendly interface is intended to improve user understanding about queries. Using no formal language and more familiar terms, we intend to facilitate the construction of queries and reports through what Microsoft calls a Wizard. A wizard may be understood as an interface which guides the users during the specification of a process, in our case a MDX query. Besides such Wizards we also specified an interface where the same queries may be easily carried. This interface holds a strong similarity with the Wizard s interface. With all of the above in mind, simple tools that satisfy these requirements were developed. In order to facilitate the understanding of these tools, during its development, the MDX functions were separated in two categories: visualization and new calculated measures. 403
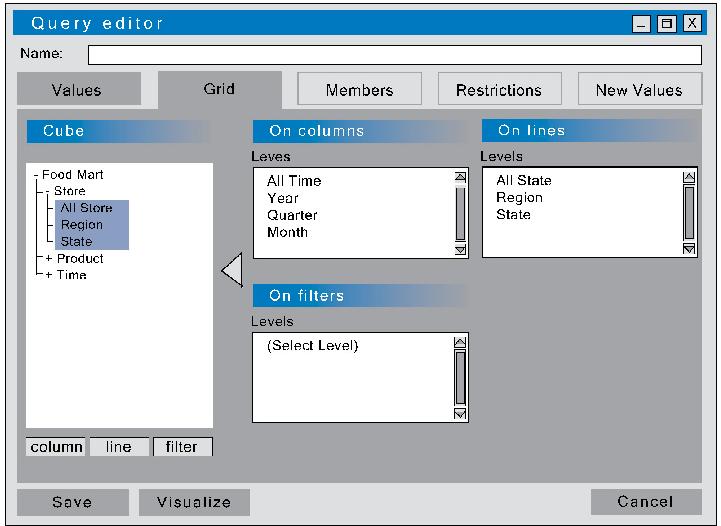
5 The calculated measures category was reduced to pre-formulated models of the top used measures (averages, percentages, sums and subtractions of values, etc.) This action was taken to allow users to make relevant calculations without the use of formulae. More complex formulas will be available, but only the ones that are necessary to fulfill the basic needs of these users. The visualization category was afterwards subdivided into the following sub-categories: visualization through dimensions (selects the dimensions in each field), visualization by members (selects exactly which members and which parts of the hierarchy will be available), visualization by criteria (filtering the data by different criteria, e.g.: higher, lower, first, last, etc.) and visualization models (pre-formulated suggestions of visualizations for the user). Interface The developed interface consists on a Wizard with different tools available in each of its tabs. The first tab identifies the analyzed measures (which were renamed as VALUES for a better understanding). The second tab (GRID) selects the dimensions and the hierarchy levels that will be shown on the report axes (visualization by dimensions). The third tab (MEMBERS) will define exactly which members of each level should be selected (visualization by members). The fourth tab (RESTRICTIONS) has filters that hide, highlight or restrict the data based on criteria defined by the user (visualization by criteria). Another tab (NEW VALUES), still in development, will allow the user to create new calculated measures using the existing data, the available pre-generated formulae, and its junctions (calculated measures). The RESTRICTION and NEW VALUES tabs are similar. Both are based on the translation of MDX formulae into simple terms. Using this method, the user will provide the data necessary for the formulae when filling out sentences that describe their needs. The Wizard is available in a wider interface. This interface will provide the same tools, whilst also allowing the management of queries and reports. When a grid is finalized, it is saved as a query inside the current file, allowing future comparisons and modifications. Graphics that illustrate these data will be available along with the correspondent grids. The information contained in each query can also be compared using intersection, subtraction and addition tools. The developed program may not fulfill every user s necessity, but it will make most of its queries a lot easier. Using the new interface In order to illustrate how these new tools work, we are going to exemplify its usage with the same query concerning a report the two top selling states between the months of February and June in We start selecting the first tab (VALUES) and select the analyzed measure - Store Sales (picture 3). On the second tab (GRID), we define the Time dimension (from the level All until the level Month ) on columns and the Store dimension (from the level All Store until the level State ) on lines. Filters are not necessary for this query. (picture 4) 404
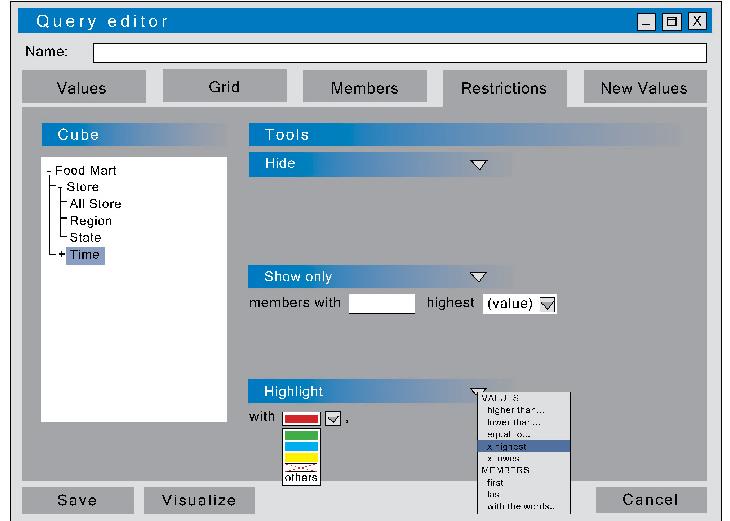
6 Then we select the Time dimension on the third tab (MEMBERS) and follow its hierarchy until the Year level. Then we select the year of 1998, and click on the arrow to continue our trip down the hierarchy. Then we select the months of February (2) through June (6), holding down the shift key. (picture 5) In order to view the sum of sales reffering to this period, it will be necessary to create a new calculated mesasures, so we will select the fifth tab (NEW VALUES). We will call this generated value Store Sales 1998 Feb-Jun, by filling out the Name text box. On the Analysing... section we will select the apparent data option, which will work only on the already selected information. On the Calculate... section we select the sum option. This will give us the following sentence: the sum of (value) of (members) of the (select dimension) dimension. On the value dropdown box we will select the desired measure ( Store Sales ), on the members dropdown box we will select apparent members, and, on the select dimension dropdown box we will select the Time dimension. This will give us the desired sum. On the fourth tab we can restrict the apparent data to the two top selling states. On the show only section, we will select the x highest function (in the member column). This will give us the following sentence: members with the highest (value). On the text box, we will select the amount of desired members ( 2 in this case), and, on the (value) dropdown box, we will select the desired measure ( Store Sales 1998 Feb-Jun ). (picture 6) With these steps finished, we will get the desired grid, without writing any formula, and concluding that the states WA and CA are the top selling states in this period. Conclusion The main purpose of this work is to try to of avoid any contact between users and MDX formalism. This may become a hard task when some complex (but still common) functions are required, since those functions are not directly available on the main interface. This problem was solved by the usage of Wizards that provide these functions in an informal way. The software was broken down into different components, according to its tools. These components can be used separately, being integrated into other softwares that allow add-ins, like Excel, for example. This software was programmed using the VB.Net language. The program can use other OLAP databases, but an OLAP system based in SQL Server 2005 was used. Although some problems were solved by this interface, there is a lot of room for improvement and new solutions regarding interfacing OLAP systems. A new path to be traced is the development of interfaces with specific functions for each management area. The Human Resources (HR) field is already being explored on further enhancements of this interface. Basically, we are creating a specific interface for HR, where the most common calculations involving this area are translated into MDX by simple wizards. We believe that enterprise areas (like HR, Sales, Marketing, etc) have specific variables but also share some common calculations with the remaining areas 405

7 Picture Picture 2

8 Picture 3 Picture 4 407

9 Picture Picture 6
10 Bibliography WHITEHORN, Mark.; ZARE, Robert.; PASUMANSKY, Mosha., Fast Track to MDX. EUA: Springer, JACOBSON, Reed., Microsoft SQL Server 2005 Analysis Services. EUA: Microsoft Press SPOFFORD, George., MDX Solutions. EUA: John Wiley & Sons inc
SQL Server Analysis Services
 DataBase and Data Mining Group of DataBase and Data Mining Group of Database and data mining group, SQL Server 2005 Analysis Services SQL Server 2005 Analysis Services - 1 Analysis Services Database and
Fig 1.2: Relationship between DW, ODS and OLTP Systems
 1.4 DATA WAREHOUSES Data warehousing is a process for assembling and managing data from various sources for the purpose of gaining a single detailed view of an enterprise. Although there are several definitions
Chapter 3. The Multidimensional Model: Basic Concepts. Introduction. The multidimensional model. The multidimensional model
 Chapter 3 The Multidimensional Model: Basic Concepts Introduction Multidimensional Model Multidimensional concepts Star Schema Representation Conceptual modeling using ER, UML Conceptual modeling using
Getting Started Guide. ProClarity Analytics Platform 6. ProClarity Professional
 ProClarity Analytics Platform 6 ProClarity Professional Note about printing this PDF manual: For best quality printing results, please print from the version 6.0 Adobe Reader. Getting Started Guide Acknowledgements
BUSINESS INTELLIGENCE. SSAS - SQL Server Analysis Services. Business Informatics Degree
 BUSINESS INTELLIGENCE SSAS - SQL Server Analysis Services Business Informatics Degree 2 BI Architecture SSAS: SQL Server Analysis Services 3 It is both an OLAP Server and a Data Mining Server Distinct
CHAPTER 8 DECISION SUPPORT V2 ADVANCED DATABASE SYSTEMS. Assist. Prof. Dr. Volkan TUNALI
 CHAPTER 8 DECISION SUPPORT V2 ADVANCED DATABASE SYSTEMS Assist. Prof. Dr. Volkan TUNALI Topics 2 Business Intelligence (BI) Decision Support System (DSS) Data Warehouse Online Analytical Processing (OLAP)
REPORTING AND QUERY TOOLS AND APPLICATIONS
 Tool Categories: REPORTING AND QUERY TOOLS AND APPLICATIONS There are five categories of decision support tools Reporting Managed query Executive information system OLAP Data Mining Reporting Tools Production
Chapter 3. Databases and Data Warehouses: Building Business Intelligence
 Chapter 3 Databases and Data Warehouses: Building Business Intelligence How Can a Business Increase its Intelligence? Summary Overview of Main Concepts Details/Design of a Relational Database Creating
Multidimensional Queries
 Multidimensional Queries Krzysztof Dembczyński Intelligent Decision Support Systems Laboratory (IDSS) Poznań University of Technology, Poland Software Development Technologies Master studies, first semester
Implementing Data Models and Reports with SQL Server 2014
 Course 20466D: Implementing Data Models and Reports with SQL Server 2014 Page 1 of 6 Implementing Data Models and Reports with SQL Server 2014 Course 20466D: 4 days; Instructor-Led Introduction The focus
Unit 7: Basics in MS Power BI for Excel 2013 M7-5: OLAP
 Unit 7: Basics in MS Power BI for Excel M7-5: OLAP Outline: Introduction Learning Objectives Content Exercise What is an OLAP Table Operations: Drill Down Operations: Roll Up Operations: Slice Operations:
Product Documentation SAP Business ByDesign August Analytics
 Product Documentation PUBLIC Analytics Table Of Contents 1 Analytics.... 5 2 Business Background... 6 2.1 Overview of Analytics... 6 2.2 Overview of Reports in SAP Business ByDesign... 12 2.3 Reports
Data Warehousing. Overview
 Data Warehousing Overview Basic Definitions Normalization Entity Relationship Diagrams (ERDs) Normal Forms Many to Many relationships Warehouse Considerations Dimension Tables Fact Tables Star Schema Snowflake
Developing SQL Data Models
 Developing SQL Data Models 20768B; 3 Days; Instructor-led Course Description The focus of this 3-day instructor-led course is on creating managed enterprise BI solutions. It describes how to implement
Basics of Dimensional Modeling
 Basics of Dimensional Modeling Data warehouse and OLAP tools are based on a dimensional data model. A dimensional model is based on dimensions, facts, cubes, and schemas such as star and snowflake. Dimension
MICROSOFT? OLAP SOLUTIONS BY ERIK THOMSEN, GEORGE SPOFFORD, DICK CHASE
 MICROSOFT? OLAP SOLUTIONS BY ERIK THOMSEN, GEORGE SPOFFORD, DICK CHASE DOWNLOAD EBOOK : MICROSOFT? OLAP SOLUTIONS BY ERIK THOMSEN, GEORGE SPOFFORD, DICK CHASE PDF Click link bellow and free register to
Data Warehousing and Decision Support (mostly using Relational Databases) CS634 Class 20
 CS634 Class 20") Data Warehousing and Decision Support (mostly using Relational Databases) CS634 Class 20 Slides based on Database Management Systems 3 rd ed, Ramakrishnan and Gehrke, Chapter 25 Introduction Increasingly,
Data Warehousing and Decision Support (mostly using Relational Databases) CS634 Class 20 Slides based on Database Management Systems 3 rd ed, Ramakrishnan and Gehrke, Chapter 25 Introduction Increasingly,
SQL Server 2005 Analysis Services
 atabase and ata Mining Group of atabase and ata Mining Group of atabase and ata Mining Group of atabase and ata Mining Group of atabase and ata Mining Group of atabase and ata Mining Group of SQL Server
Xcelerated Business Insights (xbi): Going beyond business intelligence to drive information value
: Going beyond business intelligence to drive information value") KNOWLEDGENT INSIGHTS volume 1 no. 5 October 7, 2011 Xcelerated Business Insights (xbi): Going beyond business intelligence to drive information value Today s growing commercial, operational and regulatory
KNOWLEDGENT INSIGHTS volume 1 no. 5 October 7, 2011 Xcelerated Business Insights (xbi): Going beyond business intelligence to drive information value Today s growing commercial, operational and regulatory
Data Mining Concepts & Techniques
 Data Mining Concepts & Techniques Lecture No. 01 Databases, Data warehouse Naeem Ahmed Email: naeemmahoto@gmail.com Department of Software Engineering Mehran Univeristy of Engineering and Technology Jamshoro
Filtering, Sorting and Ranking
 Filtering, Sorting and Ranking Content: THE PRINCIPLES FILTERING/RANKING/SORTING... 2 EXAMPLE... 3 Step 1: Simple Filtering... 3 Step 2: Sorting on a different dimension... 5 Step 3: Combining Ranking,
Implementing and Maintaining Microsoft SQL Server 2008 Analysis Services
 Course 6234A: Implementing and Maintaining Microsoft SQL Server 2008 Analysis Services Course Details Course Outline Module 1: Introduction to Microsoft SQL Server Analysis Services This module introduces
Advanced Multidimensional Reporting
 Guideline Advanced Multidimensional Reporting Product(s): IBM Cognos 8 Report Studio Area of Interest: Report Design Advanced Multidimensional Reporting 2 Copyright Copyright 2008 Cognos ULC (formerly
CHAPTER 8: ONLINE ANALYTICAL PROCESSING(OLAP)
") CHAPTER 8: ONLINE ANALYTICAL PROCESSING(OLAP) INTRODUCTION A dimension is an attribute within a multidimensional model consisting of a list of values (called members). A fact is defined by a combination
CHAPTER 8: ONLINE ANALYTICAL PROCESSING(OLAP) INTRODUCTION A dimension is an attribute within a multidimensional model consisting of a list of values (called members). A fact is defined by a combination
Data warehouse architecture consists of the following interconnected layers:
 Architecture, in the Data warehousing world, is the concept and design of the data base and technologies that are used to load the data. A good architecture will enable scalability, high performance and
1. Analytical queries on the dimensionally modeled database can be significantly simpler to create than on the equivalent nondimensional database.
 1. Creating a data warehouse involves using the functionalities of database management software to implement the data warehouse model as a collection of physically created and mutually connected database
Chapter 3: AIS Enhancements Through Information Technology and Networks
 Accounting Information Systems: Essential Concepts and Applications Fourth Edition by Wilkinson, Cerullo, Raval, and Wong-On-Wing Chapter 3: AIS Enhancements Through Information Technology and Networks
Chapter-2 Digital Data Analysis
 Chapter-2 Digital Data Analysis 1. Securing Spreadsheets How to Password Protect Excel Files Encrypting and password protecting Microsoft Word and Excel files is a simple matter. There are a couple of
Creating a Spreadsheet by Using Excel
 The Excel window...40 Viewing worksheets...41 Entering data...41 Change the cell data format...42 Select cells...42 Move or copy cells...43 Delete or clear cells...43 Enter a series...44 Find or replace
Data Warehousing and Decision Support. Introduction. Three Complementary Trends. [R&G] Chapter 23, Part A
![Data Warehousing and Decision Support. Introduction. Three Complementary Trends. [R&G] Chapter 23, Part A](/thumbs/75/72474087.jpg "Data Warehousing and Decision Support. Introduction. Three Complementary Trends. [R&G] Chapter 23, Part A") Data Warehousing and Decision Support [R&G] Chapter 23, Part A CS 432 1 Introduction Increasingly, organizations are analyzing current and historical data to identify useful patterns and support business
Data Warehousing and Decision Support [R&G] Chapter 23, Part A CS 432 1 Introduction Increasingly, organizations are analyzing current and historical data to identify useful patterns and support business
Rocky Mountain Technology Ventures
 Rocky Mountain Technology Ventures Comparing and Contrasting Online Analytical Processing (OLAP) and Online Transactional Processing (OLTP) Architectures 3/19/2006 Introduction One of the most important
Data Warehouses Chapter 12. Class 10: Data Warehouses 1
 Data Warehouses Chapter 12 Class 10: Data Warehouses 1 OLTP vs OLAP Operational Database: a database designed to support the day today transactions of an organization Data Warehouse: historical data is
6+ years of experience in IT Industry, in analysis, design & development of data warehouses using traditional BI and self-service BI.
 SUMMARY OF EXPERIENCE 6+ years of experience in IT Industry, in analysis, design & development of data warehouses using traditional BI and self-service BI. 1.6 Years of experience in Self-Service BI using
MIS2502: Data Analytics Dimensional Data Modeling. Jing Gong
 MIS2502: Data Analytics Dimensional Data Modeling Jing Gong gong@temple.edu http://community.mis.temple.edu/gong Where we are Now we re here Data entry Transactional Database Data extraction Analytical
The strategic advantage of OLAP and multidimensional analysis
 IBM Software Business Analytics Cognos Enterprise The strategic advantage of OLAP and multidimensional analysis 2 The strategic advantage of OLAP and multidimensional analysis Overview Online analytical
Data Warehousing and Decision Support
 Data Warehousing and Decision Support Chapter 23, Part A Database Management Systems, 2 nd Edition. R. Ramakrishnan and J. Gehrke 1 Introduction Increasingly, organizations are analyzing current and historical
Data Warehousing & OLAP
 CMPUT 391 Database Management Systems Data Warehousing & OLAP Textbook: 17.1 17.5 (first edition: 19.1 19.5) Based on slides by Lewis, Bernstein and Kifer and other sources University of Alberta 1 Why
COURSE 20466D: IMPLEMENTING DATA MODELS AND REPORTS WITH MICROSOFT SQL SERVER
 ABOUT THIS COURSE The focus of this five-day instructor-led course is on creating managed enterprise BI solutions. It describes how to implement multidimensional and tabular data models, deliver reports
GuruFocus User Manual: The FilingWiz
 GuruFocus User Manual: The FilingWiz Contents 0. Introduction to FilingWiz a. Brief overview b. Access 1. The Search Query Toolbox 2. The Search Results Column 3. The Highlights Column a. Highlights tab
Data Warehousing and Decision Support
 Data Warehousing and Decision Support [R&G] Chapter 23, Part A CS 4320 1 Introduction Increasingly, organizations are analyzing current and historical data to identify useful patterns and support business
Desktop Studio: Charts
 Desktop Studio: Charts Intellicus Enterprise Reporting and BI Platform Intellicus Technologies info@intellicus.com www.intellicus.com Working with Charts i Copyright 2011 Intellicus Technologies This document
Quality Gates User guide
 Quality Gates 3.3.5 User guide 06/2013 1 Table of Content 1 - Introduction... 4 2 - Navigation... 5 2.1 Navigation tool bar... 5 2.2 Navigation tree... 5 2.3 Folder Tree... 6 2.4 Test history... 7 3 -
Using the Palladium Business Intelligence Functionality
 Using the Palladium Business Intelligence Functionality This document will assist in using Palladium s Business Intelligence Module. The function of the module is to allow you a view into your data with
20466C - Version: 1. Implementing Data Models and Reports with Microsoft SQL Server
 20466C - Version: 1 Implementing Data Models and Reports with Microsoft SQL Server Implementing Data Models and Reports with Microsoft SQL Server 20466C - Version: 1 5 days Course Description: The focus
EDIT202 Spreadsheet Lab Prep Sheet
 EDIT202 Spreadsheet Lab Prep Sheet While it is clear to see how a spreadsheet may be used in a classroom to aid a teacher in marking (as your lab will clearly indicate), it should be noted that spreadsheets
Desktop Studio: Charts. Version: 7.3
 Desktop Studio: Charts Version: 7.3 Copyright 2015 Intellicus Technologies This document and its content is copyrighted material of Intellicus Technologies. The content may not be copied or derived from,
A Benchmarking Criteria for the Evaluation of OLAP Tools
 A Benchmarking Criteria for the Evaluation of OLAP Tools Fiaz Majeed Department of Information Technology, University of Gujrat, Gujrat, Pakistan. Email: fiaz.majeed@uog.edu.pk Abstract Generating queries
DEVELOPING SQL DATA MODELS
 20768 - DEVELOPING SQL DATA MODELS CONTEÚDO PROGRAMÁTICO Module 1: Introduction to Business Intelligence and Data Modeling This module introduces key BI concepts and the Microsoft BI product suite. Introduction
Viságe.BIT. An OLAP/Data Warehouse solution for multi-valued databases
 Viságe.BIT An OLAP/Data Warehouse solution for multi-valued databases Abstract : Viságe.BIT provides data warehouse/business intelligence/olap facilities to the multi-valued database environment. Boasting
OLAP Introduction and Overview
 1 CHAPTER 1 OLAP Introduction and Overview What Is OLAP? 1 Data Storage and Access 1 Benefits of OLAP 2 What Is a Cube? 2 Understanding the Cube Structure 3 What Is SAS OLAP Server? 3 About Cube Metadata
USING ODBC COMPLIANT SOFTWARE MINTRAC PLUS CONTENTS:
 CONTENTS: Summary... 2 Microsoft Excel... 2 Creating a New Spreadsheet With ODBC Data... 2 Editing a Query in Microsoft Excel... 9 Quattro Pro... 12 Creating a New Spreadsheet with ODBC Data... 13 Editing
Implementing Data Models and Reports with Microsoft SQL Server 2012
 CÔNG TY CỔ PHẦN TRƯỜNG CNTT TÂN ĐỨC TAN DUC INFORMATION TECHNOLOGY SCHOOL JSC LEARN MORE WITH LESS! Course 10778: Implementing Data Models and Reports with Microsoft SQL Server 2012 Length: 5 Days Audience:
Excel 2007 Pivot Table Include New Items Manual Filter
 Excel 2007 Pivot Table Include New Items Manual Filter Sample Excel VBA programming to change pivot table report filters. Instead of manually changing the report filters in a pivot table, you can use Excel
Formulas, LookUp Tables and PivotTables Prepared for Aero Controlex
 Basic Topics: Formulas, LookUp Tables and PivotTables Prepared for Aero Controlex Review ribbon terminology such as tabs, groups and commands Navigate a worksheet, workbook, and multiple workbooks Prepare
Adnan YAZICI Computer Engineering Department
 Data Warehouse Adnan YAZICI Computer Engineering Department Middle East Technical University, A.Yazici, 2010 Definition A data warehouse is a subject-oriented integrated time-variant nonvolatile collection
Developing SQL Data Models
 Course 20768B: Developing SQL Data Models Page 1 of 5 Developing SQL Data Models Course 20768B: 2 days; Instructor-Led Introduction The focus of this 2-day instructor-led course is on creating managed
MIS2502: Data Analytics Dimensional Data Modeling. Jing Gong
 MIS2502: Data Analytics Dimensional Data Modeling Jing Gong gong@temple.edu http://community.mis.temple.edu/gong Where we are Now we re here Data entry Transactional Database Data extraction Analytical
Excel 2007/2010. Don t be afraid of PivotTables. Prepared by: Tina Purtee Information Technology (818)
") Information Technology MS Office 2007/10 Users Guide Excel 2007/2010 Don t be afraid of PivotTables Prepared by: Tina Purtee Information Technology (818) 677-2090 tpurtee@csun.edu [ DON T BE AFRAID OF
Information Technology MS Office 2007/10 Users Guide Excel 2007/2010 Don t be afraid of PivotTables Prepared by: Tina Purtee Information Technology (818) 677-2090 tpurtee@csun.edu [ DON T BE AFRAID OF
Deccansoft Software Services Microsoft Silver Learning Partner. SSAS Syllabus
 Overview: Analysis Services enables you to analyze large quantities of data. With it, you can design, create, and manage multidimensional structures that contain detail and aggregated data from multiple
Course Contents: 1 Business Objects Online Training
 IQ Online training facility offers Business Objects online training by trainers who have expert knowledge in the Business Objects and proven record of training hundreds of students Our Business Objects
Chapter 3: The IF Function and Table Lookup
 Chapter 3: The IF Function and Table Lookup Objectives This chapter focuses on the use of IF and LOOKUP functions, while continuing to introduce other functions as well. Here is a partial list of what
Implementing and Maintaining Microsoft SQL Server 2005 Analysis Services
 Implementing and Maintaining Microsoft SQL Server 2005 Analysis Services Introduction Elements of this syllabus are subject to change. This three-day instructor-led course teaches students how to implement
Enterprise Informatization LECTURE
 Enterprise Informatization LECTURE Piotr Zabawa, PhD. Eng. IBM/Rational Certified Consultant e-mail: pzabawa@pk.edu.pl www: http://www.pk.edu.pl/~pzabawa/en 07.10.2011 Lecture 5 Analytical tools in business
Data Warehouses, OLAP, and You Leslie Koorhan
 Seite 1 von 6 Issue Date: FoxTalk September 2000 Data Warehouses, OLAP, and You Leslie Koorhan lkoorhan@earthlink.net In this final installment of a series, Leslie Koorhan explains the twin pillars of
CIS 611: ENTERPRISE DATABASE AND DATA WAREHOUSING. Project: Multidimensional OLAP Cube using Adventure Works Data Warehouse
 CIS 611: ENTERPRISE DATABASE AND DATA WAREHOUSING Project: Multidimensional OLAP Cube using Adventure Works Data Warehouse Overview: A data warehouse is a centralized repository that stores data from multiple
Cube Designer User Guide SAP BusinessObjects Financial Consolidation, Cube Designer 10.0
 Cube Designer User Guide SAP BusinessObjects Financial Consolidation, Cube Designer 10.0 Copyright 2011 SAP AG. All rights reserved.sap, R/3, SAP NetWeaver, Duet, PartnerEdge, ByDesign, SAP BusinessObjects
Microsoft SQL Server Training Course Catalogue. Learning Solutions
 Training Course Catalogue Learning Solutions Querying SQL Server 2000 with Transact-SQL Course No: MS2071 Two days Instructor-led-Classroom 2000 The goal of this course is to provide students with the
Data transfer, storage and analysis for data mart enlargement
 Data transfer, storage and analysis for data mart enlargement PROKOPOVA ZDENKA, SILHAVY PETR, SILHAVY RADEK Department of Computer and Communication Systems Faculty of Applied Informatics Tomas Bata University
Overview of Reporting in the Business Information Warehouse
 Overview of Reporting in the Business Information Warehouse Contents What Is the Business Information Warehouse?...2 Business Information Warehouse Architecture: An Overview...2 Business Information Warehouse
InfoSphere Warehouse V9.5 Exam.
 IBM 000-719 InfoSphere Warehouse V9.5 Exam TYPE: DEMO http://www.examskey.com/000-719.html Examskey IBM 000-719 exam demo product is here for you to test the quality of the product. This IBM 000-719 demo
Instructions for Using the Databases
 Appendix D Instructions for Using the Databases Two sets of databases have been created for you if you choose to use the Documenting Our Work forms. One set is in Access and one set is in Excel. They are
Proceedings of the IE 2014 International Conference AGILE DATA MODELS
 AGILE DATA MODELS Mihaela MUNTEAN Academy of Economic Studies, Bucharest mun61mih@yahoo.co.uk, Mihaela.Muntean@ie.ase.ro Abstract. In last years, one of the most popular subjects related to the field of
Q: Which month has the lowest sale? Answer: Q:There are three consecutive months for which sale grow. What are they? Answer: Q: Which month
 Lecture 1 Q: Which month has the lowest sale? Q:There are three consecutive months for which sale grow. What are they? Q: Which month experienced the biggest drop in sale? Q: Just above November there
Working with Data and Charts
 PART 9 Working with Data and Charts In Excel, a formula calculates a value based on the values in other cells of the workbook. Excel displays the result of a formula in a cell as a numeric value. A function
Introduction to Microsoft Excel 2007
 Introduction to Microsoft Excel 2007 Microsoft Excel is a very powerful tool for you to use for numeric computations and analysis. Excel can also function as a simple database but that is another class.
Analytic Workspace Manager and Oracle OLAP 10g. An Oracle White Paper November 2004
 Analytic Workspace Manager and Oracle OLAP 10g An Oracle White Paper November 2004 Analytic Workspace Manager and Oracle OLAP 10g Introduction... 3 Oracle Database Incorporates OLAP... 4 Oracle Business
Microsoft Excel 2016 LEVEL 3
 TECH TUTOR ONE-ON-ONE COMPUTER HELP COMPUTER CLASSES Microsoft Excel 2016 LEVEL 3 kcls.org/techtutor Microsoft Excel 2016 Level 3 Manual Rev 11/2017 instruction@kcls.org Microsoft Excel 2016 Level 3 Welcome
Jet Data Manager 2014 Product Enhancements
 Jet Data Manager 2014 Product Enhancements Table of Contents Overview of New Features... 3 New Standard Features in Jet Data Manager 2014... 3 Additional Features Available for Jet Data Manager 2014...
Tableau Metadata Model
 Tableau Metadata Model Author: Marc Reuter Senior Director, Strategic Solutions, Tableau Software p2 Most Business Intelligence platforms fall into one of two metadata camps: either model the entire enterprise
MOLAP Data Warehouse of a Software Products Servicing Call Center
 MOLAP Data Warehouse of a Software Products Servicing Call Center Z. Kazi, B. Radulovic, D. Radovanovic and Lj. Kazi Technical faculty "Mihajlo Pupin" University of Novi Sad Complete Address: Technical
IDU0010 ERP,CRM ja DW süsteemid Loeng 5 DW concepts. Enn Õunapuu
 IDU0010 ERP,CRM ja DW süsteemid Loeng 5 DW concepts Enn Õunapuu enn.ounapuu@ttu.ee Content Oveall approach Dimensional model Tabular model Overall approach Data modeling is a discipline that has been practiced
Decision Support Systems aka Analytical Systems
 Decision Support Systems aka Analytical Systems Decision Support Systems Systems that are used to transform data into information, to manage the organization: OLAP vs OLTP OLTP vs OLAP Transactions Analysis
Shopping Cart: Queries, Personalizations, Filters, and Settings
 Shopping Cart: Queries, Personalizations, Filters, and Settings on the Shopping Cart Home Page Use this Job Aid to: Learn how to organize the Shopping Cart home page so that it is easier to use. BEFORE
CHAPTER 6 DATABASE MANAGEMENT SYSTEMS
 CHAPTER 6 DATABASE MANAGEMENT SYSTEMS Management Information Systems, 10 th edition, By Raymond McLeod, Jr. and George P. Schell 2007, Prentice Hall, Inc. 1 Learning Objectives Understand the hierarchy
TDWI Data Modeling. Data Analysis and Design for BI and Data Warehousing Systems
 Data Analysis and Design for BI and Data Warehousing Systems Previews of TDWI course books offer an opportunity to see the quality of our material and help you to select the courses that best fit your
As your databases continue to evolve, you will need to incorporate advanced queries and reports. This chapter addresses how to create and use action
 As your databases continue to evolve, you will need to incorporate advanced queries and reports. This chapter addresses how to create and use action queries and how to create queries that perform more
Taking a First Look at Excel s Reporting Tools
 CHAPTER 1 Taking a First Look at Excel s Reporting Tools This chapter provides you with an overview of Excel s reporting features. It shows you the principal types of Excel reports and how you can use
This module presents the star schema, an alternative to 3NF schemas intended for analytical databases.
 Topic 3.3: Star Schema Design This module presents the star schema, an alternative to 3NF schemas intended for analytical databases. Star Schema Overview The star schema is a simple database architecture
Data Analysis and Data Science
 Data Analysis and Data Science CPS352: Database Systems Simon Miner Gordon College Last Revised: 4/29/15 Agenda Check-in Online Analytical Processing Data Science Homework 8 Check-in Online Analytical
Table of Contents: Microsoft Power Tools for Data Analysis #15 Comprehensive Introduction to Power Pivot & DAX. Notes from Video:
 Microsoft Power Tools for Data Analysis #15 Comprehensive Introduction to Power Pivot & DAX Table of Contents: Notes from Video: 1) Standard PivotTable or Data Model PivotTable?... 3 2) Excel Power Pivot
How to Create and Use a Pivot Table in Excel
 How to Create and Use a Pivot Table in Excel Nikki Casasanto What you need Microsoft Office: Excel 2013 Data Why use a Pivot Table? Microsoft Excel pivot tables offer a way to quickly summarize data. It
A Tutorial for Excel 2002 for Windows
 INFORMATION SYSTEMS SERVICES Writing Formulae with Microsoft Excel 2002 A Tutorial for Excel 2002 for Windows AUTHOR: Information Systems Services DATE: August 2004 EDITION: 2.0 TUT 47 UNIVERSITY OF LEEDS
SQL Server Business Intelligence 20768: Developing SQL Server 2016 Data Models in SSAS. Upcoming Dates. Course Description.
 SQL Server Business Intelligence 20768: Developing SQL Server 2016 Data Models in SSAS Get the skills needed to successfully create multidimensional databases using Microsoft SQL Server Analysis Services
TERMINOLOGY MANAGEMENT DURING TRANSLATION PROJECTS: PROFESSIONAL TESTIMONY
 LINGUACULTURE, 1, 2010 TERMINOLOGY MANAGEMENT DURING TRANSLATION PROJECTS: PROFESSIONAL TESTIMONY Nancy Matis Abstract This article briefly presents an overview of the author's experience regarding the
Data Warehousing. New Features in SAS/Warehouse Administrator Ken Wright, SAS Institute Inc., Cary, NC. Paper
 Paper 114-25 New Features in SAS/Warehouse Administrator Ken Wright, SAS Institute Inc., Cary, NC ABSTRACT SAS/Warehouse Administrator 2.0 introduces several powerful new features to assist in your data
Lesson 1: Creating and formatting an Answers analysis
 Lesson 1: Creating and formatting an Answers analysis Answers is the ad-hoc query environment in the OBIEE suite. It is in Answers that you create and format analyses to help analyze business results.
download instant at
 CHAPTER 1 - LAB SESSION INTRODUCTION TO EXCEL INTRODUCTION: This lab session is designed to introduce you to the statistical aspects of Microsoft Excel. During this session you will learn how to enter
Sections in this manual
 1 Sections in this manual Argus Analytics 2 The service 2 Benefits 2 Launching Argus Analytics 3 Search Interface breakdown 4 Add-in Navigation 5 Search: Free text & Facet 5 Search: Facet filter 6 Filters
SAS/Warehouse Administrator Usage and Enhancements Terry Lewis, SAS Institute Inc., Cary, NC
 SAS/Warehouse Administrator Usage and Enhancements Terry Lewis, SAS Institute Inc., Cary, NC ABSTRACT SAS/Warehouse Administrator software makes it easier to build, maintain, and access data warehouses
UNIT
 UNIT 3.1 DATAWAREHOUSING UNIT 3 CHAPTER 1 1.Designing the Target Structure: Data warehouse design, Dimensional design, Cube and dimensions, Implementation of a dimensional model in a database, Relational