Traffic Impact Study for the TAVA Homes Project at 1584 East Santa Clara Avenue in the City of Santa Ana
|
|
|
- Julie May
- 5 years ago
- Views:
Transcription
1 Traffic Impact Study for the TAVA Homes Project at 1584 East Santa Clara Avenue in the City of Santa Ana March 2011 Prepared for: URS Corporation 2020 E. First Street, Suite #400 Santa Ana, CA Tel: (714) Fax: (714) Prepared by: 1120 West La Veta Avenue, Ste. 660 Orange, CA / Phone 714/ Fax Job No: JB13036
2
3 Table of Contents 1. PROJECT DESCRIPTION... 1 PROJECT LOCATION... 1 PROJECT DESCRIPTION PROJECT STUDY METHODOLOGY... 4 STUDY TIMEFRAMES... 4 PROJECT STUDY AREA... 4 Study Intersections:...4 Street Study Segments:...4 ANALYSIS METHODOLOGIES... 4 Intersections...5 Street Segments...5 INTERSECTION AND ROADWAY CAPACITY ANALYSIS... 6 TRAFFIC COUNT DATA... 6 FUTURE TRAFFIC VOLUMES... 6 STANDARDS OF SIGNIFICANCE EXISTING CONDITIONS... 9 EXISTING CIRCULATION NETWORK... 9 EXISTING PEAK HOUR INTERSECTION LEVEL OF SERVICE EXISTING STREET SEGMENT CONDITIONS FUTURE WITHOUT PROJECT CONDITIONS FUTURE GROWTH FUTURE PEAK HOUR INTERSECTION LEVEL OF SERVICE FUTURE STREET SEGMENT CONDITIONS BUILDOUT WITHOUT PROJECT CONDITIONS BUILDOUT PEAK HOUR INTERSECTION LEVEL OF SERVICE BUILDOUT STREET SEGMENT CONDITIONS PROJECT TRIPS PROJECT TRIP GENERATION EXISTING LAND USE TRAFFIC PROJECT TRIP DISTRIBUTION FUTURE WITH PROJECT CONDITIONS FUTURE PEAK HOUR INTERSECTION LEVEL OF SERVICE FUTURE STREET SEGMENT CONDITIONS BUILDOUT WITH PROJECT CONDITIONS BUILDOUT PEAK HOUR INTERSECTION LEVEL OF SERVICE BUILDOUT STREET SEGMENT CONDITIONS i City of Santa Ana/TAVA Homes Traffic Impact Study
4 9. DETERMINATION OF SIGNIFICANT IMPACTS INTERSECTIONS STREET SEGMENTS COST ESTIMATES AND FAIR SHARE ANALYSIS PROJECT RECOMMENDATIONS TRAFFIC SIGNAL WARRANTS PROJECT ACCESS AND INTERNAL CIRCULATION SUMMARY/CONCLUSIONS ii City of Santa Ana/TAVA Homes Traffic Impact Study
5 List of Figures FIGURE 1 - STUDY AREA 2 FIGURE 2 - PROJECT SITE PLAN 3 FIGURE 3 - EXISTING INTERSECTION GEOMETRIES 10 FIGURE 4 - EXISTING AM/PM PEAK HOUR TRAFFIC VOLUMES 13 FIGURE 5 EXISTING DAILY TRAFFIC VOLUMES 15 FIGURE 6 - CUMULATIVE PROJECT LOCATIONS 17 FIGURE 7 - CUMULATIVE PROJECT VOLUMES, AM/PM PEAK HOUR 18 FIGURE 8 - FUTURE WITHOUT PROJECT AM/PM PEAK HOUR TRAFFIC VOLUMES 20 FIGURE 9 FUTURE WITHOUT PROJECT DAILY TRAFFIC VOLUMES 21 FIGURE 10 - BUILDOUT WITHOUT PROJECT AM/PM PEAK HOUR TRAFFIC VOLUMES 24 FIGURE 11 BUILDOUT WITHOUT PROJECT DAILY TRAFFIC VOLUMES 25 FIGURE 12 - PROJECT TRIP DISTRIBUTION, INBOUND 29 FIGURE 13 - PROJECT TRIP DISTRIBUTION, OUTBOUND 30 FIGURE 14 - ADDED AM/PM PEAK HOUR TRAFFIC VOLUMES 31 FIGURE 15 FUTURE WITH PROJECT AM/PM PEAK HOUR TRAFFIC VOLUMES 33 FIGURE 16 FUTURE WITH PROJECT DAILY TRAFFIC VOLUMES 34 FIGURE 17 BUILDOUT WITH PROJECT AM/PM PEAK HOUR TRAFFIC VOLUMES 37 FIGURE 18 BUILDOUT WITH PROJECT DAILY TRAFFIC VOLUMES 38 FIGURE 19 ROUNDABOUT CONCEPT 47 List of Tables TABLE 1 - LEVELS OF SERVICE FOR INTERSECTIONS 5 TABLE 2 - STREET SEGMENT THRESHOLDS/LEVEL OF SERVICE DEFINITIONS 6 TABLE 3 - PEAK HOUR INTERSECTION CONDITIONS EXISTING CONDITIONS (YEAR 2008) 14 TABLE 4 - ROADWAY SEGMENT EXISTING LEVEL OF SERVICE 14 TABLE 5 - CUMULATIVE PROJECTS 16 TABLE 6 - AM/PM PEAK HOUR INTERSECTION PERFORMANCE, FUTURE YEAR WITHOUT PROJECT 19 TABLE 7 - ROADWAY SEGMENT FUTURE WITHOUT PROJECT LEVEL OF SERVICE 22 TABLE 8 - AM/PM PEAK HOUR INTERSECTION PERFORMANCE, BUILDOUT WITHOUT PROJECT 23 TABLE 9 - ROADWAY SEGMENT BUILDOUT WITHOUT PROJECT LEVEL OF SERVICE 26 TABLE 10 - PROJECT TRIP GENERATION 27 TABLE 11 - AM/PM PEAK HOUR INTERSECTION PERFORMANCE, FUTURE WITH PROJECT 32 TABLE 12 - ROADWAY SEGMENT FUTURE WITH PROJECT LEVEL OF SERVICE 35 TABLE 13 - AM/PM PEAK HOUR INTERSECTION PERFORMANCE, BUILDOUT WITH PROJECT 36 TABLE 14 - ROADWAY SEGMENT BUILDOUT WITH PROJECT LEVEL OF SERVICE 39 TABLE 15 - LEVEL OF SERVICE ANALYSIS /DETERMINATION OF IMPACTS, FUTURE AM PEAK HOUR 40 TABLE 16 - LEVEL OF SERVICE ANALYSIS /DETERMINATION OF IMPACTS, FUTURE PM PEAK HOUR 41 TABLE 17 - LEVEL OF SERVICE ANALYSIS /DETERMINATION OF IMPACTS, BUILDOUT AM PEAK HOUR 42 TABLE 18 - LEVEL OF SERVICE ANALYSIS /DETERMINATION OF IMPACTS, BUILDOUT PM PEAK HOUR 43 TABLE 19 - SANTA CLARA AVENUE DAILY TRAFFIC ANALYSIS 44 TABLE 20 - COST ESTIMATE & FAIR SHARE ANALYSIS, SANTA CLARA AVENUE/WRIGHT STREET 45 iii City of Santa Ana/TAVA Homes Traffic Impact Study
6 Appendices Appendix A - Traffic Count Data Appendix B - Intersection Level of Service Worksheets, Existing Conditions Appendix C - Intersection Level of Service Worksheets, Future Year Conditions Appendix D - Future Cumulative Project Information Appendix E Traffic Forecast Appendix F Traffic Signal Warrants iv City of Santa Ana/TAVA Homes Traffic Impact Study
7 1. Project Description The City of Santa Ana has requested a traffic impact study for a proposed residential project consisting of 24 single-family dwelling units on an approximately 5-acre site. The project site is located at 1584 East Santa Clara Avenue, east of Wright Street. Figure 1 shows the vicinity of the proposed project as it relates to the regional circulation network. The appendices of this report contain background materials for this study. These materials include traffic volume counts, level of service analysis worksheets and other data. Project Location The project is located along the south side of Santa Clara Avenue, east of Wright Street. Project Description The proposed project would consist of 24 single-family dwelling units on an approximately 5-acre site. The project site is located at 1584 East Santa Clara Avenue, east of Wright Street, and currently is occupied by one dwelling unit and an orange grove. The project would be accessed via an extension of Lyon Street, passing through the development site from Santa Clara Avenue to Avalon Avenue. Figure 2 shows the project site plan. City of Santa Ana/TAVA Homes 1 Traffic Impact Study
8 La Veta Ave Town & Country Rd 22 Memory Ln Fairhaven Ave Main St Lyon St Santa Clara Ave Tustin Ave 5 Grand Ave Wright St Avalon Ave 17th St 55 4th St 1st St LEGEND N Project Site Study Intersection Not to Scale J:\2011\JB13036 SA TAVA Homes\Analysis\Figure\JB13036_Figure.ai City of Santa Ana TAVA Homes Traffic Impact Study Figure 1 Vicinity Map
9 N J:\2011\JB13036 SA TAVA Homes\Analysis\Figure\JB13036_Figure.ai City of Santa Ana TAVA Homes Traffic Impact Study Not to Scale Figure 2 Site Plan
10 2. Project Study Methodology This chapter documents the methodologies and assumptions used to conduct the traffic impact study for the proposed project. This section contains the following background information: Study timeframes Study area description City of Santa Ana analysis methodologies Study Timeframes This report presents an analysis of the intersection operating conditions during the morning and evening peak hours for the following anticipated timeframes: Existing: Year 2011 Future: Year 2013 Buildout Year 2035 Project Study Area The study area was determined through consultation with City of Santa Ana staff. As shown in Figure 1, the study area consists of the following intersections and their adjacent roadway segments: Study Intersections: East Santa Clara Avenue at Grand Avenue East Santa Clara Avenue at Wright Street East Santa Clara Avenue at Project Access East Santa Clara Avenue at Lyon Street East Santa Clara Avenue at Tustin Avenue Avalon Avenue at Wright Street Street Study Segments: East Santa Clara Avenue between Grand Avenue and Wright Street East Santa Clara Avenue between Wright Street and Project Access East Santa Clara Avenue between Project Access and Tustin Avenue Wright Street south of Santa Clara Avenue Avalon Avenue east of Wright Street Analysis Methodologies This section presents a brief overview of traffic analysis methodologies and concepts used in this study. Street and intersection operating conditions are typically described in terms of level of service. Level of service is a report-card scale used to indicate the quality of traffic flow on roadway segments and at intersections. The levels of service range from Level A (free flow, little congestion) to Level F (forced flow, extreme congestion). City of Santa Ana/TAVA Homes 4 Traffic Impact Study
11 Project Study Methodology Traffic conditions on most roadway facilities are analyzed using the principles or the specific analysis methods contained in the Highway Capacity Manual, 2000 Edition (HCM), a publication of the Transportation Research Board, a research agency affiliated with the Federal Government. Chapter 9 of the HCM is devoted to analysis of signalized intersections and Chapter 10 is devoted to the analysis of unsignalized intersections. The methodology in the HCM for signalized intersections is based upon measurements or forecasts of control delay for traffic utilizing all approaches to the intersection. Intersection average delay and poorest movement delay are reported for all unsignalized intersections. Traffic conditions in Southern California are also often evaluated at signalized intersections using a methodology known as the Intersection Capacity Utilization (ICU) technique. This analysis is widely accepted and essentially measures the amount of traffic signal green time required for the intersection. It is a significant variation from the HCM method; however, it produces results that are generally similar. The City of Santa Ana indicates that studies should analyze signalized intersections by the ICU method with 1,700 vehicles per hour saturation flow rate and 0.05 clearance intervals. It requires all unsignalized intersections to be analyzed by the HCM method. Intersections The City of Santa Ana utilizes the Level of Service and Volume/Capacity criteria for signalized intersections, and delay for unsignalized intersections shown in Table 1. Mitigation measures should be considered when traffic conditions are forecast to exceed the impact guidelines contained in this scale. Table 1 Levels of Service for Intersections Level of Service Signalized Intersection Volume/Capacity Ratio Unsignalized Intersection Control Delay (seconds) A B C D E F 1.01 or greater 50 or more Street Segments For planning purposes the City of Santa Ana has established maximum road capacities for various roadway street classifications corresponding to various Levels of Service. The maximum roadway capacities are based on daily traffic volume, number of lanes and roadway classification, as shown in Table 2 below. City of Santa Ana/TAVA Homes 5 Traffic Impact Study
12 Project Study Methodology Table 2 Street Segment Thresholds/Level of Service Definitions Type of Arterial LOS A LOS B LOS C LOS D LOS E 8 Lanes Divided 45,000 52,500 60,000 67,500 75,000 6 Lanes Divided 33,900 39,400 45,000 50,600 56,300 4 Lanes Divided 22,500 26,300 30,000 33,800 37,500 4 Lanes Undivided 15,000 17,500 20,000 22,500 25,000 2 Lanes Undivided 7,500 8,800 10,000 11,300 12,500 2 Lanes Residential 1,000 1,200 1,500 2,000 2,500 Intersection and Roadway Capacity Analysis The analysis of peak hour intersection conditions was conducted using the TRAFFIX software program developed by Dowling Associates. The following peak periods were selected for analysis: Weekday AM (peak hour between 7:00 AM and 9:00 AM) Weekday PM (peak hour between 4:00 PM and 6:00 PM) Road segments analysis is determined based on the methodology presented in the Orange County MPAH and the City of Santa Ana Circulation Element. V/C ratios are not used in segment analysis. The City of Santa Ana utilizes LOS D as the maximum threshold of significance at all intersections and midblock locations. Traffic Count Data Existing traffic data was obtained from Counts Unlimited of Moreno Valley and from True Counts of San Diego. Daily traffic count data used in this study was collected on Wednesday, February 9, Turning movement traffic data was collected on Thursday, April 10, 2008 and adjusted to 2011 traffic levels based on an average 5.6% growth rate in traffic volumes on study area street segments between April, 2008 and February, All traffic count data is compiled in Appendix A of this report. Future Traffic Volumes Daily and peak hour traffic volumes for Santa Clara Avenue, Grand Avenue, Tustin Avenue, Wright Street and other streets in the study area under future Year 2013 conditions were forecast by first increasing existing traffic volumes by a factor of 1% per year. Then, future relevant project traffic increases that may result from other approved, expected, or proposed major developments in the area were added to the future Year 2013 traffic volumes. To simulate forecast growth conditions for the year 2035, ambient peak hour background traffic volumes were derived from increases indicated from a comparison of the base year and future year City of Santa Ana/TAVA Homes 6 Traffic Impact Study
13 Project Study Methodology Orange County Transportation Authority (OCTA) OCTAM 3.3 traffic models. These increases were applied to existing observed peak hour traffic volumes to forecast buildout without project traffic conditions. The 2035 traffic forecasts were based on the OCTAM 3.3 traffic model and current traffic counts. Trip distribution was based on the OCTAM 3.3 select zone model run and on existing distribution patterns at study intersections. The traffic model was used to produce link volume traffic forecasts in the study area at the AM, PM, and ADT levels, both for a base year model and a future year model. The AM and PM link volume forecasts from the base and future year models, along with the existing turning movement traffic counts, were used as the basis for producing future year traffic volumes. The traffic model forecasts were used to predict future turning movement volumes at the study intersections using a proprietary methodology which adjusts existing turning movement volumes based on expected growth in approach volumes. Standards of Significance Based upon the Circulation and Land Use Elements of the City of Santa Ana General Plan for intersections located outside of Major Development Areas (MDA s), the City considers Level of Service D (LOS D) as the threshold for an acceptable service level outside of MDA s. These criteria are consistent with Measure M target levels, and are either more stringent than, or meet Congestion Management Plan (CMP) criteria which designates LOS E as the minimum acceptable level of service. The study intersections are all located outside of MDA s in the City of Santa Ana. Signalized Intersections The City of Santa Ana s project impact analysis criteria for signalized intersections indicate: A significant project impact occurs when the ICU value increases by greater than.01 and achieves unacceptable level of service ( E or F ). Unsignalized Intersections The City does not have significant impact criteria for unsignalized intersections. This study uses the following criteria: Unsignalized intersection level of service is based upon the control delay, but delay is only assessed for those traffic movements that are stopped or must yield to through traffic. Some movements, including cross traffic on the minor street or left turns onto the major street are acceptable with long delays, provided through traffic and right turns from a major street do not experience any delays at stopped intersections. When delay for cross traffic is severe (Level of Service F), the intersection should be evaluated further for possible improvement with traffic signals. In some cases analysis determines that the delay is being experienced by a very low number of vehicles and traffic signals are not warranted. For this condition, the intersection does not need to be considered impacted, but measures to reduce delay may be considered, if appropriate. In other cases, the number of stopped vehicles is substantial and traffic signals may be justified as a mitigation measure. City of Santa Ana/TAVA Homes 7 Traffic Impact Study
14 Project Study Methodology An unsignalized intersection impact is considered to be significant if the intersection is at LOS E or F, a traffic signal is warranted, and the project contributes added trips at that location. Future added traffic is defined as the increment of traffic added by the project plus other cumulative projects identified in and around the City plus ambient traffic increment of growth that is anticipated to occur by Year A traffic study is required to provide measures to alleviate significant project impacts at intersections to achieve Level of Service D (at the minimum) outside of MDAs.. City of Santa Ana/TAVA Homes 8 Traffic Impact Study
15 3. Existing Conditions This section documents the existing conditions in the study area. The discussion presented here is limited to specific roadways in the project vicinity. Existing Circulation Network Streets in the project vicinity that could be affected by the proposed project include Santa Clara Avenue, Grand Avenue, Tustin Avenue, and Wright Street. Figure 3 shows the existing roadway circulation network and intersection configurations in the study area. Santa Clara Avenue Santa Clara Avenue is an east-west arterial street located north of and adjacent to the project site. The roadway is divided by a two-way left-turn lane, with one lane striped in each direction. Santa Clara Avenue has signalized intersections with Grand Avenue and Tustin Avenue. The signal at Grand Avenue uses protected phasing in the north-south directions, and permitted phasing in the east-west directions. The signal at Tustin Avenue uses protected left-turn phasing in the north-south directions, and permitted phasing in the east-west directions. The posted speed limit on Santa Clara Avenue is 40 mph. Parking is generally allowed along most segments of Santa Clara Avenue in the project vicinity. Pedestrian facilities include parallel-bar style crosswalks and pedestrian push-buttons and signal heads at Grand Avenue and Tustin Avenue. There are no marked crosswalks at Wright Street or Lyon Street. Land use along Santa Clara Avenue is residential west of Wright Street, with a mix of residential, church, agricultural, city park, cemetery, and police facility east of Wright Street. The street has recently been widened and repaved. Street width is sufficient in most segments for two lanes each way, although it is only marked with a single lane each way with a two-way left-turn lane in the center. There is no stripe delineating the shoulder area of the street. It should be noted that motorists have been observed driving parallel to each other along this street (as if there were two marked lanes each way), although the street it is only marked with one lane in each direction. The daily traffic volume along Santa Clara Avenue is approximately 10,700 vehicles per day west of the project site, and 9,000 vehicles per day east of the project site. Grand Avenue Grand Avenue is a major north-south arterial located approximately ½ mile west of the project site. The street provides full access to the SR-22 Freeway about ½ mile north of the project site. In the project vicinity the roadway is divided by a two-way left-turn lane and left-turn pockets. The street provides three lanes northbound and two lanes southbound, with northbound and southbound left turn pockets at Santa Clara Avenue. City of Santa Ana/TAVA Homes 9 Traffic Impact Study
16 S S Fairhaven Ave U U U Santa Clara Ave Grand Ave Avalon Ave Wright St Lyon St Project Site U Tustin Ave 55 LEGEND Project Site Study Intersection N S Signalized Intersection U Un-Signalized Intersection Stop Sign J:\2011\JB13036 SA TAVA Homes\Analysis\Figure\JB13036_Figure.ai City of Santa Ana TAVA Homes Traffic Impact Study Not to Scale Figure 3 Lane Geometry
17 Existing Conditions The intersection of Grand Avenue and Santa Clara Avenue is signalized, with protected phasing in the north-south directions, and permitted phasing in the east-west directions. Pedestrian signal heads, pushbuttons, and parallel-bar-style crosswalks are provided at this intersection. The posted speed limit on Grand Avenue is 40 mph in the project vicinity. On-street parking is not allowed on Grand Avenue in the project vicinity. Land use along Grand Avenue is a primarily commercial and retail, with a large Post Office south of Santa Clara Avenue, and a mix of commercial, retail, office, and multi-family residential north of Santa Clara Avenue. The traffic volume along Grand Avenue is approximately 29,200 vehicles per day north of Santa Clara Avenue, and 26,600 vehicles per day south of Santa Clara Avenue. Tustin Avenue Tustin Avenue is a major north-south arterial located about ½ mile east of the project site. The street provides a partial interchange with the SR-22 Freeway (eastbound off and westbound on only). In the project vicinity the roadway is divided by a two-way left-turn lane and left-turn pockets. The street provides three lanes in each direction with northbound and southbound left turn pockets at Santa Clara Avenue. The intersection of Tustin Avenue with Santa Clara Avenue is signalized, with protected left turn phasing in the north-south directions, and permitted phasing in the east-west directions. Pedestrian signal heads, push-buttons, and parallel-bar-style crosswalks are provided at this intersection. The posted speed limit on Tustin Avenue is 40 mph in the project vicinity. In the project vicinity on-street parking is not allowed on Tustin Avenue. Land use along Tustin Avenue is retail and commercial in the project vicinity. The daily traffic volume along Tustin Avenue is approximately 31,800 vehicles per day north of Santa Clara Avenue, and 31,100 vehicles per day south of Santa Clara Avenue. Wright Street Wright Street is a north-south collector street located west of the project site. In the project vicinity, the roadway is undivided, providing one lane in each direction without left turn lanes. Most intersections along the street are controlled by all-way stops (Wright/Avalon west leg, Wright/21 st St, and Wright/19 th St). There are STOP signs on Wright Street only at Santa Clara and at 17 th Street. The posted speed limit on Wright Street is 25 mph. There are no marked crosswalks along Wright Street. Parking is allowed on both sides of the street. Land use along Wright Street is single-family residential and church. The daily traffic volume along Wright Street is approximately 2,900 vehicles per day south of Santa Clara Avenue. City of Santa Ana/TAVA Homes 11 Traffic Impact Study
18 Existing Conditions Lyon Street Lyon Street is a north-south residential street. The street is discontinuous near the project site. There is a north segment north of the project site and a south segment south of the project site. The two legs are separated by an orange grove (the proposed project site). In the project vicinity, the roadway is undivided, providing one lane in each direction. The north leg of Lyon Street has a T intersection with Santa Clara Avenue (there is no northbound approach to this intersection). The south leg of Lyon Street connects with Avalon Avenue south of the project site. Traffic is prevented from traveling through from one segment of Lyon Street to the other by the presence of the orange grove between the two segments. The Prima Facie speed limit on Lyon Street is 25 mph. There are no pedestrian facilities along Lyon Street (except sidewalks). Parking is allowed on both sides of the street. Land use along Lyon Street is single-family residential. The daily traffic volume along Lyon Street is approximately 475 vehicles per day north of Santa Clara Avenue and 30 vehicles per day south of Santa Clara Avenue. Avalon Avenue Avalon Avenue is an east-west residential street. The street is discontinuous, with the east leg of the street immediately south of the project site. The east leg forms a T intersection with Wright Street. The east leg of Avalon Avenue connects with the south leg of Lyon Street immediately south of the project site. In the project vicinity, the roadway is undivided, providing one lane in each direction. The Prima Facie speed limit on Avalon Avenue is 25 mph. There are no pedestrian facilities along Avalon Avenue (except sidewalks). Parking is allowed on both sides of the street. Land use along Avalon Avenue is single-family residential. The daily traffic volume along Avalon Avenue is approximately 415 vehicles per day east of Wright Street. Area Freeways The SR-22 (Garden Grove Freeway) is located approximately ½ mile north of the project site. It provides a local interchanges at Grand Avenue (full access) and Tustin Avenue (eastbound off and westbound on only). The I-5 Freeway is located approximately 1 mile southwest of the project site. The SR-55 Freeway is located approximately 1 mile east of the project site. Existing Peak Hour Intersection Level of Service Figure 4 illustrates the existing AM and PM peak hour traffic volumes. Table 3 summarizes the results of the level of service analysis for the existing conditions. The study area was observed during both the morning and the evening peak hours. The indicated levels of service shown in Table 3 are representative of observed traffic conditions in the study area. Appendix B contains the level of service analysis worksheets. City of Santa Ana/TAVA Homes 12 Traffic Impact Study
19 1471/ / / / / / / / / / 18 5 / 0 23 / 10 2 / 1 0 / / / / / 35 61/ / / / / / / / / / / / / / 1 42 / / / / 139 Fairhaven Ave Lyon St Santa Clara Ave Project Site Grand Ave Wright St Avalon Ave 8 / 6 12 / 13 3 / 0 6 / / / 331 Tustin Ave / / / 13 LEGEND 6 / 3 Project Site 183 / / 4 N Study Intersection XX/XX AM/PM Peak Hour Volumes Not to Scale J:\2011\JB13036 SA TAVA Homes\Analysis\Figure\JB13036_Figure.ai City of Santa Ana TAVA Homes Traffic Impact Study Figure 4 Existing AM/PM Peak Hour Traffic Volumes
20 Existing Conditions Table 3 Peak Hour Intersection Conditions Existing Conditions (Year 2011) Intersection AM Peak Hour PM Peak Hour Signalized Intersections (Level of Service / V/C) V/C LOS V/C LOS Santa Clara Avenue at Grand Avenue.742 C.649 B Santa Clara Avenue at Tustin Avenue.681 B.579 A Unsignalized Intersections (Level of Service / Delay) Delay LOS Delay LOS Santa Clara Avenue at Wright Street 13.9 B 30.0 D Santa Clara Avenue at Project Access NA N/A NA N/A Santa Clara Avenue at Lyon Street 11.5 B 13.7 B Wright Street at Avalon Avenue 9.8 A 9.5 A Note: LOS = Level of Service; V/C = Volume/Capacity, Delay in Seconds/Vehicle Average Existing Street Segment Conditions Figure 5 illustrates existing average daily traffic (ADT) volumes for selected roadways where daily traffic is of interest. Table 4 presents the daily traffic volume segment analysis for these street segments. The level of service for these roadway segments is determined by comparing the daily traffic volumes for each roadway segment to the appropriate service capacity for that roadway classification shown previously in Table 2. As shown in Table 4, all of the study street segments currently operate at Level of Service D or better (acceptable). Table 4 Roadway Segment Existing Level of Service Street Between And Existing ADT Volume LOS D Capacity Existing Level of Service Santa Clara Avenue Grand Avenue Wright Street 10,674 11,300 D Santa Clara Avenue Wright Street Lyon Street 8,903 11,300 C Santa Clara Avenue Lyon Street Tustin Avenue 8,990 11,300 C Lyon Street Aspen Street Santa Clara Ave ,000 A Wright Street Santa Clara Ave. 17 th Street 2,870 5,000 A Avalon Avenue Wright Street Lyon Street 415 2,000 A Grand Avenue Fairhaven Ave. Santa Clara Ave. 29,177 33,800 C Grand Avenue Santa Clara Ave. 17 th Street 26,593 50,600 A Tustin Avenue Fairhaven Ave. Santa Clara Ave. 31,751 50,600 A Tustin Avenue Santa Clara Ave. 17 th Street 31,056 50,600 A City of Santa Ana/TAVA Homes 14 Traffic Impact Study
21 Fairhaven Ave Lyon St Tustin Ave Santa Clara Ave Grand Ave 415 Wright St Avalon Ave 17th St LEGEND Project Site N 1234 Daily Traffic Volume Not to Scale J:\cities\Santa Ana\JA73185 Empire Homes\Figure\JA73185-ADT.ai City of Santa Ana TAVA Traffic Impact Study Figure 5 Existing Daily Traffic Volumes
22 4. Future Without Project Conditions This section develops near term traffic conditions in the study area with ambient growth and cumulative project traffic added, without the proposed project. The year 2013 was selected for analysis because the project is scheduled for completion before the end of the year Future Growth Based on discussions with City of Santa Ana staff, it is forecast that traffic in the study area is expected to increase at a rate of about 1% per year. Future increases in the background traffic volumes due to regional growth are expected to continue at this rate in the vicinity of the project. Assuming a completion date in the year 2013, the existing 2011 traffic volumes were adjusted upward by 2% (1% per year) to reflect area-wide growth. Future traffic increases also consider additional traffic that may be generated by other developments that have been approved. The Cities of Santa Ana, Tustin, and Orange identified some relevant projects near the site which will add traffic to the intersections analyzed in the study. Table 5 lists the cumulative projects that were analyzed as part of this study per City direction. The trip generation and distribution attributed to these projects is documented in Appendix D of this report. The trips generated by the cumulative projects are included in the future forecast. Figure 6 shows the cumulative project locations. Figure 7 shows the traffic volumes for the cumulative projects in the study area. Table 5 - Cumulative Projects ID No. Project Location Land Use 1 Alliance Church of Orange 2130 North Grand, Santa Ana 2 Olen Properties 601 N. Parkcenter Drive Day Care, 10,422 sf Gym, 10,296 sf Condominium, 136 DU Office, 2,500 sf 3 Town & Country Manor 555 E Memory Lane, Santa Ana Condominium, 174 DU 4 Renaissance 5 Town & Country Medical Center Santa Ana Blvd Corridor, Logan & Lacy Neighborhoods, Civic Center area, Downtown area 6 CHOC Medical Center Campus, CHOC La Veta & Pepper St, Orange Source: City of Santa Ana Planning & Development Department Single-Family Residential, 294 DU Multi-Family Residential, 3,104 DU Hi-Rise Condominium, 402 DU Retail, 351,000 sf 999 Town & Country Rd. Orange Medical-Dental Office, 65,370 sf Hospital, 425,000 sf Medical Dental Office, 175,000 sf City of Santa Ana/TAVA Homes 16 Traffic Impact Study
23 LEGEND Project Site (TAVA Homes) 1 Alliance Church of Orange 2 Olen Properties 3 Town and County Manor 4 Renaissance 5 Town and Country Medical Center 6 Choc J:\2011\JB13036 SA TAVA Homes\Analysis\Figures\JB13036_Cumulative Proj Location Figure.ai City of Santa Ana TAVA Homes Traffic Impact Study Not to Scale Figure 6 Cumulative Projects Location Map N
24 25 / 47 0 / 0 3 / 7 0 / 0 0 / 0 0 / 0 0 / 0 1 / 1 0 / 0 0 / 0 6 / 4 0 / 0 0 / 0 0 / 0 4 / 4 0 / 0 0 / 0 6 / / 8 0 / 0 0 / 0 0 / 0 0 / 0 3 / 4 4 / 4 0 / 0 0 / 0 0 / 0 37 / 30 4 / 4 0 / 0 0 / 0 0 / 0 0 / 0 1 / 2 0 / 0 Fairhaven Ave Lyon St Santa Clara Ave Project Site Grand Ave Avalon Ave 0 / 0 0 / 0 0 / 0 0 / 0 6 / / 8 Tustin Ave 0 / 0 0 / 0 0 / 0 Wright St 55 0 / 0 0 / 0 0 / 0 0 / 0 0 / 0 6 / / 8 0 / 0 0 / 0 LEGEND 0 / 0 0 / 0 XX/XX Project Site Study Intersection AM/PM Peak Hour Volumes N Not to Scale J:\2011\JB13036 SA TAVA Homes\Analysis\Figure\JB13036_Figure.ai City of Santa Ana TAVA Homes Traffic Impact Study Figure 7 Cumulative Projects AM/PM Peak Hour Traffic Volumes
25 Future Without Project Conditions Future Peak Hour Intersection Level of Service To forecast the Future Growth Conditions plus cumulative projects for the year 2013, the peak hour volumes in Figure 4 were increased by 2% and traffic from the list of cumulative projects was added. Figure 8 illustrates the resulting AM and PM Future Without Project (Year 2013) peak hour traffic volumes. Table 6 summarizes the results of the level of service analysis for this scenario. Table 6 AM/PM Peak Hour Intersection Performance Future Year Without Project Conditions Intersection AM Peak Hour PM Peak Hour Signalized Intersections (Level of Service / V/C) V/C LOS V/C LOS Santa Clara Avenue at Grand Avenue.767 C.674 B Santa Clara Avenue at Tustin Avenue.694 B.591 A Unsignalized Intersections (Level of Service / Delay) Delay LOS Delay LOS Santa Clara Avenue at Wright Street 14.4 B 33.5 D Santa Clara Avenue at Project Access NA N/A NA N/A Santa Clara Avenue at Lyon Street 11.7 B 14.1 B Wright Street at Avalon Avenue 9.8 A 9.6 A Note: LOS = Level of Service; V/C = Volume/Capacity, Delay in Seconds/Vehicle Average Future Street Segment Conditions Figure 9 illustrates the Future Without Project (Year 2013) average daily traffic (ADT) volumes for selected roadways. Table 7 presents the daily traffic volume segment analysis for these street segments. The level of service for these roadway segments is determined by comparing the daily traffic volumes for each roadway segment to the appropriate service capacity for that roadway classification shown previously in Table 2. City of Santa Ana/TAVA Homes 19 Traffic Impact Study
26 1525 / / / / 10 5 / 0 2 / / / / / / / / / / / 18 0 / / / / / / / / / / / / / / / / 1 43 / / / / 142 Fairhaven Ave Lyon St Santa Clara Ave Project Site Grand Ave Avalon Ave 9 / 6 12 / 13 3 / 0 6 / / / 345 Tustin Ave 277 / / 25 Wright St / 13 6 / 3 1 / / 180 LEGEND XX/XX Project Site Study Intersection AM/PM Peak Hour Volumes N Not to Scale J:\2011\JB13036 SA TAVA Homes\Analysis\Figure\JB13036_Figure.ai City of Santa Ana TAVA Homes Traffic Impact Study Figure 8 Future AM/PM Without Project Peak Hour Traffic Volumes
27 Fairhaven Ave Lyon St Tustin Ave Santa Clara Ave Grand Ave 423 Wright St Avalon Ave 17th St LEGEND 1234 Project Site Daily Traffic Volume N Not to Scale J:\cities\Santa Ana\JA73185 Empire Homes\Figure\JA73185-ADT.ai City of Santa Ana TAVA Traffic Impact Study Figure 9 Future without Project Daily Traffic Volumes
28 Future Without Project Conditions Table 7 Roadway Segment Future Without Project Level of Service Street Between And Future ADT Volume LOS D Capacity Future Level of Service Santa Clara Avenue Grand Avenue Wright Street 11,084 11,300 D Santa Clara Avenue Wright Street Lyon Street 9,278 11,300 C Santa Clara Avenue Lyon Street Tustin Avenue 9,366 11,300 C Lyon Street Aspen Street Santa Clara Ave ,000 A Wright Street Santa Clara Ave. 17 th Street 2,927 5,000 A Avalon Avenue Wright Street Lyon Street 415 2,000 A Grand Avenue Fairhaven Ave. Santa Clara Ave. 30,594 33,800 D Grand Avenue Santa Clara Ave. 17 th Street 28,820 50,600 A Tustin Avenue Fairhaven Ave. Santa Clara Ave. 32,498 50,600 A Tustin Avenue Santa Clara Ave. 17 th Street 31,790 50,600 A City of Santa Ana/TAVA Homes 22 Traffic Impact Study
29 5. Buildout Without Project Conditions This section develops buildout (Year 2035) traffic conditions in the study area, without the proposed project. It includes development of the buildout traffic conditions in the study area based on traffic growth projections provided by the OCTAM 3.3 model applied to existing traffic patterns. The year 2035 was selected for analysis based on the OCTA OCTAM 3.3 traffic model buildout year Documentation of the traffic model forecast is included in Appendix E of this report. Buildout Peak Hour Intersection Level of Service To forecast traffic growth conditions for the year 2035, ambient peak hour background traffic volume increases were derived from the base year and buildout year County traffic model. These roadway approach volume increases were applied to existing observed traffic volumes to forecast buildout traffic conditions without the proposed project. Figure 10 illustrate the resulting buildout AM and PM peak hour volumes. Table 8 summarizes the results of the level of service analyses for this scenario. Table 8 AM/PM Peak Hour Intersection Performance Buildout Without Project Conditions Intersection AM Peak Hour PM Peak Hour Signalized Intersections (Level of Service / V/C) V/C LOS V/C LOS Santa Clara Avenue at Grand Avenue.997 E.840 D Santa Clara Avenue at Tustin Avenue.847 D.708 C Unsignalized Intersections (Level of Service / Delay) Delay LOS Delay LOS Santa Clara Avenue at Wright Street 17.9 C 81.3 F Santa Clara Avenue at Project Access N/A N/A N/A N/A Santa Clara Avenue at Lyon Street 12.4 B 16.1 C Wright Street at Avalon Avenue 10.3 B 9.8 A Note: LOS = Level of Service; V/C = Volume/Capacity, Delay in Seconds/Vehicle Average Buildout Street Segment Conditions Figure 11 illustrates the Buildout Without Project average daily traffic volumes for selected roadways. Table 9 presents the daily traffic volume segment analysis for these street segments. The level of service for these street segments is determined by comparing the daily traffic volumes for the roadway segment to the appropriate service capacity for that roadway classification. City of Santa Ana/TAVA Homes 23 Traffic Impact Study
30 2107 / / / /12 6 / 0 3 / / / / / / / / / / / 22 0 / / / / / / / / / / / / / / / / 1 53 / / / / 171 Fairhaven Ave Lyon St Santa Clara Ave Project Site Grand Ave Avalon Ave 8 / 6 12 / 13 3 / 0 6 / / / 407 Tustin Ave 341 / / / 13 Wright St 55 6 / 3 1 / / 216 LEGEND XX/XX Project Site Study Intersection AM/PM Peak Hour Volumes N Not to Scale J:\2011\JB13036 SA TAVA Homes\Analysis\Figure\JB13036_Figure.ai City of Santa Ana TAVA Homes Traffic Impact Study Figure 10 Buildout AM/PM Without Project Peak Hour Traffic Volumes
31 Fairhaven Ave Lyon St Tustin Ave Santa Clara Ave Grand Ave 415 Wright St Avalon Ave 17th St LEGEND 1234 Project Site Daily Traffic Volume N Not to Scale J:\cities\Santa Ana\JA73185 Empire Homes\Figure\JA73185-ADT.ai City of Santa Ana TAVA Traffic Impact Study Figure 11 Buildout without Project Daily Traffic Volumes
32 Buildout Without Project Conditions Table 9 Roadway Segment Buildout Without Project Level of Service Street Between And Buildout ADT Volume LOS D Capacity Buildout Level of Service Santa Clara Avenue Grand Avenue Wright Street 11,690 11,300 E Santa Clara Avenue Wright Street Lyon Street 12,400 11,300 E Santa Clara Avenue Lyon Street Tustin Avenue 9,800 11,300 C Lyon Street Aspen Street Santa Clara Ave ,000 A Wright Street Santa Clara Ave. 17 th Street 3,300 5,000 B Avalon Avenue Wright Street Lyon Street 415 2,000 A Grand Avenue Fairhaven Ave. Santa Clara Ave. 35,230 33,800 E Grand Avenue Santa Clara Ave. 17 th Street 33,390 50,600 A Tustin Avenue Fairhaven Ave. Santa Clara Ave. 32,790 50,600 A Tustin Avenue Santa Clara Ave. 17 th Street 32,230 50,600 A Note that Lyon Street and Avalon Avenue are not included in the County traffic model, therefore no traffic model forecasts are available for these street segments. Lyon Street and Avalon Avenue provide access to built-out residential neighborhoods, and do not carry through traffic beyond these neighborhoods. Therefore no background traffic growth is indicated for these street segments. City of Santa Ana/TAVA Homes 26 Traffic Impact Study
33 6. Project Trips Project-related traffic consists of trips on any portion of the street system that will begin or end at the project site as a result of the development of the proposed project. Project-related traffic is a function of the extent and type of development proposed for the site. This information is used to establish traffic generation for the site. The site is currently occupied by one single family dwelling unit and an orange grove. The proposed project would consist of 24 single-family dwelling units to be built on the site. Project Trip Generation Trip generation is a measure or forecast of the number of trips that will be made to or from the project. It is generally equal to the traffic volume expected at the project entrances and exits. Trip generation characteristics for projects are normally estimated based on rates published in Trip Generation, Eighth Edition, published by the Institute of Transportation Engineers (ITE). This document is widely used in Southern California and indicates the probable traffic generation rates for various land uses based upon studies of existing developments in comparable settings. Trip Generation, Eighth Edition indicates daily, AM and PM peak hour trip generation rates for residential projects. The trip generation rates for this project are shown in Table 10. The traffic generation expected from the project, based on these generation rates is also shown in Table 10. Table 10 Project Trip Generation AM Peak Hour PM Peak Hour Land Use Measure Daily Total In Out Total In Out Single-Family Residential ITE Code 210 Trip Generation Rates DU Vehicle Trips Single-Family Residential 24 DU Existing Land Use Traffic The project site is currently occupied by a single unoccupied dwelling unit and an orange grove (nonproductive). There are no trips currently generated from the site, and therefore there are no vehicle trip credits associated with the existing use of the site. City of Santa Ana/TAVA Homes 27 Traffic Impact Study
34 Project Trips As shown in Table 10, the project will generate a total of 230 net daily trips, including 18 trips during the AM peak hour and 24 trips during the PM peak hour. Project Trip Distribution Trip distribution is the process of identifying the probable destinations, directions or traffic routes that will be utilized by project traffic. Trip distribution for this project is based on the OCTAM 3.3 traffic model and on existing traffic patterns of surrounding streets and intersections. The potential interactions between the proposed land use and surrounding regional access routes, as well as engineering judgment are also considered when identifying the routes where project traffic will distribute. The traffic distribution evident from traffic turning movements in the project vicinity was also considered. The anticipated trip distribution for the proposed project is presented in Figures 12 and 13. These figures indicate the proportion of project traffic that will use the street segments and turning movements indicated. Future AM and PM peak hour project-related traffic volumes increases are shown in Figure 14. Future traffic levels in the project vicinity are expected to be changed by the amounts shown on this figure. City of Santa Ana/TAVA Homes 28 Traffic Impact Study
35 La Veta Ave Town & Country Rd 22 Memory Ln Fairhaven Ave Main St Grand Ave Wright St Lyon St 60 Santa Clara Ave 15 Avalon Ave 5 17th St Tustin Ave th St LEGEND 1st St XX Project Site Study Intersection Trip Distribution Percentage N Not to Scale J:\2011\JB13036 SA TAVA Homes\Analysis\Figure\JB13036_Figure.ai City of Santa Ana TAVA Homes Traffic Impact Study Figure 12 Inbound Project Trip Distribution
36 La Veta Ave Town & Country Rd 22 Main St Memory Ln 15 Fairhaven Ave Lyon St 60 Santa Clara Ave Tustin Ave Grand Ave Wright St Avalon Ave 17th St th St LEGEND 1st St XX Project Site Study Intersection Trip Distribution Percentage N Not to Scale J:\2011\JB13036 SA TAVA Homes\Analysis\Figure\JB13036_Figure.ai City of Santa Ana TAVA Homes Traffic Impact Study Figure 13 Outbound Project Trip Distribution
37 1 / 2 1 / 4 2 / 1 1 / 1 1 / 4 3 / 2 3 / 2 1 / 1 0 / 1 5 /3 1 / 2 2 / 5 Fairhaven Ave Lyon St Santa Clara Ave Project Site Grand Ave Avalon Ave 8 / 6 3 / 9 Tustin Ave 2 / 1 Wright St 55 1 / 2 1 / 4 3 / 9 LEGEND 3 / 2 8 / 6 XX/XX Project Site Study Intersection AM/PM Peak Hour Volumes N Not to Scale J:\2011\JB13036 SA TAVA Homes\Analysis\Figure\JB13036_Figure.ai City of Santa Ana TAVA Homes Traffic Impact Study Figure 14 Project Only AM/PM Peak Hour Traffic Volumes
38 7. Future WITH Project Conditions This section documents the near-term future (2013) traffic conditions with the addition of projectrelated traffic to the surrounding street system. Future Peak Hour Intersection Level of Service The future WITH Project traffic volumes were derived by adding the project trips shown in Figure 14 to the future background traffic volumes for the year Figure 15 illustrates the future peak hour traffic volumes with the proposed project during the AM and PM peak hours. Table 11 summarizes the results of the level of service analysis for the future WITH Project conditions. Table 11 AM/PM Peak Hour Intersection Performance Future WITH Project Conditions Intersection AM Peak Hour PM Peak Hour Signalized Intersections (Level of Service / V/C) V/C LOS V/C LOS Santa Clara Avenue at Grand Avenue.768 C.677 B Santa Clara Avenue at Tustin Avenue.697 B.592 A Unsignalized Intersections (Level of Service / Delay) Delay LOS Delay LOS Santa Clara Avenue at Wright Street 14.5 B 34.0 D Santa Clara Avenue at Project Access 10.9 B 13.0 B Santa Clara Avenue at Lyon Street 11.8 B 14.3 B Wright Street at Avalon Avenue 10.0 A 9.6 A Note: LOS = Level of Service; V/C = Volume/Capacity, Delay in Seconds/Vehicle Average Future Street Segment Conditions Figure 16 illustrates the Future With Project (Year 2013) average daily traffic (ADT) volumes for selected roadways. Table 12 presents the daily traffic volume segment analysis for these street segments. The level of service for these roadway segments is determined by comparing the daily traffic volumes for each roadway segment to the appropriate service capacity for that roadway classification. City of Santa Ana/TAVA Homes 32 Traffic Impact Study
39 1525 / / / / 10 5 / 0 2 / / / / / / / / / / / 18 0 / / / / / / / / / / / / / / / / 1 43 / / / / 142 Fairhaven Ave Lyon St Santa Clara Ave Project Site Grand Ave Avalon Ave 9 / 6 12 / 13 3 / 0 6 / / / 354 Tustin Ave 277 / / 25 Wright St / 13 8 / 4 2 / / / 0 0 / / / / 4 3/ 9 LEGEND 3 / 2 8 / 5 XX/XX Project Site Study Intersection AM/PM Peak Hour Volumes N Not to Scale J:\2011\JB13036 SA TAVA Homes\Analysis\Figure\JB13036_Figure.ai City of Santa Ana TAVA Homes Traffic Impact Study Figure 15 Future AM/PM With Project Peak Hour Traffic Volumes
40 Fairhaven Ave Lyon St Tustin Ave Santa Clara Ave Grand Ave 458 Wright St Avalon Ave 17th St LEGEND 1234 Project Site Daily Traffic Volume N Not to Scale J:\cities\Santa Ana\JA73185 Empire Homes\Figure\JA73185-ADT.ai City of Santa Ana TAVA Traffic Impact Study Figure 16 Future with Project Daily Traffic Volumes
41 Future WITH Project Conditions Table 12 Roadway Segment Future With Project Level of Service Street Between And Future ADT Volume LOS D Capacity Future Level of Service Santa Clara Avenue Grand Avenue Wright Street 11,142 11,300 D Santa Clara Avenue Wright Street Lyon Street 9,335 11,300 C Santa Clara Avenue Lyon Street Tustin Avenue 9,504 11,300 C Lyon Street Aspen Street Santa Clara Ave ,000 A Wright Street Santa Clara Ave. 17 th Street 2,962 5,000 A Avalon Avenue Wright Street Lyon Street 450 2,000 A Grand Avenue Fairhaven Ave. Santa Clara Ave. 30,628 33,800 D Grand Avenue Santa Clara Ave. 17 th Street 28,843 50,600 A Tustin Avenue Fairhaven Ave. Santa Clara Ave. 32,556 50,600 A Tustin Avenue Santa Clara Ave. 17 th Street 31,870 50,600 A City of Santa Ana/TAVA Homes 35 Traffic Impact Study
42 8. Buildout WITH Project Conditions This section documents the buildout traffic conditions with the addition of project-related traffic to the surrounding street system. Buildout Peak Hour Intersection Level of Service The buildout WITH Project traffic volumes were derived by adding the project trips shown in Figure 14 to the buildout background traffic volumes for the year Figure 17 illustrates the resulting buildout peak hour traffic volumes with the proposed project during the AM and PM peak hours. Table 13 summarizes the results of the level of service analysis for the buildout WITH Project conditions. Table 13 AM/PM Peak Hour Intersection Performance Buildout WITH Project Conditions Intersection AM Peak Hour PM Peak Hour Signalized Intersections (Level of Service / V/C) V/C LOS V/C LOS Santa Clara Avenue at Grand Avenue.999 E.843 D Santa Clara Avenue at Tustin Avenue.850 D.709 C Unsignalized Intersections (Level of Service / Delay) Delay LOS Delay LOS Santa Clara Avenue at Wright Street 18.0 C 83.5 F Santa Clara Avenue at Project Access 11.2 B 13.7 B Santa Clara Avenue at Lyon Street 12.5 B 16.3 C Wright Street at Avalon Avenue 10.4 B 9.9 A Note: LOS = Level of Service; V/C = Volume/Capacity, Delay in Seconds/Vehicle Average Buildout Street Segment Conditions Figure 18 illustrates the Buildout With Project average daily traffic volumes for selected roadways. Table 14 presents the daily traffic volume segment analysis for these street segments. The level of service for these street segments is determined by comparing the daily traffic volumes for the roadway segment to the appropriate service capacity for that roadway classification. City of Santa Ana/TAVA Homes 36 Traffic Impact Study
43 2107 / / / / 12 6 / 0 3 / / / / / / / / / / / 22 0 / / / / / / / / / / / / / / / / 1 53 / 43 99/ / / 171 Fairhaven Ave Lyon St Santa Clara Ave Project Site Grand Ave Avalon Ave 8 / 6 12 / 13 3 / 0 6 / / / 416 Tustin Ave 341 / / / 13 Wright St 55 8 / / / 6 0 / 0 0 / / / / 4 3/ 9 LEGEND 3 / 2 8 / 5 XX/XX Project Site Study Intersection AM/PM Peak Hour Volumes N Not to Scale J:\2011\JB13036 SA TAVA Homes\Analysis\Figure\JB13036_Figure.ai City of Santa Ana TAVA Homes Traffic Impact Study Figure 17 Buildout AM/PM With Project Peak Hour Traffic Volumes
44 Fairhaven Ave Lyon St Tustin Ave Santa Clara Ave 450 Grand Ave Wright St Avalon Ave 17th St LEGEND Project Site N 1234 Daily Traffic Volume Not to Scale J:\cities\Santa Ana\JA73185 Empire Homes\Figure\JA73185-ADT.ai City of Santa Ana TAVA Traffic Impact Study Figure 18 Buildout with Project Daily Traffic Volumes
45 Buildout WITH Project Conditions Table 14 Roadway Segment Buildout With Project Level of Service Street Between And Buildout ADT Volume LOS D Capacity Buildout Level of Service Santa Clara Avenue Grand Avenue Wright Street 11,748 11,300 E Santa Clara Avenue Wright Street Lyon Street 12,458 11,300 E Santa Clara Avenue Lyon Street Tustin Avenue 9,938 11,300 C Lyon Street Aspen Street Santa Clara Ave ,000 A Wright Street Santa Clara Ave. 17 th Street 3,335 5,000 B Avalon Avenue Wright Street Lyon Street 450 2,000 A Grand Avenue Fairhaven Ave. Santa Clara Ave. 35,265 33,800 E Grand Avenue Santa Clara Ave. 17 th Street 33,413 50,600 A Tustin Avenue Fairhaven Ave. Santa Clara Ave. 32,848 50,600 A Tustin Avenue Santa Clara Ave. 17 th Street 32,311 50,600 A City of Santa Ana/TAVA Homes 39 Traffic Impact Study
46 9. Determination of Significant Impacts Traffic impacts are identified if the proposed project will result in a significant change in traffic conditions on a roadway or intersection. A significant impact is normally defined when project-related traffic causes level of service to deteriorate to below the minimum acceptable level by a measurable amount. Intersections Tables 15 and 16 present a comparison of existing and future study scenarios using the ICU method of analysis for signalized intersections and the HCM method for unsignalized intersections preferred by the City. Tables 17 and 18 present a comparison of existing and buildout study scenarios using these methods of analysis. Traffic impacts created by the project can be calculated by comparing the Future With Project conditions to the Future Without Project conditions, or the Buildout With Project conditions to the Buildout Without Project conditions. Significant traffic impacts are determined using the criteria presented in Section 2 of this report. Table 15 Level of Service Analysis /Determination of Impacts for Near Term Future Project Conditions, AM Peak Hour Intersection Existing Future Without Project Future With Project Increase/ Decrease Significant Impact? Signalized Intersections Santa Clara Ave/ Grand Avenue Santa Clara Ave/ Tustin Avenue ICU 1 LOS 2 ICU 1 LOS 2 ICU 1 LOS C.767 C.768 C.001 No.681 B.694 B.697 B.003 No Unsignalized Intersections Delay 3 LOS 2 Delay 3 LOS 2 Delay 3 LOS 2 Santa Clara Ave/ Wright Street 13.9 B 14.4 B 14.5 B 0.1 No Santa Clara Ave/ Project Access NA N/A NA N/A 10.9 B NA No Santa Clara Ave/ Lyon Street 11.5 B 11.7 B 11.8 B 0.1 No Wright Street/ Avalon Avenue 9.8 A 9.8 A 10.0 A 0.2 No Note 1: ICU=Intersection Capacity Utilization; Note 2: LOS=Level of Service; Note 3: Delay in seconds per vehicle average City of Santa Ana/TAVA Homes 40 Traffic Impact Study
47 Determination of Significant Impacts Table 16 Level of Service Analysis /Determination of Impacts for Near Term Future Project Conditions, PM Peak Hour Intersection Existing Future Without Project Future With Project Increase/ Decrease Significant Impact? Signalized Intersections ICU 1 LOS 2 ICU 1 LOS 2 ICU 1 LOS 2 Santa Clara Ave/ Grand Avenue Santa Clara Ave/ Tustin Avenue.649 B.674 B.677 B.003 No.579 A.591 A.592 A.001 No Unsignalized Intersections Santa Clara Ave/ Wright Street Santa Clara Ave/ Project Access Santa Clara Ave/ Lyon Street Wright Street/ Avalon Avenue Delay 3 LOS 2 Delay 3 LOS 2 Delay 3 LOS D 33.5 D 34.0 D 0.5 No NA N/A NA N/A 13.0 B NA No 13.7 B 14.1 B 14.3 B 0.2 No 9.5 A 9.6 A 9.6 A 0.0 No Note 1: ICU=Intersection Capacity Utilization; Note 2: LOS=Level of Service; Note 3: Delay in seconds per vehicle average City of Santa Ana/TAVA Homes 41 Traffic Impact Study
48 Determination of Significant Impacts Table 17 Level of Service Analysis /Determination of Impacts for Buildout Project Conditions, AM Peak Hour Intersection Existing Buildout Without Project Buildout With Project Increase/ Decrease Significant Impact? Signalized Intersections ICU 1 LOS 2 ICU 1 LOS 2 ICU 1 LOS 2 Santa Clara Ave/ Grand Avenue Santa Clara Ave/ Tustin Avenue.742 C.997 E.999 E.002 No.681 B.847 D.850 D.003 No Unsignalized Intersections Santa Clara Ave/ Wright Street Santa Clara Ave/ Project Access Santa Clara Ave/ Lyon Street Wright Street/ Avalon Avenue Delay 3 LOS 2 Delay 3 LOS 2 Delay 3 LOS B 17.9 C 18.0 C 0.1 No NA N/A N/A N/A 11.2 B NA No 11.5 B 12.4 B 12.5 B 0.1 No 9.8 A 10.3 B 10.4 B 0.1 No Note 1: ICU=Intersection Capacity Utilization; Note 2: LOS=Level of Service; Note 3: Delay in seconds per vehicle average City of Santa Ana/TAVA Homes 42 Traffic Impact Study
49 Determination of Significant Impacts Table 18 Level of Service Analysis /Determination of Impacts for Buildout Project Conditions, PM Peak Hour Intersection Existing Buildout Without Project Buildout With Project Increase/ Decrease Significant Impact? Signalized Intersections ICU 1 LOS 2 ICU 1 LOS 2 ICU 1 LOS 2 Santa Clara Ave/ Grand Avenue Santa Clara Ave/ Tustin Avenue.649 B.840 D.843 D.003 No.579 A.708 C.709 C.001 No Unsignalized Intersections Santa Clara Ave/ Wright Street Santa Clara Ave/ Project Access Santa Clara Ave/ Lyon Street Wright Street/ Avalon Avenue Delay 3 LOS 2 Delay 3 LOS 2 Delay 3 LOS D 81.3 F 83.5 F 2.2 Yes NA N/A N/A N/A 13.7 B NA No 13.7 B 16.1 C 16.3 C 0.2 No 9.5 A 9.8 A 9.9 A 0.1 No Note 1: ICU=Intersection Capacity Utilization; Note 2: LOS=Level of Service; Note 3: Delay in seconds per vehicle average Based on the intersection levels of service shown in Tables 15, 16, 17, and 18, for the With Project and Without Project conditions, and using the significant impact criteria presented in Section 2 of this report, there is expected to be a significant impact to one of the study intersections as a result of the project. The intersection of Santa Clara Ave/Wright Street is expected to be impacted in the PM peak hour for the buildout condition as a result of the proposed project. Appropriate mitigation measures will be required to restore operating conditions at these locations to pre-project levels. Please see Project Recommendations section of this report. City of Santa Ana/TAVA Homes 43 Traffic Impact Study
50 Determination of Significant Impacts Street Segments Level of Service for roadway segments is determined by forecasting the expected daily traffic usage for each roadway and comparing the daily traffic volumes for each roadway segment to the appropriate Level of Service D capacity for that roadway classification. The daily usage is forecast based upon the OCTAM model ADT forecast (when available), and the daily project trip generation and distribution. When the OCTAM forecast is not available the peak hour usage forecast and a daily traffic conversion factor (10x) is used, along with the daily project trip generation and distribution. When the daily volume is within the Level of Service D volume criteria, the roadway segment is forecast to operate at an acceptable level of service. Table 19 presents the daily traffic volume segment analysis for the study area for Existing Conditions, Buildout without Project conditions, and Buildout with Project conditions. Three roadway segments, Santa Clara Avenue between Grand Avenue and Wright Street, Santa Clara Avenue between Wright Street and Lyon Street, and Grand Avenue between Fairhaven Avenue and Santa Clara Avenue are expected to operate at poor levels of service (LOS E) under both Buildout without Project and Buildout with Project traffic conditions. The Level of Service E conditions on these roadway segments will exist for the Buildout without Project conditions. The expected decline in level of service on these segments (from Level D to Level E) is therefore not due to an impact from the proposed project. The expected LOS E conditions are due to a combination of existing traffic volumes and ambient traffic growth, not as a result of added traffic volumes from the project. Table 19 Santa Clara Avenue Daily Traffic Analysis Street Between And Existing ADT Volume Existing Level of Service Buildout Without Project ADT Volume Buildout Without Project Level of Service Project Traffic Buildout With Project ADT Volume Buildout With Project Level of Service Santa Clara Grand Ave Wright St 10,674 D 11,690 E 58 11,748 E Santa Clara Wright St Lyon St 8,903 C 12,400 E 58 12,458 E Santa Clara Lyon St Tustin Ave 8,990 C 9,800 C 138 9,938 C Lyon St Aspen St Santa Clara 476 A 476 A A Wright St Santa Clara 17 th St 2,870 A 3,300 B 35 3,335 B Avalon Ave Wright St Lyon St 415 A 415 A A Grand Ave Fairhaven Santa Clara 29,177 C 35,230 E 35 35,265 E Grand Ave Santa Clara 17 th St 26,593 A 33,390 A 23 33,413 A Tustin Ave Fairhaven Santa Clara 31,751 A 32,790 A 58 32,848 A Tustin Ave Santa Clara 17 th St 31,056 A 32,230 A 81 32,311 A City of Santa Ana/TAVA Homes 44 Traffic Impact Study
51 Determination of Significant Impacts Please see Section 2 of this report for Street Segment Thresholds/Level of Service Definitions. Please see Appendix E for ADT traffic volume forecast. Cost Estimates and Fair Share Analysis The determination of significant impacts analysis determined that improvements are required at one of the study intersections to accommodate forecast buildout traffic volumes, as a result of project-related traffic, cumulative project-related traffic, and background traffic growth. The recommended improvements include signalization, a roundabout, or a wide (14-foot) two-way left-turn lane at the intersection of Santa Clara Avenue/Wright Street. Intersection improvements at Santa Clara Avenue/Wright Street are estimated to cost approximately $250,000 for signalization, or $100,000 for a roundabout, or $10,000 for a wide two-way left-turn lane. The fair share is calculated by comparing the relative amount of traffic increase at the location for the proposed project with the traffic increase indicated in the analysis, as shown in Table 20. This represents the project s fair share towards funding of improvements to meet future traffic demands. Table 20 Cost Estimate & Fair Share Analysis Santa Clara Avenue/Wright Street Intersection Existing Year 2011 Buildout WITH Project Difference Project Percent Improvement Cost Fair Share Santa Clara Av/ Wright St PM Total Intersection Approach Volume Alt 1 Signalization 1,036 1, % $250,000 $4,000 Alt 2 Roundabout 1,036 1, % $100,000 $1,600 Alt 3 Wide 2-way LTL 1,036 1, % $10,000 $160 City of Santa Ana/TAVA Homes 45 Traffic Impact Study
52 10. Project Recommendations Based on the results of the intersection and street segment analysis, the proposed project has a significant impact and is subject to mitigation measures at the following location: Santa Clara Ave/Wright Street (intersection) Stop delay on Santa Clara Avenue at Wright Street is expected to increase by 2.2 seconds in the PM peak hour under buildout conditions due to the proposed project. Level of Service is at LOS F under these conditions. The proposed project contributes 6 trips to the intersection in the PM peak hour. The poor level of service reported for Santa Clara Avenue/Wright Street is due to the northbound left movement of vehicles turning from the minor leg (Wright Street) onto the major street (Santa Clara Avenue). Mitigation measures are recommended at this location to maintain an adequate intersection level of service. Possible measures include installation of a traffic signal if warranted or by construction of a modern roundabout or wide (14-foot) 2-way left-turn lane. Traffic Signal Warrants Traffic signal warrants were tested for intersections near the project location. Under near-term traffic conditions, the 8-hour Interruption of Continuous Traffic Warrant for the intersection of Santa Clara Avenue/Wright Street was met. Under buildout with project traffic conditions, traffic signal warrants for the intersection of Santa Clara Avenue/Wright Street were met. The 8-hour Interruption of Continuous Traffic Warrant passed. The Peak Hour Warrant also passed. The plotted points for the Four-Hour Warrant did not fall above the 4C-1 warrant curve, however they did fall above the 4C-2 warrant curve, indicating that this warrant would also pass for Santa Clara/Wright Street if the speed limit were raised above 40 mph. A modern roundabout would be appropriate for Santa Clara Avenue at Wright Street, because of the disparity of the traffic volumes on the two streets. Santa Clara Avenue has moderate traffic volumes (about 10,700 vehicles per day), while Wright Street has much lower volumes (about 2,900 vehicles per day). These volumes are well within the traffic capacity of a single lane roundabout. Figure 19 shows the proposed roundabout design for Santa Clara Avenue/Wright Street. Traffic volumes for the minor street approach at the project access to Santa Clara Avenue are not high enough to pass warrants at this location. Please see Appendix F for traffic signal warrant worksheets. City of Santa Ana/TAVA Homes 46 Traffic Impact Study
53 J:\2011\JB13036 SA TAVA Homes\Analysis\Figure\JB13036_Figure.ai City of Santa Ana TAVA Homes Traffic Impact Study Figure 19 Roundabout Concept
54 11. Project Access and Internal Circulation The project proposes to provide access to the roadway system with an internal street extension of Lyon Street. This internal street will connect to the external City roadway network at two locations: Santa Clara Avenue immediately north of the project site, and Lyon Street immediately south of the project site. The project access to Santa Clara Avenue would provide full access, allowing left-in and left-out as well as right-in, right-out. A single inbound lane and a single outbound lane are planned. This will be adequate to handle the expected volumes of project traffic. The extension of Lyon Street from Santa Clara Avenue south to Avalon Avenue through the project site may result in some cut-through traffic bypassing the Santa Clara/Wright Street intersection. Potentially this may increase traffic along Avalon Avenue. This may be particularly apparent during school pick-up and drop-off times. Aligning the extension of Lyon Street in a T configuration with the L shaped bend in the roadway within the project site, along with bulb-outs (curb extensions) as proposed should reduce the amount of cut-through traffic. The project itself is expected to add some traffic to Avalon Avenue due to the access provided at the south leg extension of Lyon Street. This traffic is expected to be approximately 15% of the total traffic generated by the project (approximately 35 daily trips). Closing the access to Avalon Avenue via the south leg of Lyon Street would eliminate this added traffic on Avalon Avenue. The proposed site plan shows adequate sight distance at the proposed intersection of the internal access roadway (Lyon Street) with Santa Clara Avenue. The posted speed limit on Santa Clara Avenue is 40 mph. Santa Clara Avenue provides only one lane in each direction with an existing daily traffic volume of about 10,700 vehicles/day. The project access is adequately designed for a 24-lot subdivision. Internal street width is 36 feet curb-curb. This is adequate to allow curbside parking on both sides of the internal streets. Turning radii are 25 feet, at a minimum, which are adequate for the subdivision design. The internal turning path shown on the site plan has also been evaluated and is adequate for fire truck emergency access. Any landscape installed should not impair sight distance for vehicles at the project access with Santa Clara Avenue. As a recommendation for City consideration unrelated to the project, roadway edge striping could be provided along Santa Clara Avenue near the project site to delineate the edge of roadway and shoulder area. City of Santa Ana/TAVA Homes 48 Traffic Impact Study
55 12. Summary/Conclusions The City of Santa Ana is evaluating a proposed residential project consisting of 24 single-family dwelling units on an approximately 5-acre site. The project site is located at 1584 East Santa Clara Avenue, east of Wright Street. The project will be accessed via an extension of Lyon Street through the project site, providing full access to both Santa Clara Avenue immediately north of the project site and Lyon Street/Avalon Avenue immediately south of the project site. The project is expected to generate a net total of 230 daily trips, including 18 trips during the AM peak hour and 24 trips during the PM peak hour. The intersection level of service analysis determined that there is a significant impact to one intersection (Santa Clara Avenue/Wright Street) as a result of the project. Mitigation measures will be required at this intersection. Recommended measures include a traffic signal, roundabout, or wide (14-foot) 2-way left-turn lane. Under existing traffic conditions, traffic signal warrants for the intersection of Santa Clara Avenue/Wright Street were met. Warrants for this intersection were also met under expected buildout with project conditions. A roundabout would also be appropriate at this location. Expected level of service on Santa Clara Avenue between Grand Avenue and Tustin Avenue under Buildout With Project conditions is poor (Level E). The expected LOS E conditions are due to a combination of existing traffic volumes and ambient traffic growth, not as a result of added traffic volumes from the project. As a recommendation for City consideration to improve level of service on Santa Clara Avenue in the future, but unrelated to the proposed project, traffic conditions can be improved through restriping Santa Clara Avenue to 4 lanes west of Wright Street. If a roundabout is constructed at Santa Clara Avenue/Wright Street however, the two-lane configuration of Santa Clara Avenue should be retained. The project traffic study report will be submitted to the City of Santa Ana, who will review the report for compliance with applicable City standards. We anticipate that any minor internal circulation issues will be addressed in conjunction with this review. City of Santa Ana/TAVA Homes 49 Traffic Impact Study
56 APPENDIX A Traffic Count Data City of Santa Ana/TAVA Homes Traffic Impact Study
57 MetroCount Traffic Executive Event Counts English (ENU) Datasets: Site: [ ] GRAND AVE (NORTH OF SANTA CLARA AVE) NORTHBOUND Input A: 1 - North bound. - Lane= 0, Added to totals. (/2.000) Input B: 0 - Unused or unknown. - Lane= 0, Excluded from totals. Survey Duration: 14:05 Monday, February 07, 2011 => 14:44 Wednesday, February 09, 2011 File: N09Feb2011.EC0 (Regular) Data type: Axle sensors - Separate (Count) Profile: Filter time: 0:00 Tuesday, February 08, 2011 => 0:00 Wednesday, February 09, 2011 In profile: Events = / (52.03%) * Tuesday, February 08, 2011=13781, 15 minute drops AM Peak (954), AM PHF=0.95
58 MetroCount Traffic Executive Event Counts English (ENU) Datasets: Site: [ ] GRAND AVE (NORTH OF SANTA CLARA AVE) SOUTHBOUND Input A: 3 - South bound. - Lane= 0, Added to totals. (/2.000) Input B: 0 - Unused or unknown. - Lane= 0, Excluded from totals. Survey Duration: 14:06 Monday, February 07, 2011 => 14:42 Wednesday, February 09, 2011 File: S09Feb2011.EC0 (Regular) Data type: Axle sensors - Separate (Count) Profile: Filter time: 0:00 Tuesday, February 08, 2011 => 0:00 Wednesday, February 09, 2011 In profile: Events = / (51.73%) * Tuesday, February 08, 2011=15396, 15 minute drops AM Peak (1874), AM PHF=0.95
59 MetroCount Traffic Executive Event Counts English (ENU) Datasets: Site: [ ] GRAND AVE (SOUTH OF SANTA CLARA AVE) NORTHBOUND Input A: 1 - North bound. - Lane= 0, Added to totals. (/2.000) Input B: 0 - Unused or unknown. - Lane= 0, Excluded from totals. Survey Duration: 13:35 Monday, February 07, 2011 => 14:41 Wednesday, February 09, 2011 File: N09Feb2011.EC0 (Base) Data type: Axle sensors - Separate (Count) Profile: Filter time: 0:00 Tuesday, February 08, 2011 => 0:00 Wednesday, February 09, 2011 In profile: Events = / (51.14%) * Tuesday, February 08, 2011=12994, 15 minute drops AM Peak (899), AM PHF=0.97
60 MetroCount Traffic Executive Event Counts English (ENU) Datasets: Site: [ ] GRAND AVE (SOUTH OF SANTA CLARA AVE) SOUTHBOUND Input A: 3 - South bound. - Lane= 0, Added to totals. (/2.000) Input B: 0 - Unused or unknown. - Lane= 0, Excluded from totals. Survey Duration: 13:37 Monday, February 07, 2011 => 14:42 Wednesday, February 09, 2011 File: S09Feb2011.EC0 (Base) Data type: Axle sensors - Separate (Count) Profile: Filter time: 0:00 Tuesday, February 08, 2011 => 0:00 Wednesday, February 09, 2011 In profile: Events = / (51.21%) * Tuesday, February 08, 2011=13599, 15 minute drops AM Peak (1699), AM PHF=0.97
61 MetroCount Traffic Executive Vehicle Counts English (ENU) Datasets: Site: [ ] WRIGHT ST (SOUTH OF AVALON AVE) NORTHBOUND Direction: 7 - North bound A>B, South bound B>A. Lane: 0 Survey Duration: 17:51 Monday, February 07, 2011 => 14:39 Wednesday, February 09, 2011 File: Feb2011.EC0 (Regular) Data type: Axle sensors - Paired (Class/Speed/Count) Profile: Filter time: 0:00 Tuesday, February 08, 2011 => 0:00 Wednesday, February 09, 2011 Included classes: 1, 2, 3, 4, 5, 6, 7, 8, 9, 10, 11, 12, 13 Direction: North (bound) In profile: Vehicles = 1468 / 5019 (29.25%) * Tuesday, February 08, Total=1468, 15 minute drops AM Peak (196), AM PHF=0.68
62 MetroCount Traffic Executive Vehicle Counts English (ENU) Datasets: Site: [ ] WRIGHT ST (SOUTH OF AVALON AVE) SOUTHBOUND Direction: 7 - North bound A>B, South bound B>A. Lane: 0 Survey Duration: 17:51 Monday, February 07, 2011 => 14:39 Wednesday, February 09, 2011 File: Feb2011.EC0 (Regular) Data type: Axle sensors - Paired (Class/Speed/Count) Profile: Filter time: 0:00 Tuesday, February 08, 2011 => 0:00 Wednesday, February 09, 2011 Included classes: 1, 2, 3, 4, 5, 6, 7, 8, 9, 10, 11, 12, 13 Direction: South (bound) In profile: Vehicles = 1402 / 5019 (27.93%) * Tuesday, February 08, Total=1402, 15 minute drops AM Peak (211), AM PHF=0.69
63 MetroCount Traffic Executive Vehicle Counts English (ENU) Datasets: Site: [ ] LYON ST (NORTH OF SANTA CLARA AVE) NORTHBOUND Direction: 7 - North bound A>B, South bound B>A. Lane: 0 Survey Duration: 16:46 Monday, February 07, 2011 => 14:31 Wednesday, February 09, 2011 File: Feb2011.EC0 (Regular) Data type: Axle sensors - Paired (Class/Speed/Count) Profile: Filter time: 0:00 Tuesday, February 08, 2011 => 0:00 Wednesday, February 09, 2011 Included classes: 1, 2, 3, 4, 5, 6, 7, 8, 9, 10, 11, 12, 13 Direction: North (bound) In profile: Vehicles = 216 / 851 (25.38%) * Tuesday, February 08, Total=216, 15 minute drops AM Peak (17), AM PHF=0.53
64 MetroCount Traffic Executive Vehicle Counts English (ENU) Datasets: Site: [ ] LYON ST (NORTH OF SANTA CLARA AVE) SOUTHBOUND Direction: 7 - North bound A>B, South bound B>A. Lane: 0 Survey Duration: 16:46 Monday, February 07, 2011 => 14:31 Wednesday, February 09, 2011 File: Feb2011.EC0 (Regular) Data type: Axle sensors - Paired (Class/Speed/Count) Profile: Filter time: 0:00 Tuesday, February 08, 2011 => 0:00 Wednesday, February 09, 2011 Included classes: 1, 2, 3, 4, 5, 6, 7, 8, 9, 10, 11, 12, 13 Direction: South (bound) In profile: Vehicles = 260 / 851 (30.55%) * Tuesday, February 08, Total=260, 15 minute drops AM Peak (34), AM PHF=0.85
65 MetroCount Traffic Executive Event Counts English (ENU) Datasets: Site: [ ] TUSTIN AVE (NORTH OF SANTA CLARA AVE) NORTHBOUND Input A: 1 - North bound. - Lane= 0, Added to totals. (/2.000) Input B: 0 - Unused or unknown. - Lane= 0, Excluded from totals. Survey Duration: 15:49 Monday, February 07, 2011 => 14:32 Wednesday, February 09, 2011 File: N09Feb2011.EC0 (Regular) Data type: Axle sensors - Separate (Count) Profile: Filter time: 0:00 Tuesday, February 08, 2011 => 0:00 Wednesday, February 09, 2011 In profile: Events = / (54.65%) * Tuesday, February 08, 2011=13822, 15 minute drops AM Peak (918), AM PHF=0.94
66 MetroCount Traffic Executive Event Counts English (ENU) Datasets: Site: [ ] TUSTIN AVE (NORTH OF SANTA CLARA AVE) SOUTHBOUND Input A: 3 - South bound. - Lane= 0, Added to totals. (/2.000) Input B: 0 - Unused or unknown. - Lane= 0, Excluded from totals. Survey Duration: 15:50 Monday, February 07, 2011 => 14:30 Wednesday, February 09, 2011 File: S09Feb2011.EC0 (Base) Data type: Axle sensors - Separate (Count) Profile: Filter time: 0:00 Tuesday, February 08, 2011 => 0:00 Wednesday, February 09, 2011 In profile: Events = / (53.39%) * Tuesday, February 08, 2011=17929, 15 minute drops AM Peak (2677), AM PHF=0.89
67 MetroCount Traffic Executive Event Counts English (ENU) Datasets: Site: [ ] TUSTIN AVE (SOUTH OF SANTA CLARA AVE) NORTHBOUND Input A: 1 - North bound. - Lane= 0, Added to totals. (/2.000) Input B: 0 - Unused or unknown. - Lane= 0, Excluded from totals. Survey Duration: 16:18 Monday, February 07, 2011 => 14:35 Wednesday, February 09, 2011 File: N09Feb2011.EC0 (Base) Data type: Vehicle sensors - Separate (Count) Profile: Filter time: 0:00 Tuesday, February 08, 2011 => 0:00 Wednesday, February 09, 2011 In profile: Events = / (55.85%) * Tuesday, February 08, 2011=13868, 15 minute drops AM Peak (969), AM PHF=0.95
68 MetroCount Traffic Executive Event Counts English (ENU) Datasets: Site: [ ] TUSTIN AVE (SOUTH OF SANTA CLARA AVE) SOUTHBOUND Input A: 3 - South bound. - Lane= 0, Added to totals. (/2.000) Input B: 0 - Unused or unknown. - Lane= 0, Excluded from totals. Survey Duration: 16:20 Monday, February 07, 2011 => 14:34 Wednesday, February 09, 2011 File: S09Feb2011.EC0 (Base) Data type: Vehicle sensors - Separate (Count) Profile: Filter time: 0:00 Tuesday, February 08, 2011 => 0:00 Wednesday, February 09, 2011 In profile: Events = / (53.78%) * Tuesday, February 08, 2011=17188, 15 minute drops AM Peak (2558), AM PHF=0.93
69 MetroCount Traffic Executive Event Counts English (ENU) Datasets: Site: [ ] SANTA CLARA AVE (GRAND AVE-WRIGHT ST) EASTBOUND Input A: 2 - East bound. - Lane= 0, Added to totals. (/2.000) Input B: 0 - Unused or unknown. - Lane= 0, Excluded from totals. Survey Duration: 14:33 Monday, February 07, 2011 => 14:38 Wednesday, February 09, 2011 File: E09Feb2011.EC0 (Base) Data type: Axle sensors - Separate (Count) Profile: Filter time: 0:00 Tuesday, February 08, 2011 => 0:00 Wednesday, February 09, 2011 In profile: Events = 5561 / (52.17%) * Tuesday, February 08, 2011=5561, 15 minute drops AM Peak (443), AM PHF=0.83
70 MetroCount Traffic Executive Event Counts English (ENU) Datasets: Site: [ ] SANTA CLARA AVE (GRAND AVE-WRIGHT ST) WESTBOUND Input A: 4 - West bound. - Lane= 0, Added to totals. (/2.000) Input B: 0 - Unused or unknown. - Lane= 0, Excluded from totals. Survey Duration: 14:31 Monday, February 07, 2011 => 14:36 Wednesday, February 09, 2011 File: W09Feb2011.EC0 (Regular) Data type: Axle sensors - Separate (Count) Profile: Filter time: 0:00 Tuesday, February 08, 2011 => 0:00 Wednesday, February 09, 2011 In profile: Events = 5113 / 9769 (52.33%) * Tuesday, February 08, 2011=5113, 15 minute drops AM Peak (547), AM PHF=0.83
71 MetroCount Traffic Executive Event Counts English (ENU) Datasets: Site: [ ] SANTA CLARA AVE (WRIGHT ST-LYON ST) EASTBOUND Input A: 2 - East bound. - Lane= 0, Added to totals. (/2.000) Input B: 0 - Unused or unknown. - Lane= 0, Excluded from totals. Survey Duration: 14:56 Monday, February 07, 2011 => 14:33 Wednesday, February 09, 2011 File: E09Feb2011.EC0 (Regular) Data type: Axle sensors - Separate (Count) Profile: Filter time: 0:00 Tuesday, February 08, 2011 => 0:00 Wednesday, February 09, 2011 In profile: Events = 4567 / 8596 (53.12%) * Tuesday, February 08, 2011=4567, 15 minute drops AM Peak (352), AM PHF=0.85
72 MetroCount Traffic Executive Event Counts English (ENU) Datasets: Site: [ ] SANTA CLARA AVE (WRIGHT ST-LYON ST) WESTBOUND Input A: 4 - West bound. - Lane= 0, Added to totals. (/2.000) Input B: 0 - Unused or unknown. - Lane= 0, Excluded from totals. Survey Duration: 14:54 Monday, February 07, 2011 => 14:35 Wednesday, February 09, 2011 File: W09Feb2011.EC0 (Regular) Data type: Axle sensors - Separate (Count) Profile: Filter time: 0:00 Tuesday, February 08, 2011 => 0:00 Wednesday, February 09, 2011 In profile: Events = 4336 / 7998 (54.21%) * Tuesday, February 08, 2011=4336, 15 minute drops AM Peak (377), AM PHF=0.87
73 MetroCount Traffic Executive Event Counts English (ENU) Datasets: Site: [ ] SANTA CLARA AVE (LYON ST-TUSTIN AVE) EASTBOUND Input A: 2 - East bound. - Lane= 0, Added to totals. (/2.000) Input B: 0 - Unused or unknown. - Lane= 0, Excluded from totals. Survey Duration: 15:23 Monday, February 07, 2011 => 14:29 Wednesday, February 09, 2011 File: E09Feb2011.EC0 (Regular) Data type: Axle sensors - Separate (Count) Profile: Filter time: 0:00 Tuesday, February 08, 2011 => 0:00 Wednesday, February 09, 2011 In profile: Events = 4801 / 9058 (53.00%) * Tuesday, February 08, 2011=4801, 15 minute drops AM Peak (400), AM PHF=0.81
74 MetroCount Traffic Executive Event Counts English (ENU) Datasets: Site: [ ] SANTA CLARA AVE (LYON ST-TUSTIN AVE) WESTBOUND Input A: 4 - West bound. - Lane= 0, Added to totals. (/2.000) Input B: 0 - Unused or unknown. - Lane= 0, Excluded from totals. Survey Duration: 15:21 Monday, February 07, 2011 => 14:28 Wednesday, February 09, 2011 File: W09Feb2011.EC0 (Base) Data type: Axle sensors - Separate (Count) Profile: Filter time: 0:00 Tuesday, February 08, 2011 => 0:00 Wednesday, February 09, 2011 In profile: Events = 4189 / 7665 (54.65%) * Tuesday, February 08, 2011=4189, 15 minute drops AM Peak (358), AM PHF=0.88
75 MetroCount Traffic Executive Vehicle Counts English (ENU) Datasets: Site: [ ] AVALON AVE (EAST OF WRIGHT ST) EASTBOUND Direction: 6 - West bound A>B, East bound B>A. Lane: 0 Survey Duration: 17:13 Monday, February 07, 2011 => 14:38 Wednesday, February 09, 2011 File: Feb2011.EC0 (Regular) Data type: Axle sensors - Paired (Class/Speed/Count) Profile: Filter time: 0:00 Tuesday, February 08, 2011 => 0:00 Wednesday, February 09, 2011 Included classes: 1, 2, 3, 4, 5, 6, 7, 8, 9, 10, 11, 12, 13 Direction: East (bound) In profile: Vehicles = 211 / 701 (30.10%) * Tuesday, February 08, Total=211, 15 minute drops AM Peak (14), AM PHF=0.58
76 MetroCount Traffic Executive Vehicle Counts English (ENU) Datasets: Site: [ ] AVALON AVE (EAST OF WRIGHT ST) WESTBOUND Direction: 6 - West bound A>B, East bound B>A. Lane: 0 Survey Duration: 17:13 Monday, February 07, 2011 => 14:38 Wednesday, February 09, 2011 File: Feb2011.EC0 (Regular) Data type: Axle sensors - Paired (Class/Speed/Count) Profile: Filter time: 0:00 Tuesday, February 08, 2011 => 0:00 Wednesday, February 09, 2011 Included classes: 1, 2, 3, 4, 5, 6, 7, 8, 9, 10, 11, 12, 13 Direction: West (bound) In profile: Vehicles = 204 / 701 (29.10%) * Tuesday, February 08, Total=204, 15 minute drops AM Peak (27), AM PHF=0.61
77 City of Santa Ana N/S: Grand Avenue E/W: Santa Clara Avenue Weather: Sunny Counts Unlimited Inc Jaclyn Avenue Moreno Valley, CA File Name : SAGRSCAM Site Code : Start Date : 4/10/2008 Page No : 1 Groups Printed- Total Volume Grand Avenue Southbound Santa Clara Avenue Westbound Grand Avenue Northbound Santa Clara Avenue Eastbound Start Time Left Thru Right App. Total Left Thru Right App. Total Left Thru Right App. Total Left Thru Right App. Total Int. Total 07:00 AM :15 AM :30 AM :45 AM Total :00 AM :15 AM :30 AM :45 AM Total Grand Total Apprch % Total % Grand Avenue Southbound Santa Clara Avenue Westbound Grand Avenue Northbound Santa Clara Avenue Eastbound Start Time Left Thru Right App. Total Left Thru Right App. Total Left Thru Right App. Total Left Thru Right App. Total Int. Total Peak Hour Analysis From 07:00 AM to 08:45 AM - Peak 1 of 1 Peak Hour for Entire Intersection Begins at 07:15 AM 07:15 AM :30 AM :45 AM :00 AM Total Volume % App. Total PHF
78 City of Santa Ana N/S: Grand Avenue E/W: Santa Clara Avenue Weather: Sunny Counts Unlimited Inc Jaclyn Avenue Moreno Valley, CA File Name : SAGRSCAM Site Code : Start Date : 4/10/2008 Page No : 2 Grand Avenue Out In Total Right 1393 Thru 103 Left Peak Hour Data Santa Clara Avenue Out In Total Left 97 Thru 44 Right Peak Hour Begins at 07:15 AM Total Volume North Right Thru Left Out In Total Santa Clara Avenue Left 28 Thru 338 Right Out In Total Grand Avenue Peak Hour Analysis From 07:00 AM to 08:45 AM - Peak 1 of 1 Peak Hour for Each Approach Begins at: 07:15 AM 07:30 AM 08:00 AM 07:15 AM +0 mins mins mins mins Total Volume % App. Total PHF
79 City of Santa Ana N/S: Grand Avenue E/W: Santa Clara Avenue Weather: Sunny Counts Unlimited Inc Jaclyn Avenue Moreno Valley, CA File Name : SAGRSCPM Site Code : Start Date : 4/10/2008 Page No : 1 Groups Printed- Total Volume Grand Avenue Southbound Santa Clara Avenue Westbound Grand Avenue Northbound Santa Clara Avenue Eastbound Start Time Left Thru Right App. Total Left Thru Right App. Total Left Thru Right App. Total Left Thru Right App. Total Int. Total 04:00 PM :15 PM :30 PM :45 PM Total :00 PM :15 PM :30 PM :45 PM Total Grand Total Apprch % Total % Grand Avenue Southbound Santa Clara Avenue Westbound Grand Avenue Northbound Santa Clara Avenue Eastbound Start Time Left Thru Right App. Total Left Thru Right App. Total Left Thru Right App. Total Left Thru Right App. Total Int. Total Peak Hour Analysis From 04:00 PM to 05:45 PM - Peak 1 of 1 Peak Hour for Entire Intersection Begins at 04:30 PM 04:30 PM :45 PM :00 PM :15 PM Total Volume % App. Total PHF
80 City of Santa Ana N/S: Grand Avenue E/W: Santa Clara Avenue Weather: Sunny Counts Unlimited Inc Jaclyn Avenue Moreno Valley, CA File Name : SAGRSCPM Site Code : Start Date : 4/10/2008 Page No : 2 Grand Avenue Out In Total Right 797 Thru 159 Left Peak Hour Data Santa Clara Avenue Out In Total Left 147 Thru 49 Right Peak Hour Begins at 04:30 PM Total Volume North Right Thru Left Out In Total Santa Clara Avenue Left 69 Thru 1158 Right Out In Total Grand Avenue Peak Hour Analysis From 04:00 PM to 05:45 PM - Peak 1 of 1 Peak Hour for Each Approach Begins at: 04:30 PM 05:00 PM 04:45 PM 05:00 PM +0 mins mins mins mins Total Volume % App. Total PHF
81 City of Santa Ana N/S: Lyon Street E/W: Santa Clara Avenue Weather: Sunny Counts Unlimited Inc Jaclyn Avenue Moreno Valley, CA File Name : SALYSCAM Site Code : Start Date : 4/10/2008 Page No : 1 Groups Printed- Total Volume Lyon Street Southbound Santa Clara Avenue Westbound Santa Clara Avenue Eastbound Start Time Left Right App. Total Thru Right App. Total Left Thru App. Total Int. Total 07:00 AM :15 AM :30 AM :45 AM Total :00 AM :15 AM :30 AM :45 AM Total Grand Total Apprch % Total % Lyon Street Southbound Santa Clara Avenue Westbound Santa Clara Avenue Eastbound Start Time Left Right App. Total Thru Right App. Total Left Thru App. Total Int. Total Peak Hour Analysis From 07:00 AM to 08:45 AM - Peak 1 of 1 Peak Hour for Entire Intersection Begins at 07:30 AM 07:30 AM :45 AM :00 AM :15 AM Total Volume % App. Total PHF
82 City of Santa Ana N/S: Lyon Street E/W: Santa Clara Avenue Weather: Sunny Counts Unlimited Inc Jaclyn Avenue Moreno Valley, CA File Name : SALYSCAM Site Code : Start Date : 4/10/2008 Page No : 2 Lyon Street Out In Total Right 11 Left Peak Hour Data Santa Clara Avenue Out In Total Left 237 Thru Peak Hour Begins at 07:30 AM Total Volume North Right Thru Out In Total Santa Clara Avenue Peak Hour Analysis From 07:00 AM to 08:45 AM - Peak 1 of 1 Peak Hour for Each Approach Begins at: 07:15 AM 07:30 AM 07:15 AM +0 mins mins mins mins Total Volume % App. Total PHF
83 City of Santa Ana N/S: Lyon Street E/W: Santa Clara Avenue Weather: Sunny Counts Unlimited Inc Jaclyn Avenue Moreno Valley, CA File Name : SALYSCPM Site Code : Start Date : 4/10/2008 Page No : 1 Groups Printed- Total Volume Lyon Street Southbound Santa Clara Avenue Westbound Santa Clara Avenue Eastbound Start Time Left Right App. Total Thru Right App. Total Left Thru App. Total Int. Total 04:00 PM :15 PM :30 PM :45 PM Total :00 PM :15 PM :30 PM :45 PM Total Grand Total Apprch % Total % Lyon Street Southbound Santa Clara Avenue Westbound Santa Clara Avenue Eastbound Start Time Left Right App. Total Thru Right App. Total Left Thru App. Total Int. Total Peak Hour Analysis From 04:00 PM to 05:45 PM - Peak 1 of 1 Peak Hour for Entire Intersection Begins at 04:30 PM 04:30 PM :45 PM :00 PM :15 PM Total Volume % App. Total PHF
84 City of Santa Ana N/S: Lyon Street E/W: Santa Clara Avenue Weather: Sunny Counts Unlimited Inc Jaclyn Avenue Moreno Valley, CA File Name : SALYSCPM Site Code : Start Date : 4/10/2008 Page No : 2 Lyon Street Out In Total Right 12 Left Peak Hour Data Santa Clara Avenue Out In Total Left 425 Thru Peak Hour Begins at 04:30 PM Total Volume North Right 18 Thru 313 Out In Total Santa Clara Avenue Peak Hour Analysis From 04:00 PM to 05:45 PM - Peak 1 of 1 Peak Hour for Each Approach Begins at: 04:45 PM 05:00 PM 04:30 PM +0 mins mins mins mins Total Volume % App. Total PHF
85 City of Santa Ana N/S: Tustin Avenue E/W: Santa Clara Avenue Weather: Sunny Counts Unlimited Inc Jaclyn Avenue Moreno Valley, CA File Name : SATUSAAM Site Code : Start Date : 4/10/2008 Page No : 1 Groups Printed- Total Volume Tustin Avenue Southbound Santa Clara Avenue Westbound Tustin Avenue Northbound Santa Clara Avenue Eastbound Start Time Left Thru Right App. Total Left Thru Right App. Total Left Thru Right App. Total Left Thru Right App. Total Int. Total 07:00 AM :15 AM :30 AM :45 AM Total :00 AM :15 AM :30 AM :45 AM Total Grand Total Apprch % Total % Tustin Avenue Southbound Santa Clara Avenue Westbound Tustin Avenue Northbound Santa Clara Avenue Eastbound Start Time Left Thru Right App. Total Left Thru Right App. Total Left Thru Right App. Total Left Thru Right App. Total Int. Total Peak Hour Analysis From 07:00 AM to 08:45 AM - Peak 1 of 1 Peak Hour for Entire Intersection Begins at 07:30 AM 07:30 AM :45 AM :00 AM :15 AM Total Volume % App. Total PHF
86 City of Santa Ana N/S: Tustin Avenue E/W: Santa Clara Avenue Weather: Sunny Counts Unlimited Inc Jaclyn Avenue Moreno Valley, CA File Name : SATUSAAM Site Code : Start Date : 4/10/2008 Page No : 2 Tustin Avenue Out In Total Right 1798 Thru 106 Left Peak Hour Data Santa Clara Avenue Out In Total Left 208 Thru 138 Right Peak Hour Begins at 07:30 AM Total Volume North Right Thru Left Out In Total Santa Clara Avenue Left 73 Thru 351 Right Out In Total Tustin Avenue Peak Hour Analysis From 07:00 AM to 08:45 AM - Peak 1 of 1 Peak Hour for Each Approach Begins at: 07:30 AM 07:30 AM 08:00 AM 07:15 AM +0 mins mins mins mins Total Volume % App. Total PHF
87 City of Santa Ana N/S: Tustin Avenue E/W: Santa Clara Avenue Weather: Sunny Counts Unlimited Inc Jaclyn Avenue Moreno Valley, CA File Name : SATUSCPM Site Code : Start Date : 4/10/2008 Page No : 1 Groups Printed- Total Volume Tustin Avenue Southbound Santa Clara Avenue Westbound Tustin Avenue Northbound Santa Clara Avenue Eastbound Start Time Left Thru Right App. Total Left Thru Right App. Total Left Thru Right App. Total Left Thru Right App. Total Int. Total 04:00 PM :15 PM :30 PM :45 PM Total :00 PM :15 PM :30 PM :45 PM Total Grand Total Apprch % Total % Tustin Avenue Southbound Santa Clara Avenue Westbound Tustin Avenue Northbound Santa Clara Avenue Eastbound Start Time Left Thru Right App. Total Left Thru Right App. Total Left Thru Right App. Total Left Thru Right App. Total Int. Total Peak Hour Analysis From 04:00 PM to 05:45 PM - Peak 1 of 1 Peak Hour for Entire Intersection Begins at 05:00 PM 05:00 PM :15 PM :30 PM :45 PM Total Volume % App. Total PHF
88 City of Santa Ana N/S: Tustin Avenue E/W: Santa Clara Avenue Weather: Sunny Counts Unlimited Inc Jaclyn Avenue Moreno Valley, CA File Name : SATUSCPM Site Code : Start Date : 4/10/2008 Page No : 2 Tustin Avenue Out In Total Right 851 Thru 162 Left Peak Hour Data Santa Clara Avenue Out In Total Left 192 Thru 148 Right Peak Hour Begins at 05:00 PM Total Volume North Right Thru Left Out In Total Santa Clara Avenue Left 177 Thru 1339 Right Out In Total Tustin Avenue Peak Hour Analysis From 04:00 PM to 05:45 PM - Peak 1 of 1 Peak Hour for Each Approach Begins at: 04:45 PM 04:45 PM 05:00 PM 04:45 PM +0 mins mins mins mins Total Volume % App. Total PHF
89 City of Santa Ana N/S: Wright Street E/W: Santa Clara Avenue Weather: Sunny Counts Unlimited Inc Jaclyn Avenue Moreno Valley, CA File Name : SAWRSCAM Site Code : Start Date : 4/10/2008 Page No : 1 Groups Printed- Total Volume Wright Street Southbound Santa Clara Avenue Westbound Wright Street Northbound Santa Clara Avenue Eastbound Start Time Left Thru Right App. Total Left Thru Right App. Total Left Thru Right App. Total Left Thru Right App. Total Int. Total 07:00 AM :15 AM :30 AM :45 AM Total :00 AM :15 AM :30 AM :45 AM Total Grand Total Apprch % Total % Wright Street Southbound Santa Clara Avenue Westbound Wright Street Northbound Santa Clara Avenue Eastbound Start Time Left Thru Right App. Total Left Thru Right App. Total Left Thru Right App. Total Left Thru Right App. Total Int. Total Peak Hour Analysis From 07:00 AM to 08:45 AM - Peak 1 of 1 Peak Hour for Entire Intersection Begins at 07:30 AM 07:30 AM :45 AM :00 AM :15 AM Total Volume % App. Total PHF
90 City of Santa Ana N/S: Wright Street E/W: Santa Clara Avenue Weather: Sunny Counts Unlimited Inc Jaclyn Avenue Moreno Valley, CA File Name : SAWRSCAM Site Code : Start Date : 4/10/2008 Page No : 2 Wright Street Out In Total Right 5 Thru 2 Left Peak Hour Data Santa Clara Avenue Out In Total Left 208 Thru 73 Right Peak Hour Begins at 07:30 AM Total Volume North Right Thru Left Out In Total Santa Clara Avenue Left 42 Thru 0 Right Out In Total Wright Street Peak Hour Analysis From 07:00 AM to 08:45 AM - Peak 1 of 1 Peak Hour for Each Approach Begins at: 07:15 AM 07:30 AM 07:15 AM 07:30 AM +0 mins mins mins mins Total Volume % App. Total PHF
91 City of Santa Ana N/S: Wright Street E/W: Santa Clara Avenue Weather: Sunny Counts Unlimited Inc Jaclyn Avenue Moreno Valley, CA File Name : SAWRSCPM Site Code : Start Date : 4/10/2008 Page No : 1 Groups Printed- Total Volume Wright Street Southbound Santa Clara Avenue Westbound Wright Street Northbound Santa Clara Avenue Eastbound Start Time Left Thru Right App. Total Left Thru Right App. Total Left Thru Right App. Total Left Thru Right App. Total Int. Total 04:00 PM :15 PM :30 PM :45 PM Total :00 PM :15 PM :30 PM :45 PM Total Grand Total Apprch % Total % Wright Street Southbound Santa Clara Avenue Westbound Wright Street Northbound Santa Clara Avenue Eastbound Start Time Left Thru Right App. Total Left Thru Right App. Total Left Thru Right App. Total Left Thru Right App. Total Int. Total Peak Hour Analysis From 04:00 PM to 05:45 PM - Peak 1 of 1 Peak Hour for Entire Intersection Begins at 04:30 PM 04:30 PM :45 PM :00 PM :15 PM Total Volume % App. Total PHF
92 City of Santa Ana N/S: Wright Street E/W: Santa Clara Avenue Weather: Sunny Counts Unlimited Inc Jaclyn Avenue Moreno Valley, CA File Name : SAWRSCPM Site Code : Start Date : 4/10/2008 Page No : 2 Wright Street Out In Total Right 0 Thru 1 Left Peak Hour Data Santa Clara Avenue Out In Total Left 393 Thru 93 Right Peak Hour Begins at 04:30 PM Total Volume North Right Thru Left Out In Total Santa Clara Avenue Left 114 Thru 1 Right Out In Total Wright Street Peak Hour Analysis From 04:00 PM to 05:45 PM - Peak 1 of 1 Peak Hour for Each Approach Begins at: 04:00 PM 05:00 PM 05:00 PM 04:30 PM +0 mins mins mins mins Total Volume % App. Total PHF
93
94 APPENDIX B Intersection Level of Service Worksheets Existing Conditions City of Santa Ana/TAVA Homes Traffic Impact Study
95 Existing AM Mon Feb 28, :21:11 Page 1-1 Existing AM Scenario Report Scenario: Existing AM Command: Existing AM Volume: Existing AM Geometry: Existing Impact Fee: Default Impact Fee Trip Generation: None Trip Distribution: None Paths: Default Path Routes: Default Route Configuration: Default Configuration Existing AM Mon Feb 28, :21:11 Page 2-1 Existing AM Impact Analysis Report Level Of Service Intersection Base Future Change Del/ V/ Del/ V/ in LOS Veh C LOS Veh C # 1 Grand Av (N/S) / Santa Clara A C xxxxx C xxxxx V/C # 2 Wright St (N/S) / Santa Clara B B D/V # 4 Lyon St (N/S) / Santa Clara Av B B D/V # 5 Tustin Ave (N/S) / Santa Clara B xxxxx B xxxxx V/C # 6 Wright St (N/S) / Avalon Ave ( A A D/V Traffix (c) 2008 Dowling Assoc. Licensed to KOA CORP, MONTEREY PK Traffix (c) 2008 Dowling Assoc. Licensed to KOA CORP, MONTEREY PK
96 Existing AM Mon Feb 28, :21:11 Page 3-1 Existing AM Level Of Service Computation Report ICU 1(Loss as Cycle Length %) Method (Future Volume Alternative) Intersection #1 Grand Av (N/S) / Santa Clara Ave (E/W) Cycle (sec): 100 Critical Vol./Cap.(X): Loss Time (sec): 5 Average Delay (sec/veh): xxxxxx Optimal Cycle: 42 Level Of Service: C Approach: North Bound South Bound East Bound West Bound Movement: L - T - R L - T - R L - T - R L - T - R Control: Protected Protected Permitted Permitted Rights: Include Include Include Include Min. Green: Y+R: Lanes: Volume Module: Base Vol: Growth Adj: Initial Bse: Added Vol: PasserByVol: Initial Fut: User Adj: PHF Adj: PHF Volume: Reduct Vol: Reduced Vol: PCE Adj: MLF Adj: FinalVolume: Saturation Flow Module: Sat/Lane: Adjustment: Lanes: Final Sat.: Capacity Analysis Module: Vol/Sat: Crit Moves: **** **** **** **** Existing AM Mon Feb 28, :21:11 Page 4-1 Existing AM Level Of Service Computation Report 2000 HCM Unsignalized Method (Future Volume Alternative) Intersection #2 Wright St (N/S) / Santa Clara Ave (E/W) Average Delay (sec/veh): 2.6 Worst Case Level Of Service: B[ 13.9] Approach: North Bound South Bound East Bound West Bound Movement: L - T - R L - T - R L - T - R L - T - R Control: Stop Sign Stop Sign Uncontrolled Uncontrolled Rights: Include Include Include Include Lanes: 0 0 1! ! ! Volume Module: Base Vol: Growth Adj: Initial Bse: Added Vol: PasserByVol: Initial Fut: User Adj: PHF Adj: PHF Volume: Reduct Vol: FinalVolume: Critical Gap Module: Critical Gp: xxxx xxxxx 4.1 xxxx xxxxx FollowUpTim: xxxx xxxxx 2.2 xxxx xxxxx Capacity Module: Cnflict Vol: xxxx xxxxx 297 xxxx xxxxx Potent Cap.: xxxx xxxxx 1276 xxxx xxxxx Move Cap.: xxxx xxxxx 1276 xxxx xxxxx Volume/Cap: xxxx xxxx 0.03 xxxx xxxx Level Of Service Module: 2Way95thQ: xxxx xxxx xxxxx xxxx xxxx xxxxx 0.0 xxxx xxxxx 0.1 xxxx xxxxx Control Del:xxxxx xxxx xxxxx xxxxx xxxx xxxxx 7.8 xxxx xxxxx 7.9 xxxx xxxxx LOS by Move: * * * * * * A * * A * * Movement: LT - LTR - RT LT - LTR - RT LT - LTR - RT LT - LTR - RT Shared Cap.: xxxx 489 xxxxx xxxx 604 xxxxx xxxx xxxx xxxxx xxxx xxxx xxxxx SharedQueue:xxxxx 0.6 xxxxx xxxxx 0.2 xxxxx xxxxx xxxx xxxxx 0.1 xxxx xxxxx Shrd ConDel:xxxxx 13.9 xxxxx xxxxx 11.3 xxxxx xxxxx xxxx xxxxx 7.9 xxxx xxxxx Shared LOS: * B * * B * * * * A * * ApproachDel: xxxxxx xxxxxx ApproachLOS: B B * * Note: Queue reported is the number of cars per lane. Traffix (c) 2008 Dowling Assoc. Licensed to KOA CORP, MONTEREY PK Traffix (c) 2008 Dowling Assoc. Licensed to KOA CORP, MONTEREY PK
97 Existing AM Mon Feb 28, :21:11 Page 5-1 Existing AM Level Of Service Computation Report 2000 HCM Unsignalized Method (Future Volume Alternative) Intersection #4 Lyon St (N/S) / Santa Clara Ave (E/W) Average Delay (sec/veh): 0.4 Worst Case Level Of Service: B[ 11.5] Approach: North Bound South Bound East Bound West Bound Movement: L - T - R L - T - R L - T - R L - T - R Control: Stop Sign Stop Sign Uncontrolled Uncontrolled Rights: Include Include Include Include Lanes: ! Volume Module: Base Vol: Growth Adj: Initial Bse: Added Vol: PasserByVol: Initial Fut: User Adj: PHF Adj: PHF Volume: Reduct Vol: FinalVolume: Critical Gap Module: Critical Gp:xxxxx xxxx xxxxx xxxx xxxxx xxxxx xxxx xxxxx FollowUpTim:xxxxx xxxx xxxxx xxxx xxxxx xxxxx xxxx xxxxx Capacity Module: Cnflict Vol: xxxx xxxx xxxxx xxxx xxxxx xxxx xxxx xxxxx Potent Cap.: xxxx xxxx xxxxx xxxx xxxxx xxxx xxxx xxxxx Move Cap.: xxxx xxxx xxxxx xxxx xxxxx xxxx xxxx xxxxx Volume/Cap: xxxx xxxx xxxx xxxx xxxx xxxx xxxx xxxx Level Of Service Module: 2Way95thQ: xxxx xxxx xxxxx xxxx xxxx xxxxx 0.0 xxxx xxxxx xxxx xxxx xxxxx Control Del:xxxxx xxxx xxxxx xxxxx xxxx xxxxx 7.8 xxxx xxxxx xxxxx xxxx xxxxx LOS by Move: * * * * * * A * * * * * Movement: LT - LTR - RT LT - LTR - RT LT - LTR - RT LT - LTR - RT Shared Cap.: xxxx xxxx xxxxx xxxx 574 xxxxx xxxx xxxx xxxxx xxxx xxxx xxxxx SharedQueue:xxxxx xxxx xxxxx xxxxx 0.1 xxxxx 0.0 xxxx xxxxx xxxxx xxxx xxxxx Shrd ConDel:xxxxx xxxx xxxxx xxxxx 11.5 xxxxx 7.8 xxxx xxxxx xxxxx xxxx xxxxx Shared LOS: * * * * B * A * * * * * ApproachDel: xxxxxx 11.5 xxxxxx xxxxxx ApproachLOS: * B * * Note: Queue reported is the number of cars per lane. Existing AM Mon Feb 28, :21:11 Page 6-1 Existing AM Level Of Service Computation Report ICU 1(Loss as Cycle Length %) Method (Future Volume Alternative) Intersection #5 Tustin Ave (N/S) / Santa Clara Ave (E/W) Cycle (sec): 100 Critical Vol./Cap.(X): Loss Time (sec): 5 Average Delay (sec/veh): xxxxxx Optimal Cycle: 35 Level Of Service: B Approach: North Bound South Bound East Bound West Bound Movement: L - T - R L - T - R L - T - R L - T - R Control: Protected Protected Permitted Permitted Rights: Include Include Include Include Min. Green: Y+R: Lanes: Volume Module: Base Vol: Growth Adj: Initial Bse: Added Vol: PasserByVol: Initial Fut: User Adj: PHF Adj: PHF Volume: Reduct Vol: Reduced Vol: PCE Adj: MLF Adj: FinalVolume: Saturation Flow Module: Sat/Lane: Adjustment: Lanes: Final Sat.: Capacity Analysis Module: Vol/Sat: Crit Moves: **** **** **** **** Traffix (c) 2008 Dowling Assoc. Licensed to KOA CORP, MONTEREY PK Traffix (c) 2008 Dowling Assoc. Licensed to KOA CORP, MONTEREY PK
98 Existing AM Mon Feb 28, :21:11 Page 7-1 Existing AM Level Of Service Computation Report 2000 HCM Unsignalized Method (Future Volume Alternative) Intersection #6 Wright St (N/S) / Avalon Ave (E/W) Average Delay (sec/veh): 0.6 Worst Case Level Of Service: A[ 9.8] Approach: North Bound South Bound East Bound West Bound Movement: L - T - R L - T - R L - T - R L - T - R Control: Uncontrolled Uncontrolled Stop Sign Stop Sign Rights: Include Include Include Include Lanes: ! 0 0 Volume Module: Base Vol: Growth Adj: Initial Bse: Added Vol: PasserByVol: Initial Fut: User Adj: PHF Adj: PHF Volume: Reduct Vol: FinalVolume: Critical Gap Module: Critical Gp:xxxxx xxxx xxxxx 4.1 xxxx xxxxx xxxxx xxxx xxxxx FollowUpTim:xxxxx xxxx xxxxx 2.2 xxxx xxxxx xxxxx xxxx xxxxx Capacity Module: Cnflict Vol: xxxx xxxx xxxxx 184 xxxx xxxxx xxxx xxxx xxxxx Potent Cap.: xxxx xxxx xxxxx 1403 xxxx xxxxx xxxx xxxx xxxxx Move Cap.: xxxx xxxx xxxxx 1403 xxxx xxxxx xxxx xxxx xxxxx Volume/Cap: xxxx xxxx xxxx 0.00 xxxx xxxx xxxx xxxx xxxx Level Of Service Module: 2Way95thQ: xxxx xxxx xxxxx 0.0 xxxx xxxxx xxxx xxxx xxxxx xxxx xxxx xxxxx Control Del:xxxxx xxxx xxxxx 7.6 xxxx xxxxx xxxxx xxxx xxxxx xxxxx xxxx xxxxx LOS by Move: * * * A * * * * * * * * Movement: LT - LTR - RT LT - LTR - RT LT - LTR - RT LT - LTR - RT Shared Cap.: xxxx xxxx xxxxx xxxx xxxx xxxxx xxxx xxxx xxxxx xxxx 779 xxxxx SharedQueue:xxxxx xxxx xxxxx 0.0 xxxx xxxxx xxxxx xxxx xxxxx xxxxx 0.1 xxxxx Shrd ConDel:xxxxx xxxx xxxxx 7.6 xxxx xxxxx xxxxx xxxx xxxxx xxxxx 9.8 xxxxx Shared LOS: * * * A * * * * * * A * ApproachDel: xxxxxx xxxxxx xxxxxx 9.8 ApproachLOS: * * * A Note: Queue reported is the number of cars per lane. Traffix (c) 2008 Dowling Assoc. Licensed to KOA CORP, MONTEREY PK
99 Existing PM Mon Feb 28, :22:00 Page 1-1 Existing PM Scenario Report Scenario: Existing PM Command: Existing PM Volume: Existing PM Geometry: Existing Impact Fee: Default Impact Fee Trip Generation: None Trip Distribution: None Paths: Default Path Routes: Default Route Configuration: Default Configuration Existing PM Mon Feb 28, :22:00 Page 2-1 Existing PM Impact Analysis Report Level Of Service Intersection Base Future Change Del/ V/ Del/ V/ in LOS Veh C LOS Veh C # 1 Grand Av (N/S) / Santa Clara A B xxxxx B xxxxx V/C # 2 Wright St (N/S) / Santa Clara D D D/V # 4 Lyon St (N/S) / Santa Clara Av B B D/V # 5 Tustin Ave (N/S) / Santa Clara A xxxxx A xxxxx V/C # 6 Wright St (N/S) / Avalon Ave ( A A D/V Traffix (c) 2008 Dowling Assoc. Licensed to KOA CORP, MONTEREY PK Traffix (c) 2008 Dowling Assoc. Licensed to KOA CORP, MONTEREY PK
100 Existing PM Mon Feb 28, :22:00 Page 3-1 Existing PM Level Of Service Computation Report ICU 1(Loss as Cycle Length %) Method (Future Volume Alternative) Intersection #1 Grand Av (N/S) / Santa Clara Ave (E/W) Cycle (sec): 100 Critical Vol./Cap.(X): Loss Time (sec): 5 Average Delay (sec/veh): xxxxxx Optimal Cycle: 32 Level Of Service: B Approach: North Bound South Bound East Bound West Bound Movement: L - T - R L - T - R L - T - R L - T - R Control: Protected Protected Permitted Permitted Rights: Include Include Include Include Min. Green: Y+R: Lanes: Volume Module: Base Vol: Growth Adj: Initial Bse: Added Vol: PasserByVol: Initial Fut: User Adj: PHF Adj: PHF Volume: Reduct Vol: Reduced Vol: PCE Adj: MLF Adj: FinalVolume: Saturation Flow Module: Sat/Lane: Adjustment: Lanes: Final Sat.: Capacity Analysis Module: Vol/Sat: Crit Moves: **** **** **** **** Existing PM Mon Feb 28, :22:00 Page 4-1 Existing PM Level Of Service Computation Report 2000 HCM Unsignalized Method (Future Volume Alternative) Intersection #2 Wright St (N/S) / Santa Clara Ave (E/W) Average Delay (sec/veh): 5.1 Worst Case Level Of Service: D[ 30.0] Approach: North Bound South Bound East Bound West Bound Movement: L - T - R L - T - R L - T - R L - T - R Control: Stop Sign Stop Sign Uncontrolled Uncontrolled Rights: Include Include Include Include Lanes: 0 0 1! ! ! ! 0 0 Volume Module: Base Vol: Growth Adj: Initial Bse: Added Vol: PasserByVol: Initial Fut: User Adj: PHF Adj: PHF Volume: Reduct Vol: FinalVolume: Critical Gap Module: Critical Gp: xxxx xxxxx 4.1 xxxx xxxxx FollowUpTim: xxxx xxxxx 2.2 xxxx xxxxx Capacity Module: Cnflict Vol: xxxx xxxxx 513 xxxx xxxxx Potent Cap.: xxxx xxxxx 1063 xxxx xxxxx Move Cap.: xxxx xxxxx 1063 xxxx xxxxx Volume/Cap: xxxx xxxx 0.03 xxxx xxxx Level Of Service Module: 2Way95thQ: xxxx xxxx xxxxx xxxx xxxx xxxxx 0.0 xxxx xxxxx 0.1 xxxx xxxxx Control Del:xxxxx xxxx xxxxx xxxxx xxxx xxxxx 7.9 xxxx xxxxx 8.5 xxxx xxxxx LOS by Move: * * * * * * A * * A * * Movement: LT - LTR - RT LT - LTR - RT LT - LTR - RT LT - LTR - RT Shared Cap.: xxxx 296 xxxxx xxxx 615 xxxxx xxxx xxxx xxxxx xxxx xxxx xxxxx SharedQueue:xxxxx 2.9 xxxxx xxxxx 0.1 xxxxx xxxxx xxxx xxxxx xxxxx xxxx xxxxx Shrd ConDel:xxxxx 30.0 xxxxx xxxxx 11.0 xxxxx xxxxx xxxx xxxxx xxxxx xxxx xxxxx Shared LOS: * D * * B * * * * * * * ApproachDel: xxxxxx xxxxxx ApproachLOS: D B * * Note: Queue reported is the number of cars per lane. Traffix (c) 2008 Dowling Assoc. Licensed to KOA CORP, MONTEREY PK Traffix (c) 2008 Dowling Assoc. Licensed to KOA CORP, MONTEREY PK
101 Existing PM Mon Feb 28, :22:00 Page 5-1 Existing PM Level Of Service Computation Report 2000 HCM Unsignalized Method (Future Volume Alternative) Intersection #4 Lyon St (N/S) / Santa Clara Ave (E/W) Average Delay (sec/veh): 0.3 Worst Case Level Of Service: B[ 13.7] Approach: North Bound South Bound East Bound West Bound Movement: L - T - R L - T - R L - T - R L - T - R Control: Stop Sign Stop Sign Uncontrolled Uncontrolled Rights: Include Include Include Include Lanes: ! Volume Module: Base Vol: Growth Adj: Initial Bse: Added Vol: PasserByVol: Initial Fut: User Adj: PHF Adj: PHF Volume: Reduct Vol: FinalVolume: Critical Gap Module: Critical Gp:xxxxx xxxx xxxxx xxxxx xxxx xxxxx xxxxx xxxx xxxxx FollowUpTim:xxxxx xxxx xxxxx xxxxx xxxx xxxxx xxxxx xxxx xxxxx Capacity Module: Cnflict Vol: xxxx xxxx xxxxx xxxx xxxx xxxxx xxxx xxxx xxxxx Potent Cap.: xxxx xxxx xxxxx xxxx xxxx xxxxx xxxx xxxx xxxxx Move Cap.: xxxx xxxx xxxxx xxxx xxxx xxxxx xxxx xxxx xxxxx Volume/Cap: xxxx xxxx xxxx xxxx xxxx xxxx xxxx xxxx xxxx Level Of Service Module: 2Way95thQ: xxxx xxxx xxxxx xxxx xxxx xxxxx xxxx xxxx xxxxx xxxx xxxx xxxxx Control Del:xxxxx xxxx xxxxx xxxxx xxxx xxxxx xxxxx xxxx xxxxx xxxxx xxxx xxxxx LOS by Move: * * * * * * * * * * * * Movement: LT - LTR - RT LT - LTR - RT LT - LTR - RT LT - LTR - RT Shared Cap.: xxxx xxxx xxxxx xxxx 433 xxxxx xxxx xxxx xxxxx xxxx xxxx xxxxx SharedQueue:xxxxx xxxx xxxxx xxxxx 0.1 xxxxx xxxxx xxxx xxxxx xxxxx xxxx xxxxx Shrd ConDel:xxxxx xxxx xxxxx xxxxx 13.7 xxxxx xxxxx xxxx xxxxx xxxxx xxxx xxxxx Shared LOS: * * * * B * * * * * * * ApproachDel: xxxxxx 13.7 xxxxxx xxxxxx ApproachLOS: * B * * Note: Queue reported is the number of cars per lane. Existing PM Mon Feb 28, :22:00 Page 6-1 Existing PM Level Of Service Computation Report ICU 1(Loss as Cycle Length %) Method (Future Volume Alternative) Intersection #5 Tustin Ave (N/S) / Santa Clara Ave (E/W) Cycle (sec): 100 Critical Vol./Cap.(X): Loss Time (sec): 5 Average Delay (sec/veh): xxxxxx Optimal Cycle: 28 Level Of Service: A Approach: North Bound South Bound East Bound West Bound Movement: L - T - R L - T - R L - T - R L - T - R Control: Protected Protected Permitted Permitted Rights: Include Include Include Include Min. Green: Y+R: Lanes: Volume Module: Base Vol: Growth Adj: Initial Bse: Added Vol: PasserByVol: Initial Fut: User Adj: PHF Adj: PHF Volume: Reduct Vol: Reduced Vol: PCE Adj: MLF Adj: FinalVolume: Saturation Flow Module: Sat/Lane: Adjustment: Lanes: Final Sat.: Capacity Analysis Module: Vol/Sat: Crit Moves: **** **** **** **** Traffix (c) 2008 Dowling Assoc. Licensed to KOA CORP, MONTEREY PK Traffix (c) 2008 Dowling Assoc. Licensed to KOA CORP, MONTEREY PK
102 Existing PM Mon Feb 28, :22:00 Page 7-1 Existing PM Level Of Service Computation Report 2000 HCM Unsignalized Method (Future Volume Alternative) Intersection #6 Wright St (N/S) / Avalon Ave (E/W) Average Delay (sec/veh): 1.0 Worst Case Level Of Service: A[ 9.5] Approach: North Bound South Bound East Bound West Bound Movement: L - T - R L - T - R L - T - R L - T - R Control: Uncontrolled Uncontrolled Stop Sign Stop Sign Rights: Include Include Include Include Lanes: ! 0 0 Volume Module: Base Vol: Growth Adj: Initial Bse: Added Vol: PasserByVol: Initial Fut: User Adj: PHF Adj: PHF Volume: Reduct Vol: FinalVolume: Critical Gap Module: Critical Gp:xxxxx xxxx xxxxx 4.1 xxxx xxxxx xxxxx xxxx xxxxx FollowUpTim:xxxxx xxxx xxxxx 2.2 xxxx xxxxx xxxxx xxxx xxxxx Capacity Module: Cnflict Vol: xxxx xxxx xxxxx 181 xxxx xxxxx xxxx xxxx xxxxx Potent Cap.: xxxx xxxx xxxxx 1407 xxxx xxxxx xxxx xxxx xxxxx Move Cap.: xxxx xxxx xxxxx 1407 xxxx xxxxx xxxx xxxx xxxxx Volume/Cap: xxxx xxxx xxxx 0.02 xxxx xxxx xxxx xxxx xxxx Level Of Service Module: 2Way95thQ: xxxx xxxx xxxxx 0.1 xxxx xxxxx xxxx xxxx xxxxx xxxx xxxx xxxxx Control Del:xxxxx xxxx xxxxx 7.6 xxxx xxxxx xxxxx xxxx xxxxx xxxxx xxxx xxxxx LOS by Move: * * * A * * * * * * * * Movement: LT - LTR - RT LT - LTR - RT LT - LTR - RT LT - LTR - RT Shared Cap.: xxxx xxxx xxxxx xxxx xxxx xxxxx xxxx xxxx xxxxx xxxx 810 xxxxx SharedQueue:xxxxx xxxx xxxxx 0.1 xxxx xxxxx xxxxx xxxx xxxxx xxxxx 0.1 xxxxx Shrd ConDel:xxxxx xxxx xxxxx 7.6 xxxx xxxxx xxxxx xxxx xxxxx xxxxx 9.5 xxxxx Shared LOS: * * * A * * * * * * A * ApproachDel: xxxxxx xxxxxx xxxxxx 9.5 ApproachLOS: * * * A Note: Queue reported is the number of cars per lane. Traffix (c) 2008 Dowling Assoc. Licensed to KOA CORP, MONTEREY PK
103 APPENDIX C Intersection Level of Service Worksheets Future Conditions City of Santa Ana/TAVA Homes Traffic Impact Study
104 Near AM Mon Feb 28, :23:51 Page 1-1 Near Term AM Without Project Scenario Report Scenario: Near AM Command: Near Term AM Volume: Near Term AM Geometry: Existing Impact Fee: Default Impact Fee Trip Generation: AM Trip Distribution: Project Paths: Default Path Routes: Default Route Configuration: Default Configuration Near AM Mon Feb 28, :23:51 Page 2-1 Near Term AM Without Project Trip Generation Report Forecast for AM Zone Rate Rate Trips Trips Total % Of # Subzone Amount Units In Out In Out Trips Total Town and Cou 1.00 condo/townhous Zone 7 Subtotal Olen Propert 1.00 project Zone 8 Subtotal Renaissance 1.00 project Zone 12 Subtotal Town and Cou 1.00 Medical-dental Zone 13 Subtotal CHOC 1.00 Hospital Zone 14 Subtotal Alliance Chu 1.00 project Zone 15 Subtotal TOTAL Traffix (c) 2008 Dowling Assoc. Licensed to KOA CORP, MONTEREY PK Traffix (c) 2008 Dowling Assoc. Licensed to KOA CORP, MONTEREY PK
105 Near AM Mon Feb 28, :23:52 Page 3-1 Near Term AM Without Project Impact Analysis Report Level Of Service Intersection Base Future Change Del/ V/ Del/ V/ in LOS Veh C LOS Veh C # 1 Grand Av (N/S) / Santa Clara A C xxxxx C xxxxx V/C # 2 Wright St (N/S) / Santa Clara B B D/V # 4 Lyon St (N/S) / Santa Clara Av B B D/V # 5 Tustin Ave (N/S) / Santa Clara B xxxxx B xxxxx V/C # 6 Wright St (N/S) / Avalon Ave ( A A D/V Near AM Mon Feb 28, :23:52 Page 4-1 Near Term AM Without Project Level Of Service Computation Report ICU 1(Loss as Cycle Length %) Method (Future Volume Alternative) Intersection #1 Grand Av (N/S) / Santa Clara Ave (E/W) Cycle (sec): 100 Critical Vol./Cap.(X): Loss Time (sec): 5 Average Delay (sec/veh): xxxxxx Optimal Cycle: 46 Level Of Service: C Approach: North Bound South Bound East Bound West Bound Movement: L - T - R L - T - R L - T - R L - T - R Control: Protected Protected Permitted Permitted Rights: Include Include Include Include Min. Green: Y+R: Lanes: Volume Module: Base Vol: Growth Adj: Initial Bse: Added Vol: PasserByVol: Initial Fut: User Adj: PHF Adj: PHF Volume: Reduct Vol: Reduced Vol: PCE Adj: MLF Adj: FinalVolume: Saturation Flow Module: Sat/Lane: Adjustment: Lanes: Final Sat.: Capacity Analysis Module: Vol/Sat: Crit Moves: **** **** **** **** Traffix (c) 2008 Dowling Assoc. Licensed to KOA CORP, MONTEREY PK Traffix (c) 2008 Dowling Assoc. Licensed to KOA CORP, MONTEREY PK
106 Near AM Mon Feb 28, :23:52 Page 5-1 Near Term AM Without Project Level Of Service Computation Report 2000 HCM Unsignalized Method (Future Volume Alternative) Intersection #2 Wright St (N/S) / Santa Clara Ave (E/W) Average Delay (sec/veh): 2.7 Worst Case Level Of Service: B[ 14.4] Approach: North Bound South Bound East Bound West Bound Movement: L - T - R L - T - R L - T - R L - T - R Control: Stop Sign Stop Sign Uncontrolled Uncontrolled Rights: Include Include Include Include Lanes: 0 0 1! ! ! Volume Module: Base Vol: Growth Adj: Initial Bse: Added Vol: PasserByVol: Initial Fut: User Adj: PHF Adj: PHF Volume: Reduct Vol: FinalVolume: Critical Gap Module: Critical Gp: xxxx xxxxx 4.1 xxxx xxxxx FollowUpTim: xxxx xxxxx 2.2 xxxx xxxxx Capacity Module: Cnflict Vol: xxxx xxxxx 309 xxxx xxxxx Potent Cap.: xxxx xxxxx 1263 xxxx xxxxx Move Cap.: xxxx xxxxx 1263 xxxx xxxxx Volume/Cap: xxxx xxxx 0.03 xxxx xxxx Level Of Service Module: 2Way95thQ: xxxx xxxx xxxxx xxxx xxxx xxxxx 0.0 xxxx xxxxx 0.1 xxxx xxxxx Control Del:xxxxx xxxx xxxxx xxxxx xxxx xxxxx 7.8 xxxx xxxxx 7.9 xxxx xxxxx LOS by Move: * * * * * * A * * A * * Movement: LT - LTR - RT LT - LTR - RT LT - LTR - RT LT - LTR - RT Shared Cap.: xxxx 471 xxxxx xxxx 587 xxxxx xxxx xxxx xxxxx xxxx xxxx xxxxx SharedQueue:xxxxx 0.7 xxxxx xxxxx 0.2 xxxxx xxxxx xxxx xxxxx 0.1 xxxx xxxxx Shrd ConDel:xxxxx 14.4 xxxxx xxxxx 11.5 xxxxx xxxxx xxxx xxxxx 7.9 xxxx xxxxx Shared LOS: * B * * B * * * * A * * ApproachDel: xxxxxx xxxxxx ApproachLOS: B B * * Note: Queue reported is the number of cars per lane. Near AM Mon Feb 28, :23:52 Page 6-1 Near Term AM Without Project Level Of Service Computation Report 2000 HCM Unsignalized Method (Future Volume Alternative) Intersection #4 Lyon St (N/S) / Santa Clara Ave (E/W) Average Delay (sec/veh): 0.4 Worst Case Level Of Service: B[ 11.7] Approach: North Bound South Bound East Bound West Bound Movement: L - T - R L - T - R L - T - R L - T - R Control: Stop Sign Stop Sign Uncontrolled Uncontrolled Rights: Include Include Include Include Lanes: ! Volume Module: Base Vol: Growth Adj: Initial Bse: Added Vol: PasserByVol: Initial Fut: User Adj: PHF Adj: PHF Volume: Reduct Vol: FinalVolume: Critical Gap Module: Critical Gp:xxxxx xxxx xxxxx xxxx xxxxx xxxxx xxxx xxxxx FollowUpTim:xxxxx xxxx xxxxx xxxx xxxxx xxxxx xxxx xxxxx Capacity Module: Cnflict Vol: xxxx xxxx xxxxx xxxx xxxxx xxxx xxxx xxxxx Potent Cap.: xxxx xxxx xxxxx xxxx xxxxx xxxx xxxx xxxxx Move Cap.: xxxx xxxx xxxxx xxxx xxxxx xxxx xxxx xxxxx Volume/Cap: xxxx xxxx xxxx xxxx xxxx xxxx xxxx xxxx Level Of Service Module: 2Way95thQ: xxxx xxxx xxxxx xxxx xxxx xxxxx 0.0 xxxx xxxxx xxxx xxxx xxxxx Control Del:xxxxx xxxx xxxxx xxxxx xxxx xxxxx 7.9 xxxx xxxxx xxxxx xxxx xxxxx LOS by Move: * * * * * * A * * * * * Movement: LT - LTR - RT LT - LTR - RT LT - LTR - RT LT - LTR - RT Shared Cap.: xxxx xxxx xxxxx xxxx 556 xxxxx xxxx xxxx xxxxx xxxx xxxx xxxxx SharedQueue:xxxxx xxxx xxxxx xxxxx 0.1 xxxxx 0.0 xxxx xxxxx xxxxx xxxx xxxxx Shrd ConDel:xxxxx xxxx xxxxx xxxxx 11.7 xxxxx 7.9 xxxx xxxxx xxxxx xxxx xxxxx Shared LOS: * * * * B * A * * * * * ApproachDel: xxxxxx 11.7 xxxxxx xxxxxx ApproachLOS: * B * * Note: Queue reported is the number of cars per lane. Traffix (c) 2008 Dowling Assoc. Licensed to KOA CORP, MONTEREY PK Traffix (c) 2008 Dowling Assoc. Licensed to KOA CORP, MONTEREY PK
107 Near AM Mon Feb 28, :23:52 Page 7-1 Near Term AM Without Project Level Of Service Computation Report ICU 1(Loss as Cycle Length %) Method (Future Volume Alternative) Intersection #5 Tustin Ave (N/S) / Santa Clara Ave (E/W) Cycle (sec): 100 Critical Vol./Cap.(X): Loss Time (sec): 5 Average Delay (sec/veh): xxxxxx Optimal Cycle: 37 Level Of Service: B Approach: North Bound South Bound East Bound West Bound Movement: L - T - R L - T - R L - T - R L - T - R Control: Protected Protected Permitted Permitted Rights: Include Include Include Include Min. Green: Y+R: Lanes: Volume Module: Base Vol: Growth Adj: Initial Bse: Added Vol: PasserByVol: Initial Fut: User Adj: PHF Adj: PHF Volume: Reduct Vol: Reduced Vol: PCE Adj: MLF Adj: FinalVolume: Saturation Flow Module: Sat/Lane: Adjustment: Lanes: Final Sat.: Capacity Analysis Module: Vol/Sat: Crit Moves: **** **** **** **** Near AM Mon Feb 28, :23:52 Page 8-1 Near Term AM Without Project Level Of Service Computation Report 2000 HCM Unsignalized Method (Future Volume Alternative) Intersection #6 Wright St (N/S) / Avalon Ave (E/W) Average Delay (sec/veh): 0.6 Worst Case Level Of Service: A[ 9.8] Approach: North Bound South Bound East Bound West Bound Movement: L - T - R L - T - R L - T - R L - T - R Control: Uncontrolled Uncontrolled Stop Sign Stop Sign Rights: Include Include Include Include Lanes: ! 0 0 Volume Module: Base Vol: Growth Adj: Initial Bse: Added Vol: PasserByVol: Initial Fut: User Adj: PHF Adj: PHF Volume: Reduct Vol: FinalVolume: Critical Gap Module: Critical Gp:xxxxx xxxx xxxxx 4.1 xxxx xxxxx xxxxx xxxx xxxxx FollowUpTim:xxxxx xxxx xxxxx 2.2 xxxx xxxxx xxxxx xxxx xxxxx Capacity Module: Cnflict Vol: xxxx xxxx xxxxx 187 xxxx xxxxx xxxx xxxx xxxxx Potent Cap.: xxxx xxxx xxxxx 1399 xxxx xxxxx xxxx xxxx xxxxx Move Cap.: xxxx xxxx xxxxx 1399 xxxx xxxxx xxxx xxxx xxxxx Volume/Cap: xxxx xxxx xxxx 0.00 xxxx xxxx xxxx xxxx xxxx Level Of Service Module: 2Way95thQ: xxxx xxxx xxxxx 0.0 xxxx xxxxx xxxx xxxx xxxxx xxxx xxxx xxxxx Control Del:xxxxx xxxx xxxxx 7.6 xxxx xxxxx xxxxx xxxx xxxxx xxxxx xxxx xxxxx LOS by Move: * * * A * * * * * * * * Movement: LT - LTR - RT LT - LTR - RT LT - LTR - RT LT - LTR - RT Shared Cap.: xxxx xxxx xxxxx xxxx xxxx xxxxx xxxx xxxx xxxxx xxxx 774 xxxxx SharedQueue:xxxxx xxxx xxxxx 0.0 xxxx xxxxx xxxxx xxxx xxxxx xxxxx 0.1 xxxxx Shrd ConDel:xxxxx xxxx xxxxx 7.6 xxxx xxxxx xxxxx xxxx xxxxx xxxxx 9.8 xxxxx Shared LOS: * * * A * * * * * * A * ApproachDel: xxxxxx xxxxxx xxxxxx 9.8 ApproachLOS: * * * A Note: Queue reported is the number of cars per lane. Traffix (c) 2008 Dowling Assoc. Licensed to KOA CORP, MONTEREY PK Traffix (c) 2008 Dowling Assoc. Licensed to KOA CORP, MONTEREY PK
108 Near PM Mon Feb 28, :24:40 Page 1-1 Near Term PM Without Project Scenario Report Scenario: Near PM Command: Near Term PM Volume: Near Term PM Geometry: Existing Impact Fee: Default Impact Fee Trip Generation: PM Trip Distribution: Project Paths: Default Path Routes: Default Route Configuration: Default Configuration Near PM Mon Feb 28, :24:40 Page 2-1 Near Term PM Without Project Trip Generation Report Forecast for PM Zone Rate Rate Trips Trips Total % Of # Subzone Amount Units In Out In Out Trips Total Town and Cou 1.00 condo/townhous Zone 7 Subtotal Olen Propert 1.00 project Zone 8 Subtotal Renaissance 1.00 project Zone 12 Subtotal Town and Cou 1.00 Medical-dental Zone 13 Subtotal CHOC 1.00 Hospital Zone 14 Subtotal Alliance Chu 1.00 project Zone 15 Subtotal TOTAL Traffix (c) 2008 Dowling Assoc. Licensed to KOA CORP, MONTEREY PK Traffix (c) 2008 Dowling Assoc. Licensed to KOA CORP, MONTEREY PK
109 Near PM Mon Feb 28, :24:41 Page 3-1 Near Term PM Without Project Impact Analysis Report Level Of Service Intersection Base Future Change Del/ V/ Del/ V/ in LOS Veh C LOS Veh C # 1 Grand Av (N/S) / Santa Clara A B xxxxx B xxxxx V/C # 2 Wright St (N/S) / Santa Clara D D D/V # 4 Lyon St (N/S) / Santa Clara Av B B D/V # 5 Tustin Ave (N/S) / Santa Clara A xxxxx A xxxxx V/C # 6 Wright St (N/S) / Avalon Ave ( A A D/V Near PM Mon Feb 28, :24:41 Page 4-1 Near Term PM Without Project Level Of Service Computation Report ICU 1(Loss as Cycle Length %) Method (Future Volume Alternative) Intersection #1 Grand Av (N/S) / Santa Clara Ave (E/W) Cycle (sec): 100 Critical Vol./Cap.(X): Loss Time (sec): 5 Average Delay (sec/veh): xxxxxx Optimal Cycle: 35 Level Of Service: B Approach: North Bound South Bound East Bound West Bound Movement: L - T - R L - T - R L - T - R L - T - R Control: Protected Protected Permitted Permitted Rights: Include Include Include Include Min. Green: Y+R: Lanes: Volume Module: Base Vol: Growth Adj: Initial Bse: Added Vol: PasserByVol: Initial Fut: User Adj: PHF Adj: PHF Volume: Reduct Vol: Reduced Vol: PCE Adj: MLF Adj: FinalVolume: Saturation Flow Module: Sat/Lane: Adjustment: Lanes: Final Sat.: Capacity Analysis Module: Vol/Sat: Crit Moves: **** **** **** **** Traffix (c) 2008 Dowling Assoc. Licensed to KOA CORP, MONTEREY PK Traffix (c) 2008 Dowling Assoc. Licensed to KOA CORP, MONTEREY PK
110 Near PM Mon Feb 28, :24:41 Page 5-1 Near Term PM Without Project Level Of Service Computation Report 2000 HCM Unsignalized Method (Future Volume Alternative) Intersection #2 Wright St (N/S) / Santa Clara Ave (E/W) Average Delay (sec/veh): 5.5 Worst Case Level Of Service: D[ 33.5] Approach: North Bound South Bound East Bound West Bound Movement: L - T - R L - T - R L - T - R L - T - R Control: Stop Sign Stop Sign Uncontrolled Uncontrolled Rights: Include Include Include Include Lanes: 0 0 1! ! ! ! 0 0 Volume Module: Base Vol: Growth Adj: Initial Bse: Added Vol: PasserByVol: Initial Fut: User Adj: PHF Adj: PHF Volume: Reduct Vol: FinalVolume: Critical Gap Module: Critical Gp: xxxx xxxxx 4.1 xxxx xxxxx FollowUpTim: xxxx xxxxx 2.2 xxxx xxxxx Capacity Module: Cnflict Vol: xxxx xxxxx 534 xxxx xxxxx Potent Cap.: xxxx xxxxx 1044 xxxx xxxxx Move Cap.: xxxx xxxxx 1044 xxxx xxxxx Volume/Cap: xxxx xxxx 0.03 xxxx xxxx Level Of Service Module: 2Way95thQ: xxxx xxxx xxxxx xxxx xxxx xxxxx 0.0 xxxx xxxxx 0.1 xxxx xxxxx Control Del:xxxxx xxxx xxxxx xxxxx xxxx xxxxx 7.9 xxxx xxxxx 8.6 xxxx xxxxx LOS by Move: * * * * * * A * * A * * Movement: LT - LTR - RT LT - LTR - RT LT - LTR - RT LT - LTR - RT Shared Cap.: xxxx 280 xxxxx xxxx 597 xxxxx xxxx xxxx xxxxx xxxx xxxx xxxxx SharedQueue:xxxxx 3.3 xxxxx xxxxx 0.1 xxxxx xxxxx xxxx xxxxx xxxxx xxxx xxxxx Shrd ConDel:xxxxx 33.5 xxxxx xxxxx 11.1 xxxxx xxxxx xxxx xxxxx xxxxx xxxx xxxxx Shared LOS: * D * * B * * * * * * * ApproachDel: xxxxxx xxxxxx ApproachLOS: D B * * Note: Queue reported is the number of cars per lane. Near PM Mon Feb 28, :24:41 Page 6-1 Near Term PM Without Project Level Of Service Computation Report 2000 HCM Unsignalized Method (Future Volume Alternative) Intersection #4 Lyon St (N/S) / Santa Clara Ave (E/W) Average Delay (sec/veh): 0.3 Worst Case Level Of Service: B[ 14.1] Approach: North Bound South Bound East Bound West Bound Movement: L - T - R L - T - R L - T - R L - T - R Control: Stop Sign Stop Sign Uncontrolled Uncontrolled Rights: Include Include Include Include Lanes: ! Volume Module: Base Vol: Growth Adj: Initial Bse: Added Vol: PasserByVol: Initial Fut: User Adj: PHF Adj: PHF Volume: Reduct Vol: FinalVolume: Critical Gap Module: Critical Gp:xxxxx xxxx xxxxx xxxxx xxxx xxxxx xxxxx xxxx xxxxx FollowUpTim:xxxxx xxxx xxxxx xxxxx xxxx xxxxx xxxxx xxxx xxxxx Capacity Module: Cnflict Vol: xxxx xxxx xxxxx xxxx xxxx xxxxx xxxx xxxx xxxxx Potent Cap.: xxxx xxxx xxxxx xxxx xxxx xxxxx xxxx xxxx xxxxx Move Cap.: xxxx xxxx xxxxx xxxx xxxx xxxxx xxxx xxxx xxxxx Volume/Cap: xxxx xxxx xxxx xxxx xxxx xxxx xxxx xxxx xxxx Level Of Service Module: 2Way95thQ: xxxx xxxx xxxxx xxxx xxxx xxxxx xxxx xxxx xxxxx xxxx xxxx xxxxx Control Del:xxxxx xxxx xxxxx xxxxx xxxx xxxxx xxxxx xxxx xxxxx xxxxx xxxx xxxxx LOS by Move: * * * * * * * * * * * * Movement: LT - LTR - RT LT - LTR - RT LT - LTR - RT LT - LTR - RT Shared Cap.: xxxx xxxx xxxxx xxxx 415 xxxxx xxxx xxxx xxxxx xxxx xxxx xxxxx SharedQueue:xxxxx xxxx xxxxx xxxxx 0.1 xxxxx xxxxx xxxx xxxxx xxxxx xxxx xxxxx Shrd ConDel:xxxxx xxxx xxxxx xxxxx 14.1 xxxxx xxxxx xxxx xxxxx xxxxx xxxx xxxxx Shared LOS: * * * * B * * * * * * * ApproachDel: xxxxxx 14.1 xxxxxx xxxxxx ApproachLOS: * B * * Note: Queue reported is the number of cars per lane. Traffix (c) 2008 Dowling Assoc. Licensed to KOA CORP, MONTEREY PK Traffix (c) 2008 Dowling Assoc. Licensed to KOA CORP, MONTEREY PK
111 Near PM Mon Feb 28, :24:41 Page 7-1 Near Term PM Without Project Level Of Service Computation Report ICU 1(Loss as Cycle Length %) Method (Future Volume Alternative) Intersection #5 Tustin Ave (N/S) / Santa Clara Ave (E/W) Cycle (sec): 100 Critical Vol./Cap.(X): Loss Time (sec): 5 Average Delay (sec/veh): xxxxxx Optimal Cycle: 28 Level Of Service: A Approach: North Bound South Bound East Bound West Bound Movement: L - T - R L - T - R L - T - R L - T - R Control: Protected Protected Permitted Permitted Rights: Include Include Include Include Min. Green: Y+R: Lanes: Volume Module: Base Vol: Growth Adj: Initial Bse: Added Vol: PasserByVol: Initial Fut: User Adj: PHF Adj: PHF Volume: Reduct Vol: Reduced Vol: PCE Adj: MLF Adj: FinalVolume: Saturation Flow Module: Sat/Lane: Adjustment: Lanes: Final Sat.: Capacity Analysis Module: Vol/Sat: Crit Moves: **** **** **** **** Near PM Mon Feb 28, :24:41 Page 8-1 Near Term PM Without Project Level Of Service Computation Report 2000 HCM Unsignalized Method (Future Volume Alternative) Intersection #6 Wright St (N/S) / Avalon Ave (E/W) Average Delay (sec/veh): 1.0 Worst Case Level Of Service: A[ 9.6] Approach: North Bound South Bound East Bound West Bound Movement: L - T - R L - T - R L - T - R L - T - R Control: Uncontrolled Uncontrolled Stop Sign Stop Sign Rights: Include Include Include Include Lanes: ! 0 0 Volume Module: Base Vol: Growth Adj: Initial Bse: Added Vol: PasserByVol: Initial Fut: User Adj: PHF Adj: PHF Volume: Reduct Vol: FinalVolume: Critical Gap Module: Critical Gp:xxxxx xxxx xxxxx 4.1 xxxx xxxxx xxxxx xxxx xxxxx FollowUpTim:xxxxx xxxx xxxxx 2.2 xxxx xxxxx xxxxx xxxx xxxxx Capacity Module: Cnflict Vol: xxxx xxxx xxxxx 184 xxxx xxxxx xxxx xxxx xxxxx Potent Cap.: xxxx xxxx xxxxx 1403 xxxx xxxxx xxxx xxxx xxxxx Move Cap.: xxxx xxxx xxxxx 1403 xxxx xxxxx xxxx xxxx xxxxx Volume/Cap: xxxx xxxx xxxx 0.02 xxxx xxxx xxxx xxxx xxxx Level Of Service Module: 2Way95thQ: xxxx xxxx xxxxx 0.1 xxxx xxxxx xxxx xxxx xxxxx xxxx xxxx xxxxx Control Del:xxxxx xxxx xxxxx 7.6 xxxx xxxxx xxxxx xxxx xxxxx xxxxx xxxx xxxxx LOS by Move: * * * A * * * * * * * * Movement: LT - LTR - RT LT - LTR - RT LT - LTR - RT LT - LTR - RT Shared Cap.: xxxx xxxx xxxxx xxxx xxxx xxxxx xxxx xxxx xxxxx xxxx 805 xxxxx SharedQueue:xxxxx xxxx xxxxx 0.1 xxxx xxxxx xxxxx xxxx xxxxx xxxxx 0.1 xxxxx Shrd ConDel:xxxxx xxxx xxxxx 7.6 xxxx xxxxx xxxxx xxxx xxxxx xxxxx 9.6 xxxxx Shared LOS: * * * A * * * * * * A * ApproachDel: xxxxxx xxxxxx xxxxxx 9.6 ApproachLOS: * * * A Note: Queue reported is the number of cars per lane. Traffix (c) 2008 Dowling Assoc. Licensed to KOA CORP, MONTEREY PK Traffix (c) 2008 Dowling Assoc. Licensed to KOA CORP, MONTEREY PK
112 Build Out AM Mon Feb 28, :28:06 Page 1-1 Build Out Without Project AM Scenario Report Scenario: Build Out AM Command: Build Out AM Volume: Build Out AM Geometry: Existing Impact Fee: Default Impact Fee Trip Generation: AM Trip Distribution: Project Paths: Default Path Routes: Default Route Configuration: Default Configuration Build Out AM Mon Feb 28, :28:06 Page 2-1 Build Out Without Project AM Impact Analysis Report Level Of Service Intersection Base Future Change Del/ V/ Del/ V/ in LOS Veh C LOS Veh C # 1 Grand Av (N/S) / Santa Clara A E xxxxx E xxxxx V/C # 2 Wright St (N/S) / Santa Clara C C D/V # 4 Lyon St (N/S) / Santa Clara Av B B D/V # 5 Tustin Ave (N/S) / Santa Clara D xxxxx D xxxxx V/C # 6 Wright St (N/S) / Avalon Ave ( B B D/V Traffix (c) 2008 Dowling Assoc. Licensed to KOA CORP, MONTEREY PK Traffix (c) 2008 Dowling Assoc. Licensed to KOA CORP, MONTEREY PK
113 Build Out AM Mon Feb 28, :28:06 Page 3-1 Build Out Without Project AM Level Of Service Computation Report ICU 1(Loss as Cycle Length %) Method (Future Volume Alternative) Intersection #1 Grand Av (N/S) / Santa Clara Ave (E/W) Cycle (sec): 100 Critical Vol./Cap.(X): Loss Time (sec): 5 Average Delay (sec/veh): xxxxxx Optimal Cycle: 180 Level Of Service: E Approach: North Bound South Bound East Bound West Bound Movement: L - T - R L - T - R L - T - R L - T - R Control: Protected Protected Permitted Permitted Rights: Include Include Include Include Min. Green: Y+R: Lanes: Volume Module: Base Vol: Growth Adj: Initial Bse: Added Vol: PasserByVol: Initial Fut: User Adj: PHF Adj: PHF Volume: Reduct Vol: Reduced Vol: PCE Adj: MLF Adj: FinalVolume: Saturation Flow Module: Sat/Lane: Adjustment: Lanes: Final Sat.: Capacity Analysis Module: Vol/Sat: Crit Moves: **** **** **** **** Build Out AM Mon Feb 28, :28:06 Page 4-1 Build Out Without Project AM Level Of Service Computation Report 2000 HCM Unsignalized Method (Future Volume Alternative) Intersection #2 Wright St (N/S) / Santa Clara Ave (E/W) Average Delay (sec/veh): 3.1 Worst Case Level Of Service: C[ 17.9] Approach: North Bound South Bound East Bound West Bound Movement: L - T - R L - T - R L - T - R L - T - R Control: Stop Sign Stop Sign Uncontrolled Uncontrolled Rights: Include Include Include Include Lanes: 0 0 1! ! ! Volume Module: Base Vol: Growth Adj: Initial Bse: Added Vol: PasserByVol: Initial Fut: User Adj: PHF Adj: PHF Volume: Reduct Vol: FinalVolume: Critical Gap Module: Critical Gp: xxxx xxxxx 4.1 xxxx xxxxx FollowUpTim: xxxx xxxxx 2.2 xxxx xxxxx Capacity Module: Cnflict Vol: xxxx xxxxx 374 xxxx xxxxx Potent Cap.: xxxx xxxxx 1195 xxxx xxxxx Move Cap.: xxxx xxxxx 1195 xxxx xxxxx Volume/Cap: xxxx xxxx 0.04 xxxx xxxx Level Of Service Module: 2Way95thQ: xxxx xxxx xxxxx xxxx xxxx xxxxx 0.0 xxxx xxxxx 0.1 xxxx xxxxx Control Del:xxxxx xxxx xxxxx xxxxx xxxx xxxxx 8.0 xxxx xxxxx 8.1 xxxx xxxxx LOS by Move: * * * * * * A * * A * * Movement: LT - LTR - RT LT - LTR - RT LT - LTR - RT LT - LTR - RT Shared Cap.: xxxx 387 xxxxx xxxx 517 xxxxx xxxx xxxx xxxxx xxxx xxxx xxxxx SharedQueue:xxxxx 1.1 xxxxx xxxxx 0.2 xxxxx xxxxx xxxx xxxxx 0.1 xxxx xxxxx Shrd ConDel:xxxxx 17.9 xxxxx xxxxx 12.5 xxxxx xxxxx xxxx xxxxx 8.1 xxxx xxxxx Shared LOS: * C * * B * * * * A * * ApproachDel: xxxxxx xxxxxx ApproachLOS: C B * * Note: Queue reported is the number of cars per lane. Traffix (c) 2008 Dowling Assoc. Licensed to KOA CORP, MONTEREY PK Traffix (c) 2008 Dowling Assoc. Licensed to KOA CORP, MONTEREY PK
114 Build Out AM Mon Feb 28, :28:06 Page 5-1 Build Out Without Project AM Level Of Service Computation Report 2000 HCM Unsignalized Method (Future Volume Alternative) Intersection #4 Lyon St (N/S) / Santa Clara Ave (E/W) Average Delay (sec/veh): 0.4 Worst Case Level Of Service: B[ 12.4] Approach: North Bound South Bound East Bound West Bound Movement: L - T - R L - T - R L - T - R L - T - R Control: Stop Sign Stop Sign Uncontrolled Uncontrolled Rights: Include Include Include Include Lanes: ! Volume Module: Base Vol: Growth Adj: Initial Bse: Added Vol: PasserByVol: Initial Fut: User Adj: PHF Adj: PHF Volume: Reduct Vol: FinalVolume: Critical Gap Module: Critical Gp:xxxxx xxxx xxxxx xxxx xxxxx xxxxx xxxx xxxxx FollowUpTim:xxxxx xxxx xxxxx xxxx xxxxx xxxxx xxxx xxxxx Capacity Module: Cnflict Vol: xxxx xxxx xxxxx xxxx xxxxx xxxx xxxx xxxxx Potent Cap.: xxxx xxxx xxxxx xxxx xxxxx xxxx xxxx xxxxx Move Cap.: xxxx xxxx xxxxx xxxx xxxxx xxxx xxxx xxxxx Volume/Cap: xxxx xxxx xxxx xxxx xxxx xxxx xxxx xxxx Level Of Service Module: 2Way95thQ: xxxx xxxx xxxxx xxxx xxxx xxxxx 0.0 xxxx xxxxx xxxx xxxx xxxxx Control Del:xxxxx xxxx xxxxx xxxxx xxxx xxxxx 8.0 xxxx xxxxx xxxxx xxxx xxxxx LOS by Move: * * * * * * A * * * * * Movement: LT - LTR - RT LT - LTR - RT LT - LTR - RT LT - LTR - RT Shared Cap.: xxxx xxxx xxxxx xxxx 504 xxxxx xxxx xxxx xxxxx xxxx xxxx xxxxx SharedQueue:xxxxx xxxx xxxxx xxxxx 0.1 xxxxx 0.0 xxxx xxxxx xxxxx xxxx xxxxx Shrd ConDel:xxxxx xxxx xxxxx xxxxx 12.4 xxxxx 8.0 xxxx xxxxx xxxxx xxxx xxxxx Shared LOS: * * * * B * A * * * * * ApproachDel: xxxxxx 12.4 xxxxxx xxxxxx ApproachLOS: * B * * Note: Queue reported is the number of cars per lane. Build Out AM Mon Feb 28, :28:06 Page 6-1 Build Out Without Project AM Level Of Service Computation Report ICU 1(Loss as Cycle Length %) Method (Future Volume Alternative) Intersection #5 Tustin Ave (N/S) / Santa Clara Ave (E/W) Cycle (sec): 100 Critical Vol./Cap.(X): Loss Time (sec): 5 Average Delay (sec/veh): xxxxxx Optimal Cycle: 64 Level Of Service: D Approach: North Bound South Bound East Bound West Bound Movement: L - T - R L - T - R L - T - R L - T - R Control: Protected Protected Permitted Permitted Rights: Include Include Include Include Min. Green: Y+R: Lanes: Volume Module: Base Vol: Growth Adj: Initial Bse: Added Vol: PasserByVol: Initial Fut: User Adj: PHF Adj: PHF Volume: Reduct Vol: Reduced Vol: PCE Adj: MLF Adj: FinalVolume: Saturation Flow Module: Sat/Lane: Adjustment: Lanes: Final Sat.: Capacity Analysis Module: Vol/Sat: Crit Moves: **** **** **** **** Traffix (c) 2008 Dowling Assoc. Licensed to KOA CORP, MONTEREY PK Traffix (c) 2008 Dowling Assoc. Licensed to KOA CORP, MONTEREY PK
115 Build Out AM Mon Feb 28, :28:06 Page 7-1 Build Out Without Project AM Level Of Service Computation Report 2000 HCM Unsignalized Method (Future Volume Alternative) Intersection #6 Wright St (N/S) / Avalon Ave (E/W) Average Delay (sec/veh): 0.5 Worst Case Level Of Service: B[ 10.3] Approach: North Bound South Bound East Bound West Bound Movement: L - T - R L - T - R L - T - R L - T - R Control: Uncontrolled Uncontrolled Stop Sign Stop Sign Rights: Include Include Include Include Lanes: ! 0 0 Volume Module: Base Vol: Growth Adj: Initial Bse: Added Vol: PasserByVol: Initial Fut: User Adj: PHF Adj: PHF Volume: Reduct Vol: FinalVolume: Critical Gap Module: Critical Gp:xxxxx xxxx xxxxx 4.1 xxxx xxxxx xxxxx xxxx xxxxx FollowUpTim:xxxxx xxxx xxxxx 2.2 xxxx xxxxx xxxxx xxxx xxxxx Capacity Module: Cnflict Vol: xxxx xxxx xxxxx 232 xxxx xxxxx xxxx xxxx xxxxx Potent Cap.: xxxx xxxx xxxxx 1348 xxxx xxxxx xxxx xxxx xxxxx Move Cap.: xxxx xxxx xxxxx 1348 xxxx xxxxx xxxx xxxx xxxxx Volume/Cap: xxxx xxxx xxxx 0.00 xxxx xxxx xxxx xxxx xxxx Level Of Service Module: 2Way95thQ: xxxx xxxx xxxxx 0.0 xxxx xxxxx xxxx xxxx xxxxx xxxx xxxx xxxxx Control Del:xxxxx xxxx xxxxx 7.7 xxxx xxxxx xxxxx xxxx xxxxx xxxxx xxxx xxxxx LOS by Move: * * * A * * * * * * * * Movement: LT - LTR - RT LT - LTR - RT LT - LTR - RT LT - LTR - RT Shared Cap.: xxxx xxxx xxxxx xxxx xxxx xxxxx xxxx xxxx xxxxx xxxx 715 xxxxx SharedQueue:xxxxx xxxx xxxxx 0.0 xxxx xxxxx xxxxx xxxx xxxxx xxxxx 0.1 xxxxx Shrd ConDel:xxxxx xxxx xxxxx 7.7 xxxx xxxxx xxxxx xxxx xxxxx xxxxx 10.3 xxxxx Shared LOS: * * * A * * * * * * B * ApproachDel: xxxxxx xxxxxx xxxxxx 10.3 ApproachLOS: * * * B Note: Queue reported is the number of cars per lane. Traffix (c) 2008 Dowling Assoc. Licensed to KOA CORP, MONTEREY PK
116 Near AM Mon Feb 28, :25:48 Page 1-1 Near Term AM With Project Scenario Report Scenario: Near AM Command: Near Term AM Volume: Near Term AM Geometry: Existing Impact Fee: Default Impact Fee Trip Generation: AM Trip Distribution: Project Paths: Default Path Routes: Default Route Configuration: Default Configuration Near AM Mon Feb 28, :25:48 Page 2-1 Near Term AM With Project Trip Generation Report Forecast for AM Zone Rate Rate Trips Trips Total % Of # Subzone Amount Units In Out In Out Trips Total Empire Homes 1.00 Empire Homes Zone 1 Subtotal Town and Cou 1.00 condo/townhous Zone 7 Subtotal Olen Propert 1.00 project Zone 8 Subtotal Renaissance 1.00 project Zone 12 Subtotal Town and Cou 1.00 Medical-dental Zone 13 Subtotal CHOC 1.00 Hospital Zone 14 Subtotal Alliance Chu 1.00 project Zone 15 Subtotal Empire Homes 1.00 Empire Homes Zone 16 Subtotal TOTAL Traffix (c) 2008 Dowling Assoc. Licensed to KOA CORP, MONTEREY PK Traffix (c) 2008 Dowling Assoc. Licensed to KOA CORP, MONTEREY PK
117 Near AM Mon Feb 28, :25:49 Page 3-1 Near Term AM With Project Impact Analysis Report Level Of Service Intersection Base Future Change Del/ V/ Del/ V/ in LOS Veh C LOS Veh C # 1 Grand Av (N/S) / Santa Clara A C xxxxx C xxxxx V/C # 2 Wright St (N/S) / Santa Clara B B D/V # 3 Project Driveway (N/S) / Santa A B D/V # 4 Lyon St (N/S) / Santa Clara Av B B D/V # 5 Tustin Ave (N/S) / Santa Clara B xxxxx B xxxxx V/C # 6 Wright St (N/S) / Avalon Ave ( A A D/V Near AM Mon Feb 28, :25:49 Page 4-1 Near Term AM With Project Level Of Service Computation Report ICU 1(Loss as Cycle Length %) Method (Future Volume Alternative) Intersection #1 Grand Av (N/S) / Santa Clara Ave (E/W) Cycle (sec): 100 Critical Vol./Cap.(X): Loss Time (sec): 5 Average Delay (sec/veh): xxxxxx Optimal Cycle: 46 Level Of Service: C Approach: North Bound South Bound East Bound West Bound Movement: L - T - R L - T - R L - T - R L - T - R Control: Protected Protected Permitted Permitted Rights: Include Include Include Include Min. Green: Y+R: Lanes: Volume Module: Base Vol: Growth Adj: Initial Bse: Added Vol: PasserByVol: Initial Fut: User Adj: PHF Adj: PHF Volume: Reduct Vol: Reduced Vol: PCE Adj: MLF Adj: FinalVolume: Saturation Flow Module: Sat/Lane: Adjustment: Lanes: Final Sat.: Capacity Analysis Module: Vol/Sat: Crit Moves: **** **** **** **** Traffix (c) 2008 Dowling Assoc. Licensed to KOA CORP, MONTEREY PK Traffix (c) 2008 Dowling Assoc. Licensed to KOA CORP, MONTEREY PK
118 Near AM Mon Feb 28, :25:49 Page 5-1 Near Term AM With Project Level Of Service Computation Report 2000 HCM Unsignalized Method (Future Volume Alternative) Intersection #2 Wright St (N/S) / Santa Clara Ave (E/W) Average Delay (sec/veh): 2.6 Worst Case Level Of Service: B[ 14.5] Approach: North Bound South Bound East Bound West Bound Movement: L - T - R L - T - R L - T - R L - T - R Control: Stop Sign Stop Sign Uncontrolled Uncontrolled Rights: Include Include Include Include Lanes: 0 0 1! ! ! Volume Module: Base Vol: Growth Adj: Initial Bse: Added Vol: PasserByVol: Initial Fut: User Adj: PHF Adj: PHF Volume: Reduct Vol: FinalVolume: Critical Gap Module: Critical Gp: xxxx xxxxx 4.1 xxxx xxxxx FollowUpTim: xxxx xxxxx 2.2 xxxx xxxxx Capacity Module: Cnflict Vol: xxxx xxxxx 310 xxxx xxxxx Potent Cap.: xxxx xxxxx 1262 xxxx xxxxx Move Cap.: xxxx xxxxx 1262 xxxx xxxxx Volume/Cap: xxxx xxxx 0.03 xxxx xxxx Level Of Service Module: 2Way95thQ: xxxx xxxx xxxxx xxxx xxxx xxxxx 0.0 xxxx xxxxx 0.1 xxxx xxxxx Control Del:xxxxx xxxx xxxxx xxxxx xxxx xxxxx 7.8 xxxx xxxxx 7.9 xxxx xxxxx LOS by Move: * * * * * * A * * A * * Movement: LT - LTR - RT LT - LTR - RT LT - LTR - RT LT - LTR - RT Shared Cap.: xxxx 469 xxxxx xxxx 585 xxxxx xxxx xxxx xxxxx xxxx xxxx xxxxx SharedQueue:xxxxx 0.7 xxxxx xxxxx 0.2 xxxxx xxxxx xxxx xxxxx 0.1 xxxx xxxxx Shrd ConDel:xxxxx 14.5 xxxxx xxxxx 11.5 xxxxx xxxxx xxxx xxxxx 7.9 xxxx xxxxx Shared LOS: * B * * B * * * * A * * ApproachDel: xxxxxx xxxxxx ApproachLOS: B B * * Note: Queue reported is the number of cars per lane. Near AM Mon Feb 28, :25:49 Page 6-1 Near Term AM With Project Level Of Service Computation Report 2000 HCM Unsignalized Method (Future Volume Alternative) Intersection #3 Project Driveway (N/S) / Santa Clara Ave (E/W) Average Delay (sec/veh): 0.2 Worst Case Level Of Service: B[ 10.9] Approach: North Bound South Bound East Bound West Bound Movement: L - T - R L - T - R L - T - R L - T - R Control: Stop Sign Stop Sign Uncontrolled Uncontrolled Rights: Include Include Include Include Lanes: 0 0 1! Volume Module: Base Vol: Growth Adj: Initial Bse: Added Vol: PasserByVol: Initial Fut: User Adj: PHF Adj: PHF Volume: Reduct Vol: FinalVolume: Critical Gap Module: Critical Gp: xxxxx xxxx xxxxx xxxxx xxxx xxxxx 4.1 xxxx xxxxx FollowUpTim: xxxxx xxxx xxxxx xxxxx xxxx xxxxx 2.2 xxxx xxxxx Capacity Module: Cnflict Vol: xxxx xxxx xxxxx xxxx xxxx xxxxx 297 xxxx xxxxx Potent Cap.: xxxx xxxx xxxxx xxxx xxxx xxxxx 1276 xxxx xxxxx Move Cap.: xxxx xxxx xxxxx xxxx xxxx xxxxx 1276 xxxx xxxxx Volume/Cap: xxxx xxxx xxxx xxxx xxxx xxxx 0.00 xxxx xxxx Level Of Service Module: 2Way95thQ: xxxx xxxx xxxxx xxxx xxxx xxxxx xxxx xxxx xxxxx 0.0 xxxx xxxxx Control Del:xxxxx xxxx xxxxx xxxxx xxxx xxxxx xxxxx xxxx xxxxx 7.8 xxxx xxxxx LOS by Move: * * * * * * * * * A * * Movement: LT - LTR - RT LT - LTR - RT LT - LTR - RT LT - LTR - RT Shared Cap.: xxxx 625 xxxxx xxxx xxxx xxxxx xxxx xxxx xxxxx xxxx xxxx xxxxx SharedQueue:xxxxx 0.1 xxxxx xxxxx xxxx xxxxx xxxxx xxxx xxxxx 0.0 xxxx xxxxx Shrd ConDel:xxxxx 10.9 xxxxx xxxxx xxxx xxxxx xxxxx xxxx xxxxx 7.8 xxxx xxxxx Shared LOS: * B * * * * * * * A * * ApproachDel: 10.9 xxxxxx xxxxxx xxxxxx ApproachLOS: B * * * Note: Queue reported is the number of cars per lane. Traffix (c) 2008 Dowling Assoc. Licensed to KOA CORP, MONTEREY PK Traffix (c) 2008 Dowling Assoc. Licensed to KOA CORP, MONTEREY PK
119 Near AM Mon Feb 28, :25:49 Page 7-1 Near Term AM With Project Level Of Service Computation Report 2000 HCM Unsignalized Method (Future Volume Alternative) Intersection #4 Lyon St (N/S) / Santa Clara Ave (E/W) Average Delay (sec/veh): 0.4 Worst Case Level Of Service: B[ 11.8] Approach: North Bound South Bound East Bound West Bound Movement: L - T - R L - T - R L - T - R L - T - R Control: Stop Sign Stop Sign Uncontrolled Uncontrolled Rights: Include Include Include Include Lanes: ! Volume Module: Base Vol: Growth Adj: Initial Bse: Added Vol: PasserByVol: Initial Fut: User Adj: PHF Adj: PHF Volume: Reduct Vol: FinalVolume: Critical Gap Module: Critical Gp:xxxxx xxxx xxxxx xxxx xxxxx xxxxx xxxx xxxxx FollowUpTim:xxxxx xxxx xxxxx xxxx xxxxx xxxxx xxxx xxxxx Capacity Module: Cnflict Vol: xxxx xxxx xxxxx xxxx xxxxx xxxx xxxx xxxxx Potent Cap.: xxxx xxxx xxxxx xxxx xxxxx xxxx xxxx xxxxx Move Cap.: xxxx xxxx xxxxx xxxx xxxxx xxxx xxxx xxxxx Volume/Cap: xxxx xxxx xxxx xxxx xxxx xxxx xxxx xxxx Level Of Service Module: 2Way95thQ: xxxx xxxx xxxxx xxxx xxxx xxxxx 0.0 xxxx xxxxx xxxx xxxx xxxxx Control Del:xxxxx xxxx xxxxx xxxxx xxxx xxxxx 7.9 xxxx xxxxx xxxxx xxxx xxxxx LOS by Move: * * * * * * A * * * * * Movement: LT - LTR - RT LT - LTR - RT LT - LTR - RT LT - LTR - RT Shared Cap.: xxxx xxxx xxxxx xxxx 550 xxxxx xxxx xxxx xxxxx xxxx xxxx xxxxx SharedQueue:xxxxx xxxx xxxxx xxxxx 0.1 xxxxx 0.0 xxxx xxxxx xxxxx xxxx xxxxx Shrd ConDel:xxxxx xxxx xxxxx xxxxx 11.8 xxxxx 7.9 xxxx xxxxx xxxxx xxxx xxxxx Shared LOS: * * * * B * A * * * * * ApproachDel: xxxxxx 11.8 xxxxxx xxxxxx ApproachLOS: * B * * Note: Queue reported is the number of cars per lane. Near AM Mon Feb 28, :25:49 Page 8-1 Near Term AM With Project Level Of Service Computation Report ICU 1(Loss as Cycle Length %) Method (Future Volume Alternative) Intersection #5 Tustin Ave (N/S) / Santa Clara Ave (E/W) Cycle (sec): 100 Critical Vol./Cap.(X): Loss Time (sec): 5 Average Delay (sec/veh): xxxxxx Optimal Cycle: 37 Level Of Service: B Approach: North Bound South Bound East Bound West Bound Movement: L - T - R L - T - R L - T - R L - T - R Control: Protected Protected Permitted Permitted Rights: Include Include Include Include Min. Green: Y+R: Lanes: Volume Module: Base Vol: Growth Adj: Initial Bse: Added Vol: PasserByVol: Initial Fut: User Adj: PHF Adj: PHF Volume: Reduct Vol: Reduced Vol: PCE Adj: MLF Adj: FinalVolume: Saturation Flow Module: Sat/Lane: Adjustment: Lanes: Final Sat.: Capacity Analysis Module: Vol/Sat: Crit Moves: **** **** **** **** Traffix (c) 2008 Dowling Assoc. Licensed to KOA CORP, MONTEREY PK Traffix (c) 2008 Dowling Assoc. Licensed to KOA CORP, MONTEREY PK
120 Near AM Mon Feb 28, :25:49 Page 9-1 Near Term AM With Project Level Of Service Computation Report 2000 HCM Unsignalized Method (Future Volume Alternative) Intersection #6 Wright St (N/S) / Avalon Ave (E/W) Average Delay (sec/veh): 0.7 Worst Case Level Of Service: A[ 10.0] Approach: North Bound South Bound East Bound West Bound Movement: L - T - R L - T - R L - T - R L - T - R Control: Uncontrolled Uncontrolled Stop Sign Stop Sign Rights: Include Include Include Include Lanes: ! 0 0 Volume Module: Base Vol: Growth Adj: Initial Bse: Added Vol: PasserByVol: Initial Fut: User Adj: PHF Adj: PHF Volume: Reduct Vol: FinalVolume: Critical Gap Module: Critical Gp:xxxxx xxxx xxxxx 4.1 xxxx xxxxx xxxxx xxxx xxxxx FollowUpTim:xxxxx xxxx xxxxx 2.2 xxxx xxxxx xxxxx xxxx xxxxx Capacity Module: Cnflict Vol: xxxx xxxx xxxxx 188 xxxx xxxxx xxxx xxxx xxxxx Potent Cap.: xxxx xxxx xxxxx 1398 xxxx xxxxx xxxx xxxx xxxxx Move Cap.: xxxx xxxx xxxxx 1398 xxxx xxxxx xxxx xxxx xxxxx Volume/Cap: xxxx xxxx xxxx 0.00 xxxx xxxx xxxx xxxx xxxx Level Of Service Module: 2Way95thQ: xxxx xxxx xxxxx 0.0 xxxx xxxxx xxxx xxxx xxxxx xxxx xxxx xxxxx Control Del:xxxxx xxxx xxxxx 7.6 xxxx xxxxx xxxxx xxxx xxxxx xxxxx xxxx xxxxx LOS by Move: * * * A * * * * * * * * Movement: LT - LTR - RT LT - LTR - RT LT - LTR - RT LT - LTR - RT Shared Cap.: xxxx xxxx xxxxx xxxx xxxx xxxxx xxxx xxxx xxxxx xxxx 756 xxxxx SharedQueue:xxxxx xxxx xxxxx 0.0 xxxx xxxxx xxxxx xxxx xxxxx xxxxx 0.1 xxxxx Shrd ConDel:xxxxx xxxx xxxxx 7.6 xxxx xxxxx xxxxx xxxx xxxxx xxxxx 10.0 xxxxx Shared LOS: * * * A * * * * * * A * ApproachDel: xxxxxx xxxxxx xxxxxx 10.0 ApproachLOS: * * * A Note: Queue reported is the number of cars per lane. Traffix (c) 2008 Dowling Assoc. Licensed to KOA CORP, MONTEREY PK
121 Near PM Mon Feb 28, :26:38 Page 1-1 Near Term PM With Project Scenario Report Scenario: Near PM Command: Near Term PM Volume: Near Term PM Geometry: Existing Impact Fee: Default Impact Fee Trip Generation: PM Trip Distribution: Project Paths: Default Path Routes: Default Route Configuration: Default Configuration Near PM Mon Feb 28, :26:38 Page 2-1 Near Term PM With Project Trip Generation Report Forecast for PM Zone Rate Rate Trips Trips Total % Of # Subzone Amount Units In Out In Out Trips Total Empire Homes 1.00 Empire Homes Zone 1 Subtotal Town and Cou 1.00 condo/townhous Zone 7 Subtotal Olen Propert 1.00 project Zone 8 Subtotal Renaissance 1.00 project Zone 12 Subtotal Town and Cou 1.00 Medical-dental Zone 13 Subtotal CHOC 1.00 Hospital Zone 14 Subtotal Alliance Chu 1.00 project Zone 15 Subtotal Empire Homes 1.00 Empire Homes Zone 16 Subtotal TOTAL Traffix (c) 2008 Dowling Assoc. Licensed to KOA CORP, MONTEREY PK Traffix (c) 2008 Dowling Assoc. Licensed to KOA CORP, MONTEREY PK
122 Near PM Mon Feb 28, :26:39 Page 3-1 Near Term PM With Project Impact Analysis Report Level Of Service Intersection Base Future Change Del/ V/ Del/ V/ in LOS Veh C LOS Veh C # 1 Grand Av (N/S) / Santa Clara A B xxxxx B xxxxx V/C # 2 Wright St (N/S) / Santa Clara D D D/V # 3 Project Driveway (N/S) / Santa A B D/V # 4 Lyon St (N/S) / Santa Clara Av B B D/V # 5 Tustin Ave (N/S) / Santa Clara A xxxxx A xxxxx V/C # 6 Wright St (N/S) / Avalon Ave ( A A D/V Near PM Mon Feb 28, :26:39 Page 4-1 Near Term PM With Project Level Of Service Computation Report ICU 1(Loss as Cycle Length %) Method (Future Volume Alternative) Intersection #1 Grand Av (N/S) / Santa Clara Ave (E/W) Cycle (sec): 100 Critical Vol./Cap.(X): Loss Time (sec): 5 Average Delay (sec/veh): xxxxxx Optimal Cycle: 35 Level Of Service: B Approach: North Bound South Bound East Bound West Bound Movement: L - T - R L - T - R L - T - R L - T - R Control: Protected Protected Permitted Permitted Rights: Include Include Include Include Min. Green: Y+R: Lanes: Volume Module: Base Vol: Growth Adj: Initial Bse: Added Vol: PasserByVol: Initial Fut: User Adj: PHF Adj: PHF Volume: Reduct Vol: Reduced Vol: PCE Adj: MLF Adj: FinalVolume: Saturation Flow Module: Sat/Lane: Adjustment: Lanes: Final Sat.: Capacity Analysis Module: Vol/Sat: Crit Moves: **** **** **** **** Traffix (c) 2008 Dowling Assoc. Licensed to KOA CORP, MONTEREY PK Traffix (c) 2008 Dowling Assoc. Licensed to KOA CORP, MONTEREY PK
123 Near PM Mon Feb 28, :26:39 Page 5-1 Near Term PM With Project Level Of Service Computation Report 2000 HCM Unsignalized Method (Future Volume Alternative) Intersection #2 Wright St (N/S) / Santa Clara Ave (E/W) Average Delay (sec/veh): 5.5 Worst Case Level Of Service: D[ 34.0] Approach: North Bound South Bound East Bound West Bound Movement: L - T - R L - T - R L - T - R L - T - R Control: Stop Sign Stop Sign Uncontrolled Uncontrolled Rights: Include Include Include Include Lanes: 0 0 1! ! ! ! 0 0 Volume Module: Base Vol: Growth Adj: Initial Bse: Added Vol: PasserByVol: Initial Fut: User Adj: PHF Adj: PHF Volume: Reduct Vol: FinalVolume: Critical Gap Module: Critical Gp: xxxx xxxxx 4.1 xxxx xxxxx FollowUpTim: xxxx xxxxx 2.2 xxxx xxxxx Capacity Module: Cnflict Vol: xxxx xxxxx 538 xxxx xxxxx Potent Cap.: xxxx xxxxx 1040 xxxx xxxxx Move Cap.: xxxx xxxxx 1040 xxxx xxxxx Volume/Cap: xxxx xxxx 0.03 xxxx xxxx Level Of Service Module: 2Way95thQ: xxxx xxxx xxxxx xxxx xxxx xxxxx 0.0 xxxx xxxxx 0.1 xxxx xxxxx Control Del:xxxxx xxxx xxxxx xxxxx xxxx xxxxx 7.9 xxxx xxxxx 8.6 xxxx xxxxx LOS by Move: * * * * * * A * * A * * Movement: LT - LTR - RT LT - LTR - RT LT - LTR - RT LT - LTR - RT Shared Cap.: xxxx 278 xxxxx xxxx 594 xxxxx xxxx xxxx xxxxx xxxx xxxx xxxxx SharedQueue:xxxxx 3.3 xxxxx xxxxx 0.1 xxxxx xxxxx xxxx xxxxx xxxxx xxxx xxxxx Shrd ConDel:xxxxx 34.0 xxxxx xxxxx 11.2 xxxxx xxxxx xxxx xxxxx xxxxx xxxx xxxxx Shared LOS: * D * * B * * * * * * * ApproachDel: xxxxxx xxxxxx ApproachLOS: D B * * Note: Queue reported is the number of cars per lane. Near PM Mon Feb 28, :26:39 Page 6-1 Near Term PM With Project Level Of Service Computation Report 2000 HCM Unsignalized Method (Future Volume Alternative) Intersection #3 Project Driveway (N/S) / Santa Clara Ave (E/W) Average Delay (sec/veh): 0.2 Worst Case Level Of Service: B[ 13.0] Approach: North Bound South Bound East Bound West Bound Movement: L - T - R L - T - R L - T - R L - T - R Control: Stop Sign Stop Sign Uncontrolled Uncontrolled Rights: Include Include Include Include Lanes: 0 0 1! Volume Module: Base Vol: Growth Adj: Initial Bse: Added Vol: PasserByVol: Initial Fut: User Adj: PHF Adj: PHF Volume: Reduct Vol: FinalVolume: Critical Gap Module: Critical Gp: xxxxx xxxx xxxxx xxxxx xxxx xxxxx 4.1 xxxx xxxxx FollowUpTim: xxxxx xxxx xxxxx xxxxx xxxx xxxxx 2.2 xxxx xxxxx Capacity Module: Cnflict Vol: xxxx xxxx xxxxx xxxx xxxx xxxxx 509 xxxx xxxxx Potent Cap.: xxxx xxxx xxxxx xxxx xxxx xxxxx 1066 xxxx xxxxx Move Cap.: xxxx xxxx xxxxx xxxx xxxx xxxxx 1066 xxxx xxxxx Volume/Cap: xxxx xxxx xxxx xxxx xxxx xxxx 0.01 xxxx xxxx Level Of Service Module: 2Way95thQ: xxxx xxxx xxxxx xxxx xxxx xxxxx xxxx xxxx xxxxx 0.0 xxxx xxxxx Control Del:xxxxx xxxx xxxxx xxxxx xxxx xxxxx xxxxx xxxx xxxxx 8.4 xxxx xxxxx LOS by Move: * * * * * * * * * A * * Movement: LT - LTR - RT LT - LTR - RT LT - LTR - RT LT - LTR - RT Shared Cap.: xxxx 459 xxxxx xxxx xxxx xxxxx xxxx xxxx xxxxx xxxx xxxx xxxxx SharedQueue:xxxxx 0.0 xxxxx xxxxx xxxx xxxxx xxxxx xxxx xxxxx 0.0 xxxx xxxxx Shrd ConDel:xxxxx 13.0 xxxxx xxxxx xxxx xxxxx xxxxx xxxx xxxxx 8.4 xxxx xxxxx Shared LOS: * B * * * * * * * A * * ApproachDel: 13.0 xxxxxx xxxxxx xxxxxx ApproachLOS: B * * * Note: Queue reported is the number of cars per lane. Traffix (c) 2008 Dowling Assoc. Licensed to KOA CORP, MONTEREY PK Traffix (c) 2008 Dowling Assoc. Licensed to KOA CORP, MONTEREY PK
124 Near PM Mon Feb 28, :26:40 Page 7-1 Near Term PM With Project Level Of Service Computation Report 2000 HCM Unsignalized Method (Future Volume Alternative) Intersection #4 Lyon St (N/S) / Santa Clara Ave (E/W) Average Delay (sec/veh): 0.3 Worst Case Level Of Service: B[ 14.3] Approach: North Bound South Bound East Bound West Bound Movement: L - T - R L - T - R L - T - R L - T - R Control: Stop Sign Stop Sign Uncontrolled Uncontrolled Rights: Include Include Include Include Lanes: ! Volume Module: Base Vol: Growth Adj: Initial Bse: Added Vol: PasserByVol: Initial Fut: User Adj: PHF Adj: PHF Volume: Reduct Vol: FinalVolume: Critical Gap Module: Critical Gp:xxxxx xxxx xxxxx xxxxx xxxx xxxxx xxxxx xxxx xxxxx FollowUpTim:xxxxx xxxx xxxxx xxxxx xxxx xxxxx xxxxx xxxx xxxxx Capacity Module: Cnflict Vol: xxxx xxxx xxxxx xxxx xxxx xxxxx xxxx xxxx xxxxx Potent Cap.: xxxx xxxx xxxxx xxxx xxxx xxxxx xxxx xxxx xxxxx Move Cap.: xxxx xxxx xxxxx xxxx xxxx xxxxx xxxx xxxx xxxxx Volume/Cap: xxxx xxxx xxxx xxxx xxxx xxxx xxxx xxxx xxxx Level Of Service Module: 2Way95thQ: xxxx xxxx xxxxx xxxx xxxx xxxxx xxxx xxxx xxxxx xxxx xxxx xxxxx Control Del:xxxxx xxxx xxxxx xxxxx xxxx xxxxx xxxxx xxxx xxxxx xxxxx xxxx xxxxx LOS by Move: * * * * * * * * * * * * Movement: LT - LTR - RT LT - LTR - RT LT - LTR - RT LT - LTR - RT Shared Cap.: xxxx xxxx xxxxx xxxx 407 xxxxx xxxx xxxx xxxxx xxxx xxxx xxxxx SharedQueue:xxxxx xxxx xxxxx xxxxx 0.1 xxxxx xxxxx xxxx xxxxx xxxxx xxxx xxxxx Shrd ConDel:xxxxx xxxx xxxxx xxxxx 14.3 xxxxx xxxxx xxxx xxxxx xxxxx xxxx xxxxx Shared LOS: * * * * B * * * * * * * ApproachDel: xxxxxx 14.3 xxxxxx xxxxxx ApproachLOS: * B * * Note: Queue reported is the number of cars per lane. Near PM Mon Feb 28, :26:40 Page 8-1 Near Term PM With Project Level Of Service Computation Report ICU 1(Loss as Cycle Length %) Method (Future Volume Alternative) Intersection #5 Tustin Ave (N/S) / Santa Clara Ave (E/W) Cycle (sec): 100 Critical Vol./Cap.(X): Loss Time (sec): 5 Average Delay (sec/veh): xxxxxx Optimal Cycle: 28 Level Of Service: A Approach: North Bound South Bound East Bound West Bound Movement: L - T - R L - T - R L - T - R L - T - R Control: Protected Protected Permitted Permitted Rights: Include Include Include Include Min. Green: Y+R: Lanes: Volume Module: Base Vol: Growth Adj: Initial Bse: Added Vol: PasserByVol: Initial Fut: User Adj: PHF Adj: PHF Volume: Reduct Vol: Reduced Vol: PCE Adj: MLF Adj: FinalVolume: Saturation Flow Module: Sat/Lane: Adjustment: Lanes: Final Sat.: Capacity Analysis Module: Vol/Sat: Crit Moves: **** **** **** **** Traffix (c) 2008 Dowling Assoc. Licensed to KOA CORP, MONTEREY PK Traffix (c) 2008 Dowling Assoc. Licensed to KOA CORP, MONTEREY PK
125 Near PM Mon Feb 28, :26:40 Page 9-1 Near Term PM With Project Level Of Service Computation Report 2000 HCM Unsignalized Method (Future Volume Alternative) Intersection #6 Wright St (N/S) / Avalon Ave (E/W) Average Delay (sec/veh): 1.0 Worst Case Level Of Service: A[ 9.6] Approach: North Bound South Bound East Bound West Bound Movement: L - T - R L - T - R L - T - R L - T - R Control: Uncontrolled Uncontrolled Stop Sign Stop Sign Rights: Include Include Include Include Lanes: ! 0 0 Volume Module: Base Vol: Growth Adj: Initial Bse: Added Vol: PasserByVol: Initial Fut: User Adj: PHF Adj: PHF Volume: Reduct Vol: FinalVolume: Critical Gap Module: Critical Gp:xxxxx xxxx xxxxx 4.1 xxxx xxxxx xxxxx xxxx xxxxx FollowUpTim:xxxxx xxxx xxxxx 2.2 xxxx xxxxx xxxxx xxxx xxxxx Capacity Module: Cnflict Vol: xxxx xxxx xxxxx 186 xxxx xxxxx xxxx xxxx xxxxx Potent Cap.: xxxx xxxx xxxxx 1400 xxxx xxxxx xxxx xxxx xxxxx Move Cap.: xxxx xxxx xxxxx 1400 xxxx xxxxx xxxx xxxx xxxxx Volume/Cap: xxxx xxxx xxxx 0.02 xxxx xxxx xxxx xxxx xxxx Level Of Service Module: 2Way95thQ: xxxx xxxx xxxxx 0.1 xxxx xxxxx xxxx xxxx xxxxx xxxx xxxx xxxxx Control Del:xxxxx xxxx xxxxx 7.6 xxxx xxxxx xxxxx xxxx xxxxx xxxxx xxxx xxxxx LOS by Move: * * * A * * * * * * * * Movement: LT - LTR - RT LT - LTR - RT LT - LTR - RT LT - LTR - RT Shared Cap.: xxxx xxxx xxxxx xxxx xxxx xxxxx xxxx xxxx xxxxx xxxx 791 xxxxx SharedQueue:xxxxx xxxx xxxxx 0.1 xxxx xxxxx xxxxx xxxx xxxxx xxxxx 0.1 xxxxx Shrd ConDel:xxxxx xxxx xxxxx 7.6 xxxx xxxxx xxxxx xxxx xxxxx xxxxx 9.6 xxxxx Shared LOS: * * * A * * * * * * A * ApproachDel: xxxxxx xxxxxx xxxxxx 9.6 ApproachLOS: * * * A Note: Queue reported is the number of cars per lane. Traffix (c) 2008 Dowling Assoc. Licensed to KOA CORP, MONTEREY PK
126 Build Out AM Mon Feb 28, :30:13 Page 1-1 Build Out With Project AM Scenario Report Scenario: Build Out AM Command: Build Out AM Volume: Build Out AM Geometry: Existing Impact Fee: Default Impact Fee Trip Generation: AM Trip Distribution: Project Paths: Default Path Routes: Default Route Configuration: Default Configuration Build Out AM Mon Feb 28, :30:13 Page 2-1 Build Out With Project AM Trip Generation Report Forecast for AM Zone Rate Rate Trips Trips Total % Of # Subzone Amount Units In Out In Out Trips Total Empire Homes 1.00 Empire Homes Zone 1 Subtotal Empire Homes 1.00 Empire Homes Zone 16 Subtotal TOTAL Traffix (c) 2008 Dowling Assoc. Licensed to KOA CORP, MONTEREY PK Traffix (c) 2008 Dowling Assoc. Licensed to KOA CORP, MONTEREY PK
127 Build Out AM Mon Feb 28, :30:14 Page 3-1 Build Out With Project AM Impact Analysis Report Level Of Service Intersection Base Future Change Del/ V/ Del/ V/ in LOS Veh C LOS Veh C # 1 Grand Av (N/S) / Santa Clara A E xxxxx E xxxxx V/C # 2 Wright St (N/S) / Santa Clara C C D/V # 3 Project Driveway (N/S) / Santa A B D/V # 4 Lyon St (N/S) / Santa Clara Av B B D/V # 5 Tustin Ave (N/S) / Santa Clara D xxxxx D xxxxx V/C # 6 Wright St (N/S) / Avalon Ave ( B B D/V Build Out AM Mon Feb 28, :30:14 Page 4-1 Build Out With Project AM Level Of Service Computation Report ICU 1(Loss as Cycle Length %) Method (Future Volume Alternative) Intersection #1 Grand Av (N/S) / Santa Clara Ave (E/W) Cycle (sec): 100 Critical Vol./Cap.(X): Loss Time (sec): 5 Average Delay (sec/veh): xxxxxx Optimal Cycle: 180 Level Of Service: E Approach: North Bound South Bound East Bound West Bound Movement: L - T - R L - T - R L - T - R L - T - R Control: Protected Protected Permitted Permitted Rights: Include Include Include Include Min. Green: Y+R: Lanes: Volume Module: Base Vol: Growth Adj: Initial Bse: Added Vol: PasserByVol: Initial Fut: User Adj: PHF Adj: PHF Volume: Reduct Vol: Reduced Vol: PCE Adj: MLF Adj: FinalVolume: Saturation Flow Module: Sat/Lane: Adjustment: Lanes: Final Sat.: Capacity Analysis Module: Vol/Sat: Crit Moves: **** **** **** **** Traffix (c) 2008 Dowling Assoc. Licensed to KOA CORP, MONTEREY PK Traffix (c) 2008 Dowling Assoc. Licensed to KOA CORP, MONTEREY PK
128 Build Out AM Mon Feb 28, :30:14 Page 5-1 Build Out With Project AM Level Of Service Computation Report 2000 HCM Unsignalized Method (Future Volume Alternative) Intersection #2 Wright St (N/S) / Santa Clara Ave (E/W) Average Delay (sec/veh): 3.1 Worst Case Level Of Service: C[ 18.0] Approach: North Bound South Bound East Bound West Bound Movement: L - T - R L - T - R L - T - R L - T - R Control: Stop Sign Stop Sign Uncontrolled Uncontrolled Rights: Include Include Include Include Lanes: 0 0 1! ! ! Volume Module: Base Vol: Growth Adj: Initial Bse: Added Vol: PasserByVol: Initial Fut: User Adj: PHF Adj: PHF Volume: Reduct Vol: FinalVolume: Critical Gap Module: Critical Gp: xxxx xxxxx 4.1 xxxx xxxxx FollowUpTim: xxxx xxxxx 2.2 xxxx xxxxx Capacity Module: Cnflict Vol: xxxx xxxxx 375 xxxx xxxxx Potent Cap.: xxxx xxxxx 1194 xxxx xxxxx Move Cap.: xxxx xxxxx 1194 xxxx xxxxx Volume/Cap: xxxx xxxx 0.04 xxxx xxxx Level Of Service Module: 2Way95thQ: xxxx xxxx xxxxx xxxx xxxx xxxxx 0.0 xxxx xxxxx 0.1 xxxx xxxxx Control Del:xxxxx xxxx xxxxx xxxxx xxxx xxxxx 8.0 xxxx xxxxx 8.1 xxxx xxxxx LOS by Move: * * * * * * A * * A * * Movement: LT - LTR - RT LT - LTR - RT LT - LTR - RT LT - LTR - RT Shared Cap.: xxxx 385 xxxxx xxxx 515 xxxxx xxxx xxxx xxxxx xxxx xxxx xxxxx SharedQueue:xxxxx 1.1 xxxxx xxxxx 0.2 xxxxx xxxxx xxxx xxxxx 0.1 xxxx xxxxx Shrd ConDel:xxxxx 18.0 xxxxx xxxxx 12.5 xxxxx xxxxx xxxx xxxxx 8.1 xxxx xxxxx Shared LOS: * C * * B * * * * A * * ApproachDel: xxxxxx xxxxxx ApproachLOS: C B * * Note: Queue reported is the number of cars per lane. Build Out AM Mon Feb 28, :30:14 Page 6-1 Build Out With Project AM Level Of Service Computation Report 2000 HCM Unsignalized Method (Future Volume Alternative) Intersection #3 Project Driveway (N/S) / Santa Clara Ave (E/W) Average Delay (sec/veh): 0.2 Worst Case Level Of Service: B[ 11.2] Approach: North Bound South Bound East Bound West Bound Movement: L - T - R L - T - R L - T - R L - T - R Control: Stop Sign Stop Sign Uncontrolled Uncontrolled Rights: Include Include Include Include Lanes: 0 0 1! Volume Module: Base Vol: Growth Adj: Initial Bse: Added Vol: PasserByVol: Initial Fut: User Adj: PHF Adj: PHF Volume: Reduct Vol: FinalVolume: Critical Gap Module: Critical Gp: xxxxx xxxx xxxxx xxxxx xxxx xxxxx 4.1 xxxx xxxxx FollowUpTim: xxxxx xxxx xxxxx xxxxx xxxx xxxxx 2.2 xxxx xxxxx Capacity Module: Cnflict Vol: xxxx xxxx xxxxx xxxx xxxx xxxxx 334 xxxx xxxxx Potent Cap.: xxxx xxxx xxxxx xxxx xxxx xxxxx 1237 xxxx xxxxx Move Cap.: xxxx xxxx xxxxx xxxx xxxx xxxxx 1237 xxxx xxxxx Volume/Cap: xxxx xxxx xxxx xxxx xxxx xxxx 0.00 xxxx xxxx Level Of Service Module: 2Way95thQ: xxxx xxxx xxxxx xxxx xxxx xxxxx xxxx xxxx xxxxx 0.0 xxxx xxxxx Control Del:xxxxx xxxx xxxxx xxxxx xxxx xxxxx xxxxx xxxx xxxxx 7.9 xxxx xxxxx LOS by Move: * * * * * * * * * A * * Movement: LT - LTR - RT LT - LTR - RT LT - LTR - RT LT - LTR - RT Shared Cap.: xxxx 591 xxxxx xxxx xxxx xxxxx xxxx xxxx xxxxx xxxx xxxx xxxxx SharedQueue:xxxxx 0.1 xxxxx xxxxx xxxx xxxxx xxxxx xxxx xxxxx 0.0 xxxx xxxxx Shrd ConDel:xxxxx 11.2 xxxxx xxxxx xxxx xxxxx xxxxx xxxx xxxxx 7.9 xxxx xxxxx Shared LOS: * B * * * * * * * A * * ApproachDel: 11.2 xxxxxx xxxxxx xxxxxx ApproachLOS: B * * * Note: Queue reported is the number of cars per lane. Traffix (c) 2008 Dowling Assoc. Licensed to KOA CORP, MONTEREY PK Traffix (c) 2008 Dowling Assoc. Licensed to KOA CORP, MONTEREY PK
129 Build Out AM Mon Feb 28, :30:14 Page 7-1 Build Out With Project AM Level Of Service Computation Report 2000 HCM Unsignalized Method (Future Volume Alternative) Intersection #4 Lyon St (N/S) / Santa Clara Ave (E/W) Average Delay (sec/veh): 0.4 Worst Case Level Of Service: B[ 12.5] Approach: North Bound South Bound East Bound West Bound Movement: L - T - R L - T - R L - T - R L - T - R Control: Stop Sign Stop Sign Uncontrolled Uncontrolled Rights: Include Include Include Include Lanes: ! Volume Module: Base Vol: Growth Adj: Initial Bse: Added Vol: PasserByVol: Initial Fut: User Adj: PHF Adj: PHF Volume: Reduct Vol: FinalVolume: Critical Gap Module: Critical Gp:xxxxx xxxx xxxxx xxxx xxxxx xxxxx xxxx xxxxx FollowUpTim:xxxxx xxxx xxxxx xxxx xxxxx xxxxx xxxx xxxxx Capacity Module: Cnflict Vol: xxxx xxxx xxxxx xxxx xxxxx xxxx xxxx xxxxx Potent Cap.: xxxx xxxx xxxxx xxxx xxxxx xxxx xxxx xxxxx Move Cap.: xxxx xxxx xxxxx xxxx xxxxx xxxx xxxx xxxxx Volume/Cap: xxxx xxxx xxxx xxxx xxxx xxxx xxxx xxxx Level Of Service Module: 2Way95thQ: xxxx xxxx xxxxx xxxx xxxx xxxxx 0.0 xxxx xxxxx xxxx xxxx xxxxx Control Del:xxxxx xxxx xxxxx xxxxx xxxx xxxxx 8.0 xxxx xxxxx xxxxx xxxx xxxxx LOS by Move: * * * * * * A * * * * * Movement: LT - LTR - RT LT - LTR - RT LT - LTR - RT LT - LTR - RT Shared Cap.: xxxx xxxx xxxxx xxxx 498 xxxxx xxxx xxxx xxxxx xxxx xxxx xxxxx SharedQueue:xxxxx xxxx xxxxx xxxxx 0.1 xxxxx 0.0 xxxx xxxxx xxxxx xxxx xxxxx Shrd ConDel:xxxxx xxxx xxxxx xxxxx 12.5 xxxxx 8.0 xxxx xxxxx xxxxx xxxx xxxxx Shared LOS: * * * * B * A * * * * * ApproachDel: xxxxxx 12.5 xxxxxx xxxxxx ApproachLOS: * B * * Note: Queue reported is the number of cars per lane. Build Out AM Mon Feb 28, :30:14 Page 8-1 Build Out With Project AM Level Of Service Computation Report ICU 1(Loss as Cycle Length %) Method (Future Volume Alternative) Intersection #5 Tustin Ave (N/S) / Santa Clara Ave (E/W) Cycle (sec): 100 Critical Vol./Cap.(X): Loss Time (sec): 5 Average Delay (sec/veh): xxxxxx Optimal Cycle: 65 Level Of Service: D Approach: North Bound South Bound East Bound West Bound Movement: L - T - R L - T - R L - T - R L - T - R Control: Protected Protected Permitted Permitted Rights: Include Include Include Include Min. Green: Y+R: Lanes: Volume Module: Base Vol: Growth Adj: Initial Bse: Added Vol: PasserByVol: Initial Fut: User Adj: PHF Adj: PHF Volume: Reduct Vol: Reduced Vol: PCE Adj: MLF Adj: FinalVolume: Saturation Flow Module: Sat/Lane: Adjustment: Lanes: Final Sat.: Capacity Analysis Module: Vol/Sat: Crit Moves: **** **** **** **** Traffix (c) 2008 Dowling Assoc. Licensed to KOA CORP, MONTEREY PK Traffix (c) 2008 Dowling Assoc. Licensed to KOA CORP, MONTEREY PK
130 Build Out AM Mon Feb 28, :30:14 Page 9-1 Build Out With Project AM Level Of Service Computation Report 2000 HCM Unsignalized Method (Future Volume Alternative) Intersection #6 Wright St (N/S) / Avalon Ave (E/W) Average Delay (sec/veh): 0.6 Worst Case Level Of Service: B[ 10.4] Approach: North Bound South Bound East Bound West Bound Movement: L - T - R L - T - R L - T - R L - T - R Control: Uncontrolled Uncontrolled Stop Sign Stop Sign Rights: Include Include Include Include Lanes: ! 0 0 Volume Module: Base Vol: Growth Adj: Initial Bse: Added Vol: PasserByVol: Initial Fut: User Adj: PHF Adj: PHF Volume: Reduct Vol: FinalVolume: Critical Gap Module: Critical Gp:xxxxx xxxx xxxxx 4.1 xxxx xxxxx xxxxx xxxx xxxxx FollowUpTim:xxxxx xxxx xxxxx 2.2 xxxx xxxxx xxxxx xxxx xxxxx Capacity Module: Cnflict Vol: xxxx xxxx xxxxx 233 xxxx xxxxx xxxx xxxx xxxxx Potent Cap.: xxxx xxxx xxxxx 1346 xxxx xxxxx xxxx xxxx xxxxx Move Cap.: xxxx xxxx xxxxx 1346 xxxx xxxxx xxxx xxxx xxxxx Volume/Cap: xxxx xxxx xxxx 0.00 xxxx xxxx xxxx xxxx xxxx Level Of Service Module: 2Way95thQ: xxxx xxxx xxxxx 0.0 xxxx xxxxx xxxx xxxx xxxxx xxxx xxxx xxxxx Control Del:xxxxx xxxx xxxxx 7.7 xxxx xxxxx xxxxx xxxx xxxxx xxxxx xxxx xxxxx LOS by Move: * * * A * * * * * * * * Movement: LT - LTR - RT LT - LTR - RT LT - LTR - RT LT - LTR - RT Shared Cap.: xxxx xxxx xxxxx xxxx xxxx xxxxx xxxx xxxx xxxxx xxxx 694 xxxxx SharedQueue:xxxxx xxxx xxxxx 0.0 xxxx xxxxx xxxxx xxxx xxxxx xxxxx 0.1 xxxxx Shrd ConDel:xxxxx xxxx xxxxx 7.7 xxxx xxxxx xxxxx xxxx xxxxx xxxxx 10.4 xxxxx Shared LOS: * * * A * * * * * * B * ApproachDel: xxxxxx xxxxxx xxxxxx 10.4 ApproachLOS: * * * B Note: Queue reported is the number of cars per lane. Traffix (c) 2008 Dowling Assoc. Licensed to KOA CORP, MONTEREY PK
131 Build Out PM Mon Feb 28, :31:06 Page 1-1 Build Out With Project PM Scenario Report Scenario: Build Out PM Command: Build Out PM Volume: Build Out PM Geometry: Existing Impact Fee: Default Impact Fee Trip Generation: PM Trip Distribution: Project Paths: Default Path Routes: Default Route Configuration: Default Configuration Build Out PM Mon Feb 28, :31:06 Page 2-1 Build Out With Project PM Trip Generation Report Forecast for PM Zone Rate Rate Trips Trips Total % Of # Subzone Amount Units In Out In Out Trips Total Empire Homes 1.00 Empire Homes Zone 1 Subtotal Empire Homes 1.00 Empire Homes Zone 16 Subtotal TOTAL Traffix (c) 2008 Dowling Assoc. Licensed to KOA CORP, MONTEREY PK Traffix (c) 2008 Dowling Assoc. Licensed to KOA CORP, MONTEREY PK
132 Build Out PM Mon Feb 28, :31:07 Page 3-1 Build Out With Project PM Impact Analysis Report Level Of Service Intersection Base Future Change Del/ V/ Del/ V/ in LOS Veh C LOS Veh C # 1 Grand Av (N/S) / Santa Clara A D xxxxx D xxxxx V/C # 2 Wright St (N/S) / Santa Clara F F D/V # 3 Project Driveway (N/S) / Santa A B D/V # 4 Lyon St (N/S) / Santa Clara Av C C D/V # 5 Tustin Ave (N/S) / Santa Clara C xxxxx C xxxxx V/C # 6 Wright St (N/S) / Avalon Ave ( A A D/V Build Out PM Mon Feb 28, :31:07 Page 4-1 Build Out With Project PM Level Of Service Computation Report ICU 1(Loss as Cycle Length %) Method (Future Volume Alternative) Intersection #1 Grand Av (N/S) / Santa Clara Ave (E/W) Cycle (sec): 100 Critical Vol./Cap.(X): Loss Time (sec): 5 Average Delay (sec/veh): xxxxxx Optimal Cycle: 63 Level Of Service: D Approach: North Bound South Bound East Bound West Bound Movement: L - T - R L - T - R L - T - R L - T - R Control: Protected Protected Permitted Permitted Rights: Include Include Include Include Min. Green: Y+R: Lanes: Volume Module: Base Vol: Growth Adj: Initial Bse: Added Vol: PasserByVol: Initial Fut: User Adj: PHF Adj: PHF Volume: Reduct Vol: Reduced Vol: PCE Adj: MLF Adj: FinalVolume: Saturation Flow Module: Sat/Lane: Adjustment: Lanes: Final Sat.: Capacity Analysis Module: Vol/Sat: Crit Moves: **** **** **** **** Traffix (c) 2008 Dowling Assoc. Licensed to KOA CORP, MONTEREY PK Traffix (c) 2008 Dowling Assoc. Licensed to KOA CORP, MONTEREY PK
133 Build Out PM Mon Feb 28, :31:07 Page 5-1 Build Out With Project PM Level Of Service Computation Report 2000 HCM Unsignalized Method (Future Volume Alternative) Intersection #2 Wright St (N/S) / Santa Clara Ave (E/W) Average Delay (sec/veh): 13.1 Worst Case Level Of Service: F[ 83.5] Approach: North Bound South Bound East Bound West Bound Movement: L - T - R L - T - R L - T - R L - T - R Control: Stop Sign Stop Sign Uncontrolled Uncontrolled Rights: Include Include Include Include Lanes: 0 0 1! ! ! ! 0 0 Volume Module: Base Vol: Growth Adj: Initial Bse: Added Vol: PasserByVol: Initial Fut: User Adj: PHF Adj: PHF Volume: Reduct Vol: FinalVolume: Critical Gap Module: Critical Gp: xxxx xxxxx 4.1 xxxx xxxxx FollowUpTim: xxxx xxxxx 2.2 xxxx xxxxx Capacity Module: Cnflict Vol: xxxx xxxxx 635 xxxx xxxxx Potent Cap.: xxxx xxxxx 958 xxxx xxxxx Move Cap.: xxxx xxxxx 958 xxxx xxxxx Volume/Cap: xxxx xxxx 0.04 xxxx xxxx Level Of Service Module: 2Way95thQ: xxxx xxxx xxxxx xxxx xxxx xxxxx 0.1 xxxx xxxxx 0.1 xxxx xxxxx Control Del:xxxxx xxxx xxxxx xxxxx xxxx xxxxx 8.1 xxxx xxxxx 8.9 xxxx xxxxx LOS by Move: * * * * * * A * * A * * Movement: LT - LTR - RT LT - LTR - RT LT - LTR - RT LT - LTR - RT Shared Cap.: xxxx 215 xxxxx xxxx 530 xxxxx xxxx xxxx xxxxx xxxx xxxx xxxxx SharedQueue:xxxxx 7.2 xxxxx xxxxx 0.1 xxxxx xxxxx xxxx xxxxx xxxxx xxxx xxxxx Shrd ConDel:xxxxx 83.5 xxxxx xxxxx 12.0 xxxxx xxxxx xxxx xxxxx xxxxx xxxx xxxxx Shared LOS: * F * * B * * * * * * * ApproachDel: xxxxxx xxxxxx ApproachLOS: F B * * Note: Queue reported is the number of cars per lane. Build Out PM Mon Feb 28, :31:07 Page 6-1 Build Out With Project PM Level Of Service Computation Report 2000 HCM Unsignalized Method (Future Volume Alternative) Intersection #3 Project Driveway (N/S) / Santa Clara Ave (E/W) Average Delay (sec/veh): 0.2 Worst Case Level Of Service: B[ 13.7] Approach: North Bound South Bound East Bound West Bound Movement: L - T - R L - T - R L - T - R L - T - R Control: Stop Sign Stop Sign Uncontrolled Uncontrolled Rights: Include Include Include Include Lanes: 0 0 1! Volume Module: Base Vol: Growth Adj: Initial Bse: Added Vol: PasserByVol: Initial Fut: User Adj: PHF Adj: PHF Volume: Reduct Vol: FinalVolume: Critical Gap Module: Critical Gp: xxxxx xxxx xxxxx xxxxx xxxx xxxxx 4.1 xxxx xxxxx FollowUpTim: xxxxx xxxx xxxxx xxxxx xxxx xxxxx 2.2 xxxx xxxxx Capacity Module: Cnflict Vol: xxxx xxxx xxxxx xxxx xxxx xxxxx 558 xxxx xxxxx Potent Cap.: xxxx xxxx xxxxx xxxx xxxx xxxxx 1023 xxxx xxxxx Move Cap.: xxxx xxxx xxxxx xxxx xxxx xxxxx 1023 xxxx xxxxx Volume/Cap: xxxx xxxx xxxx xxxx xxxx xxxx 0.01 xxxx xxxx Level Of Service Module: 2Way95thQ: xxxx xxxx xxxxx xxxx xxxx xxxxx xxxx xxxx xxxxx 0.0 xxxx xxxxx Control Del:xxxxx xxxx xxxxx xxxxx xxxx xxxxx xxxxx xxxx xxxxx 8.6 xxxx xxxxx LOS by Move: * * * * * * * * * A * * Movement: LT - LTR - RT LT - LTR - RT LT - LTR - RT LT - LTR - RT Shared Cap.: xxxx 420 xxxxx xxxx xxxx xxxxx xxxx xxxx xxxxx xxxx xxxx xxxxx SharedQueue:xxxxx 0.1 xxxxx xxxxx xxxx xxxxx xxxxx xxxx xxxxx 0.0 xxxx xxxxx Shrd ConDel:xxxxx 13.7 xxxxx xxxxx xxxx xxxxx xxxxx xxxx xxxxx 8.6 xxxx xxxxx Shared LOS: * B * * * * * * * A * * ApproachDel: 13.7 xxxxxx xxxxxx xxxxxx ApproachLOS: B * * * Note: Queue reported is the number of cars per lane. Traffix (c) 2008 Dowling Assoc. Licensed to KOA CORP, MONTEREY PK Traffix (c) 2008 Dowling Assoc. Licensed to KOA CORP, MONTEREY PK
134 Build Out PM Mon Feb 28, :31:07 Page 7-1 Build Out With Project PM Level Of Service Computation Report 2000 HCM Unsignalized Method (Future Volume Alternative) Intersection #4 Lyon St (N/S) / Santa Clara Ave (E/W) Average Delay (sec/veh): 0.3 Worst Case Level Of Service: C[ 16.3] Approach: North Bound South Bound East Bound West Bound Movement: L - T - R L - T - R L - T - R L - T - R Control: Stop Sign Stop Sign Uncontrolled Uncontrolled Rights: Include Include Include Include Lanes: ! Volume Module: Base Vol: Growth Adj: Initial Bse: Added Vol: PasserByVol: Initial Fut: User Adj: PHF Adj: PHF Volume: Reduct Vol: FinalVolume: Critical Gap Module: Critical Gp:xxxxx xxxx xxxxx xxxxx xxxx xxxxx xxxxx xxxx xxxxx FollowUpTim:xxxxx xxxx xxxxx xxxxx xxxx xxxxx xxxxx xxxx xxxxx Capacity Module: Cnflict Vol: xxxx xxxx xxxxx xxxx xxxx xxxxx xxxx xxxx xxxxx Potent Cap.: xxxx xxxx xxxxx xxxx xxxx xxxxx xxxx xxxx xxxxx Move Cap.: xxxx xxxx xxxxx xxxx xxxx xxxxx xxxx xxxx xxxxx Volume/Cap: xxxx xxxx xxxx xxxx xxxx xxxx xxxx xxxx xxxx Level Of Service Module: 2Way95thQ: xxxx xxxx xxxxx xxxx xxxx xxxxx xxxx xxxx xxxxx xxxx xxxx xxxxx Control Del:xxxxx xxxx xxxxx xxxxx xxxx xxxxx xxxxx xxxx xxxxx xxxxx xxxx xxxxx LOS by Move: * * * * * * * * * * * * Movement: LT - LTR - RT LT - LTR - RT LT - LTR - RT LT - LTR - RT Shared Cap.: xxxx xxxx xxxxx xxxx 338 xxxxx xxxx xxxx xxxxx xxxx xxxx xxxxx SharedQueue:xxxxx xxxx xxxxx xxxxx 0.2 xxxxx xxxxx xxxx xxxxx xxxxx xxxx xxxxx Shrd ConDel:xxxxx xxxx xxxxx xxxxx 16.3 xxxxx xxxxx xxxx xxxxx xxxxx xxxx xxxxx Shared LOS: * * * * C * * * * * * * ApproachDel: xxxxxx 16.3 xxxxxx xxxxxx ApproachLOS: * C * * Note: Queue reported is the number of cars per lane. Build Out PM Mon Feb 28, :31:07 Page 8-1 Build Out With Project PM Level Of Service Computation Report ICU 1(Loss as Cycle Length %) Method (Future Volume Alternative) Intersection #5 Tustin Ave (N/S) / Santa Clara Ave (E/W) Cycle (sec): 100 Critical Vol./Cap.(X): Loss Time (sec): 5 Average Delay (sec/veh): xxxxxx Optimal Cycle: 38 Level Of Service: C Approach: North Bound South Bound East Bound West Bound Movement: L - T - R L - T - R L - T - R L - T - R Control: Protected Protected Permitted Permitted Rights: Include Include Include Include Min. Green: Y+R: Lanes: Volume Module: Base Vol: Growth Adj: Initial Bse: Added Vol: PasserByVol: Initial Fut: User Adj: PHF Adj: PHF Volume: Reduct Vol: Reduced Vol: PCE Adj: MLF Adj: FinalVolume: Saturation Flow Module: Sat/Lane: Adjustment: Lanes: Final Sat.: Capacity Analysis Module: Vol/Sat: Crit Moves: **** **** **** **** Traffix (c) 2008 Dowling Assoc. Licensed to KOA CORP, MONTEREY PK Traffix (c) 2008 Dowling Assoc. Licensed to KOA CORP, MONTEREY PK
135 Build Out PM Mon Feb 28, :31:07 Page 9-1 Build Out With Project PM Level Of Service Computation Report 2000 HCM Unsignalized Method (Future Volume Alternative) Intersection #6 Wright St (N/S) / Avalon Ave (E/W) Average Delay (sec/veh): 0.8 Worst Case Level Of Service: A[ 9.9] Approach: North Bound South Bound East Bound West Bound Movement: L - T - R L - T - R L - T - R L - T - R Control: Uncontrolled Uncontrolled Stop Sign Stop Sign Rights: Include Include Include Include Lanes: ! 0 0 Volume Module: Base Vol: Growth Adj: Initial Bse: Added Vol: PasserByVol: Initial Fut: User Adj: PHF Adj: PHF Volume: Reduct Vol: FinalVolume: Critical Gap Module: Critical Gp:xxxxx xxxx xxxxx 4.1 xxxx xxxxx xxxxx xxxx xxxxx FollowUpTim:xxxxx xxxx xxxxx 2.2 xxxx xxxxx xxxxx xxxx xxxxx Capacity Module: Cnflict Vol: xxxx xxxx xxxxx 222 xxxx xxxxx xxxx xxxx xxxxx Potent Cap.: xxxx xxxx xxxxx 1359 xxxx xxxxx xxxx xxxx xxxxx Move Cap.: xxxx xxxx xxxxx 1359 xxxx xxxxx xxxx xxxx xxxxx Volume/Cap: xxxx xxxx xxxx 0.02 xxxx xxxx xxxx xxxx xxxx Level Of Service Module: 2Way95thQ: xxxx xxxx xxxxx 0.1 xxxx xxxxx xxxx xxxx xxxxx xxxx xxxx xxxxx Control Del:xxxxx xxxx xxxxx 7.7 xxxx xxxxx xxxxx xxxx xxxxx xxxxx xxxx xxxxx LOS by Move: * * * A * * * * * * * * Movement: LT - LTR - RT LT - LTR - RT LT - LTR - RT LT - LTR - RT Shared Cap.: xxxx xxxx xxxxx xxxx xxxx xxxxx xxxx xxxx xxxxx xxxx 751 xxxxx SharedQueue:xxxxx xxxx xxxxx 0.1 xxxx xxxxx xxxxx xxxx xxxxx xxxxx 0.1 xxxxx Shrd ConDel:xxxxx xxxx xxxxx 7.7 xxxx xxxxx xxxxx xxxx xxxxx xxxxx 9.9 xxxxx Shared LOS: * * * A * * * * * * A * ApproachDel: xxxxxx xxxxxx xxxxxx 9.9 ApproachLOS: * * * A Note: Queue reported is the number of cars per lane. Traffix (c) 2008 Dowling Assoc. Licensed to KOA CORP, MONTEREY PK
136 APPENDIX D Future Cumulative Project Information City of Santa Ana/TAVA Homes Traffic Impact Study

137 LEGEND Project Site (TAVA Homes) Alliance Church of Orange Olen Properties Town and County Manor Renaissance Town and Country Medical Center Choc J:\2011\JB13036 SA TAVA Homes\Analysis\Figures\JB13036_Cumulative Proj Location Figure.ai City of Santa Ana TAVA Homes Traffic Impact Study Figure Figure D-1X Cumulative Projects Location Map
138 La Veta Ave Town & Country Rd 22 Memory Ln Fairhaven Ave Main St 15 Lyon St Santa Clara Ave Tustin Ave Grand Ave 30 1 Wright St 17th St th St 1 LEGEND Project Site Alliance Church of Orange 1st St J:\2011\JB13036 SA TAVA Homes\Analysis\Figure\JB13036_Figure.ai City of Santa Ana TAVA Homes Traffic Impact Study Figure D-2 Cumulative Projects #1 Trip Distribution
139 La Veta Ave Town & Country Rd 22 Memory Ln Fairhaven Ave Main St 2 3 Lyon St Santa Clara Ave Tustin Ave 5 Grand Ave Wright St 17th St th St LEGEND Project Site Olen Properties 1st St J:\2011\JB13036 SA TAVA Homes\Analysis\Figure\JB13036_Figure.ai City of Santa Ana TAVA Homes Traffic Impact Study Figure D-3 Cumulative Projects #2 Trip Distribution
140 La Veta Ave Town & Country Rd 3 Memory Ln Fairhaven Ave Main St 10 Lyon St Santa Clara Ave Tustin Ave 5 5 Grand Ave Wright St 17th St th St LEGEND Project Site 1st St 3 5 Town and Country Manor Town and Country Medical Center J:\2011\JB13036 SA TAVA Homes\Analysis\Figure\JB13036_Figure.ai City of Santa Ana TAVA Homes Traffic Impact Study Figure D-4 Cumulative Projects #3 & #5 Trip Distribution
141 La Veta Ave Town & Country Rd 22 Memory Ln Fairhaven Ave Main St 2 3 Lyon St Santa Clara Ave Tustin Ave 5 Grand Ave Wright St 17th St th St LEGEND 5 4 Project Site 1st St 95 4 Metro East Overlay Zone 5 1st and Cabrillo Towers J:\2011\JB13036 SA TAVA Homes\Analysis\Figure\JB13036_Figure.ai City of Santa Ana TAVA Homes Traffic Impact Study Figure D-5 Cumulative Projects #4 & #5 Trip Distribution
142 La Veta Ave Town & Country Rd Main St Memory Ln 4 1 Lyon St Fairhaven Ave Santa Clara Ave Tustin Ave Grand Ave 2 Wright St 17th St th St 6 LEGEND Project Site CHOC 1st St J:\2011\JB13036 SA TAVA Homes\Analysis\Figure\JB13036_Figure.ai City of Santa Ana TAVA Homes Traffic Impact Study Figure D-6 Cumulative Projects #6 Trip Distribution
143 APPENDIX E Traffic Forecast City of Santa Ana/TAVA Homes Traffic Impact Study
144 N Not to Scale J:\2011\JB13036 SA TAVA Homes\Analysis\Figure\JB13036_Figure.ai City of Santa Ana TAVA Homes Traffic Impact Study Figure E Traffic Model, AM Period
145 N Not to Scale J:\2011\JB13036 SA TAVA Homes\Analysis\Figure\JB13036_Figure.ai City of Santa Ana TAVA Homes Traffic Impact Study Figure E Traffic Model, AM Period
146 N Not to Scale J:\2011\JB13036 SA TAVA Homes\Analysis\Figure\JB13036_Figure.ai City of Santa Ana TAVA Homes Traffic Impact Study Figure E Traffic Model, AM Period

147 N Not to Scale J:\2011\JB13036 SA TAVA Homes\Analysis\Figure\JB13036_Figure.ai City of Santa Ana TAVA Homes Traffic Impact Study Figure E Traffic Model, PM Period

148
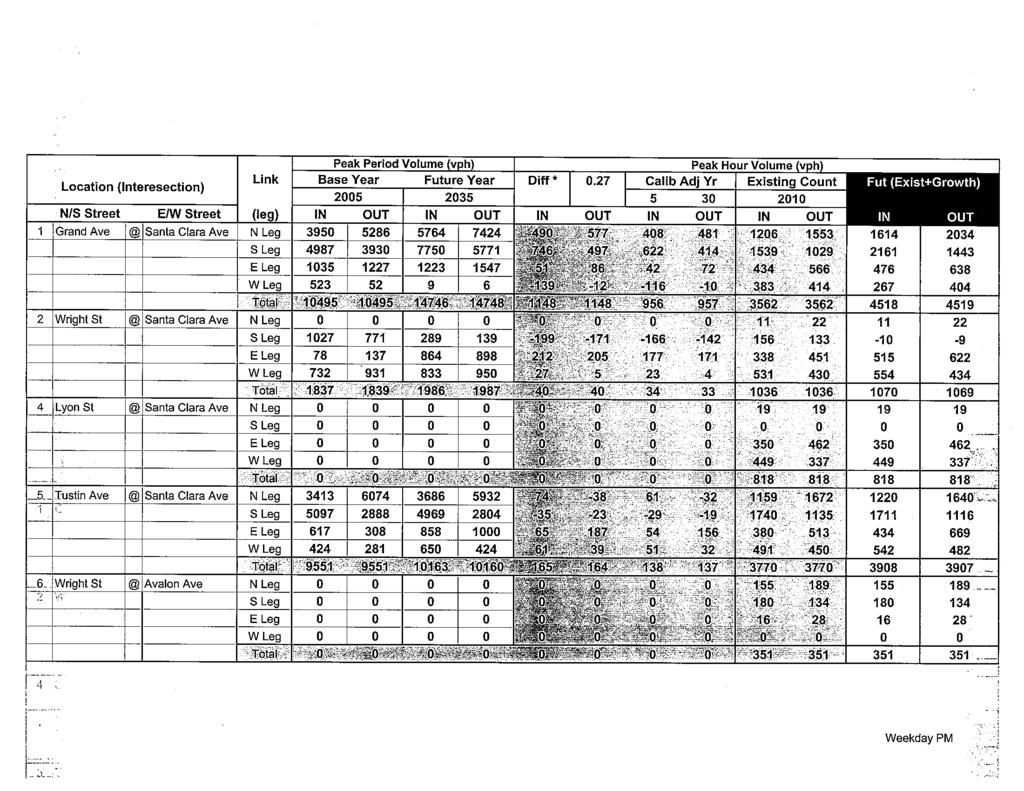
149
APPENDIX D. Traffic Impact Analysis
 APPENDIX D Traffic Impact Analysis TRAFFIC IMPACT ANALYSIS CALEXICO SOLAR FARM I County of Imperial, California July 8, 2011 LLG Ref. 3-11-2034 Prepared by: Cara Leone Transportation Planner II Under the
Traffic Impact Analysis
 LA PALMA VILLAGE INITIAL STUDY CITY OF ANAHEIM Appendices Appendix I Traffic Impact Analysis September 2015 LA PALMA VILLAGE INITIAL STUDY CITY OF ANAHEIM Appendices This page intentionally left blank.
Calipatria Solar Farm TIA
 Calipatria Solar Farm TIA Prepared for: 7SM 8ME, LLC 71SM 8ME, LLC c/o 8minutenergy Renewables LLC Prepared by: Fehr & Peers March 25, 211 IE1-37 TABLE OF CONTENTS Executive Summary... i Project Trip Estimates...
TRAFFIC IMPACT ANALYSIS. MIDWAY SOLAR FARM II County of Imperial, California January 11, 2011
 TRAFFIC IMPACT ANALYSIS MIDWAY SOLAR FARM II County of Imperial, California January 11, 2011 LLG Ref. 3-10-2013 Prepared by: Cara Leone Transportation Planner II Under the Supervision of: Chris Mendiara
Prepared for: Rocklin. Prepared by:
 APPENDIX L Sierra Gateway Apartments Transportation Impact Analysis Report Prepared for: Rocklin Sierra Apartments II, LLC Prepared by: SIERRA GATEWAY APARTMENTS TRANSPORTATION IMPACT ANALYSIS REPORT PREPARED
CITY OF KIRKLAND TRAFFIC IMPACT ANALYSIS GUIDELINES
 CITY OF KIRKLAND TRAFFIC IMPACT ANALYSIS GUIDELINES SEPA TRANSPORTATION CONCURRENCY - ROAD IMPACT FEES Introduction Revised February 2004 These guidelines describe how to prepare a traffic study, or Traffic
Traffic Impact Analysis Shotwell Road Residential Clayton, NC
 Shotwell Road Residential Clayton, NC TABLE O CONTENTS 1. INTROUCTION...1 1.1. Site Location and Study Area...1 1.2. Proposed Land Use and Site Access...2 1.3. Adjacent Land Uses...2 1.4. Existing Roadways...2
Appendix D. Transportation Study
 Appendix D Transportation Study Draft KUNZLER TERRACE MINE PROJECT Transportation Study Prepared for May 29 County of Mendocino Draft KUNZLER TERRACE MINE PROJECT Transportation Study Prepared for May
Traffic Impact Study for the Girard Winery Project
 October 16, 2014 Ms. Heather McCollister 1512 D Street Napa, CA 94559 Traffic Impact Study for the Girard Winery Project Dear Ms. McCollister; Whitlock & Weinberger Transportation, Inc. (W-Trans) has completed
An Assessment of Congestion in the Kansas City Region using the MARC Travel Demand Model
 An Assessment of Congestion in the Kansas City Region using the MARC Travel Demand Model The Congestion Management Process Federal Regulations state that all metropolitan planning organizations must carry
HILLTOP SENIOR LIVING CENTER Pollard Station Traffic Impact Analysis
 HILLTOP SENIOR LIVING CENTER Pollard Station Traffic Impact Analysis Prepared for Town of Truckee Prepared by TRANSPORTATION CONSULTANTS, INC. Pollard Station TRAFFIC IMPACT ANALYSIS Prepared for the Town
APPENDIX E TRANSPORTATION
 APPENDIX E TRANSPORTATION 2011 PATRON SURVEYS VISSIM MODEL CALIBRATION AND VALIDATION Environmental and Planning Consultants 440 Park Avenue South 7th Floor New York, NY 10016 tel: 212 696-0670 fax:
195 Hegenberger Road Hotel: Traffic Circulation Analysis in Response to Comments on the Final EIR
 350 Frank H. Ogawa Plaza Suite 300 Oakland, CA 94612 510.839.5066 phone 510.839.5825 fax www.esassoc.com Technical Memorandum date November 12, 2014 to from subject Colleen Liang, Port Associate Environmental
Traffic Impact Study for the Grove Street Subdivision
 Whitlock & Weinberger Transportation, Inc. 490 Mendocino Avenue Suite 201 Santa Rosa, CA 95401 voice (707) 542-9500 fax (707) 542-9590 475 14 th Street Suite 290 Oakland, CA 94612 voice (510) 444-2600
ENHANCED PARKWAY STUDY: PHASE 3 REFINED MLT INTERSECTION ANALYSIS
 ENHANCED PARKWAY STUDY: PHASE 3 REFINED MLT INTERSECTION ANALYSIS Final Report Prepared for Maricopa County Department of Transportation Prepared by TABLE OF CONTENTS Page EXECUTIVE SUMMARY ES-1 STUDY
TRACY HILLS SPECIFIC PLAN RECIRCULATED DRAFT SUBSEQUENT ENVIRONMENTAL IMPACT REPORT VOLUME III OCTOBER 2015
 TRACY HILLS SPECIFIC PLAN RECIRCULATED DRAFT SUBSEQUENT ENVIRONMENTAL IMPACT REPORT VOLUME III OCTOBER 2015 APPENDIX H-6B CORRESPONDENCE DOCUMENTS LIVERMORE, DATED FALL 2014 Chau, Elizabeth From: Sent:
APPENDIX I Traffic Impact Analysis
 APPENDIX I Traffic Impact Analysis Traffic Impact Analysis Collier Park Renovations Final Report Prepared for: 3570 Carmel Mountain Road Suite 300 San Diego, CA, 92130 8130 Allison Avenue La Mesa, CA
MEMORANDUM. Church of the Redeemer School Focused Transportation Impact Analysis
 MEMORANDUM Date: Februrary 2, 2016 To: From: Subject: Father Samer Youssef, Church of the Redeemer Sarah Jampole and Matt Haynes, Fehr & Peers Church of the Redeemer School Focused Transportation Impact
SIMULATION AND ANALYSIS OF ARTERIAL TRAFFIC OPERATIONS ALONG THE US 61 CORRIDOR IN BURLINGTON, IOWA FINAL REPORT
 SIMULATION AND ANALYSIS OF ARTERIAL TRAFFIC OPERATIONS ALONG THE US 61 CORRIDOR IN BURLINGTON, IOWA FINAL REPORT Principal Investigator Tom Maze Principal Contributor Ali Kamyab Sponsored by the Engineering
Integrating Travel Demand Management into the Long-Range Planning Process 2017 AMPO
 Integrating Travel Demand Management into the Long-Range Planning Process 2017 AMPO October 19, 2017 Chattanooga 2045 RTP Chattanooga 2045 RTP addresses both transportation supply and demand Continued
Speed Limit and Safety Nexus Studies for Automated Enforcement Locations in the District of Columbia East Capitol Street at Southern Avenue NE
 Speed Limit and Safety Nexus Studies for Automated Enforcement Locations in the District of Columbia East Capitol Street at Southern Avenue NE Study Area and Location District PSA Ward ANC Phase Description
Final Report. Interstate-680 Bus-on-Shoulder Feasibility Assessment. prepared for
 Final Report Interstate-680 Bus-on-Shoulder Feasibility Assessment prepared for Metropolitan Transportation Commission & Contra Costa Transportation Authority prepared by HDR in association with Fehr &
Study Area and Location District PSA Ward ANC Phase Description A Proposed 6100 Block Georgia Avenue Northwest Southbound
 Speed Limit and Safety Nexus Studies for Automated Enforcement Locations in the District of Columbia 6100 Block Georgia Avenue NW Study Area and Location District PSA Ward ANC Phase Description 4 402 4
Site 17 W3-160 KEY: District Department of Transportation 55 M Street, SE, Suite 400 Washington, DC 20003
 Speed Limit and Safety Nexus Studies for Automated Enforcement Locations in the District of Columbia Connecticut Avenue at Calvert Street NW Study Area and Location District PSA Ward ANC Phase Description
Study Area and Location District PSA Ward ANC Phase Description G Planned Connecticut Avenue Northbound at Military Road Northwest
 Speed Limit and Safety Nexus Studies for Automated Enforcement Locations in the District of Columbia Connecticut Avenue at Military Road NW Study Area and Location District PSA Ward ANC Phase Description
Addendum: Final Design Noise Analysis Study Noise Sensitive Area (NSA) 11 Post March 15, 2016 Open House Response to Comments
 11 Post March 15, 2016 Open House Response to Comments") Final Design Township of Lower Makefield, Bucks County, Pennsylvania Township of Ewing, Mercer County, New Jersey Addendum: Final Design Noise Analysis Study Noise Sensitive Area (NSA) 11 Post March 15,
Final Design Township of Lower Makefield, Bucks County, Pennsylvania Township of Ewing, Mercer County, New Jersey Addendum: Final Design Noise Analysis Study Noise Sensitive Area (NSA) 11 Post March 15,
National Roundabout Conference 2005 DRAFT High-Capacity Roundabout Intersection Analysis: Going Around in Circles David Stanek, PE & Ronald T. Milam,
 High-Capacity Roundabout Intersection Analysis: Going Around in Circles David Stanek, PE & Ronald T. Milam, AICP TRB National Roundabout Conference May 24, 2005 Vail, CO Presentation Overview What is a
GORE BUILDING. 238 N. Massachusetts Avenue, Lakeland, FL 33801
 GORE BUILDING 238 N. Massachusetts Avenue, Lakeland, FL 33801 CDB LOCATION REDEVELOPMENT PROJECT MUNN PARK HISTORIC DISTRICT INCENTIVES AVAILABLE ADJACENT PARKING INCLUDED BK698301 Phone: (863) 683-3425
Study Area and Location District PSA Ward ANC Phase Description G Proposed 2900 Block Military Road Northwest Eastbound
 Speed Limit and Safety Nexus Studies for Automated Enforcement Locations in the District of Columbia 29 Block Military Road NW E/B Study Area and Location District PSA Ward ANC Phase Description 2 21 3
Los Angeles County Metropolitan Transportation Authority (Metro) Arterial Performance Measures Framework
 Arterial Performance Measures Framework") Los Angeles County Metropolitan Transportation Authority (Metro) Arterial Performance Measures Framework Anita Vandervalk-Ostrander Iteris, Inc. Santa Ana, California, USA Steven Gota, Deputy Executive
Los Angeles County Metropolitan Transportation Authority (Metro) Arterial Performance Measures Framework Anita Vandervalk-Ostrander Iteris, Inc. Santa Ana, California, USA Steven Gota, Deputy Executive
ROADWAY LIGHTING CURFEW
 STATE OF RHODE ISLAND AND PROVIDENCE PLANTATIONS Rhode Island Department of Transportation ROADWAY LIGHTING CURFEW IMPLEMENTATION PLAN March 25, 21 TABLE OF CONTENTS INTRUDUCTION/OVERVIEW... 1 1.1. ANTICIPATED
Downtown Boise Multimodal Center
 Treasure Valley High Capacity Transit Study Downtown Boise Multimodal Center Environmental Assessment June 2009 Prepared by the Federal Transit Administration and Valley Regional Transit. U.S. Department
STUDY REPORT #1 ADDENDUM
 STUDY REPORT #1 ADDENDUM 1.0 PURPOSE OF ADDENDUM This document is an addendum to Study Report #1: Sub-System Planning Alternatives. The purpose of this addendum is to bridge the gap between the initial
Speed Limit and Safety Nexus Studies for Automated Enforcement Locations in the District of Columbia Inside Southern part of 3rd Street Tunnel
 Speed Limit and Safety Nexus Studies for Automated Enforcement Locations in the District of Columbia Inside Southern part of 3rd Street Tunnel Study Area and Location District PSA Ward ANC Phase Description
An Analysis of TDM Impacts on a Corridor Segment Research Findings
 An Analysis of TDM Impacts on a Corridor Segment Research Findings Phil Winters, CUTR TDM Program Director Liren Zhou, Graduate Research Assistant Sachin Rai, ITS Research Associate Nevine Georggi, TDM
Study Area and Location District PSA Ward ANC Phase Description B Planned Branch Avenue Northbound at Alabama Avenue Southeast
 Speed Limit and Safety Nexus Studies for Automated Enforcement Locations in the District of Columbia Branch Avenue at Alabama Avenue SE Study Area and Location District PSA Ward ANC Phase Description 6
Study Area and Location District PSA Ward ANC Phase Description C Existing 3500 Block Massachusetts Avenue Northwest Eastbound
 Speed Limit and Safety Nexus Studies for Automated Enforcement Locations in the District of Columbia 35 Block Massachusetts Avenue NW Study Area and Location District PSA Ward ANC Phase Description 2 24
Study Area and Location District PSA Ward ANC Phase Description D Proposed 1900 Block Foxhall Road Northwest Southbound
 Speed Limit and Safety Nexus Studies for Automated Enforcement Locations in the District of Columbia 19 Block Foxhall Road NW S/B Study Area and Location District PSA Ward ANC Phase Description 2 25 3
Executive Summary. City of Goodyear. Prepared for: Prepared by: November, 2008 Copyright 2008, Kimley-Horn and Associates, Inc.
 Goodyear Intelligent Transportation Systems Strategic Plan Executive Summary Prepared for: City of Goodyear Prepared by: 191376000 Copyright 2008, Kimley-Horn and Associates, Inc. I. INTRODUCTION The City
Appendix A Air Quality Construction Emissions Calculations
 Appendix A Air Quality Construction Emissions Calculations ES012007014SCO/POLBEDISONAVENEGDEC_BS2501.DOC/070290001 Appendix A POLB - Edison Avenue Construction Emissions Table 1. Construction Emissions
PROJECT TIMELINE. Next steps. Plan. Start of Service
 PROJECT TIMELINE 2018 2019 2020 2021 2022 2023 WE ARE HERE Plan Develop Build Develop design options for termini, station locations, and transit operations Conduct environmental research Assess funding
Using Empirical (real-world) Transportation Data to Extend Travel Demand Model Capabilities
 Transportation Data to Extend Travel Demand Model Capabilities") Portland State University PDXScholar TREC Friday Seminar Series Transportation Research and Education Center (TREC) 10-4-2013 Using Empirical (real-world) Transportation Data to Extend Travel Demand Model
Portland State University PDXScholar TREC Friday Seminar Series Transportation Research and Education Center (TREC) 10-4-2013 Using Empirical (real-world) Transportation Data to Extend Travel Demand Model
M50 Demand Management Study
 Study Briefing paper to the Strategic Policy Committees (Transport) of : Dun Laoghaire Rathdown County Council, Dublin City Council Fingal County Council South Dublin Co Council 5 th June 2013 December
Speed Limit and Safety Nexus Studies for Automated Enforcement Locations in the District of Columbia 1100 Block 4th Street NE
 Speed Limit and Safety Nexus Studies for Automated Enforcement Locations in the District of Columbia 11 Block 4th Street NE Study Area and Location District PSA Ward ANC Phase Description 1 14 6 6C Proposed
TRANSIT CENTER DISTRICT PLAN
 TRANSIT CENTER DISTRICT PLAN Informational Presentation Planning Commission 04.19.2012 San Francisco Planning Department In partnership with: San Francisco Redevelopment Agency Transbay Joint Powers Authority
Study Area and Location District PSA Ward ANC Phase Description A Proposed I-395 Southwest after Exit 4, Eastbound
 Speed Limit and Safety Nexus Studies for Automated Enforcement Locations in the District of Columbia I-395 SW after Exit 4 E/B Study Area and Location District PSA Ward ANC Phase Description 1 71 8 8A
THE SOUTHERN GATEWAY MANAGED LANES PROJECT. Public Meetings Summer 2015 June 23, June 25, July 7, July 9
 THE SOUTHERN GATEWAY MANAGED LANES PROJECT Public Meetings Summer 2015 June 23, June 25, July 7, July 9 History & Background Began in 2001 as a Major Investment Study (MIS), Schematic, and Environmental
County of Loudoun. Department of Planning and Zoning MEMORANDUM
 County of Loudoun Department of Planning and Zoning MEMORANDUM DATE: June 12, 2015 TO: FROM: Jacqueline Harlow, Project Manager Planner III, Land Use Review Kelly Williams, Planner III Community Planning
Facebook West Campus. Planning Commission Meeting February 25, 2013
 Facebook West Campus Planning Commission Meeting February 25, 2013 Meeting Purpose Review and make a recommendation to the City Council on the following items (Attachment C): Statement of Overriding Considerations
Crystal Springs Upland School Transportation Demand Management Plan. March 2016
 Crystal Springs Upland School Transportation Demand Management Plan March 06 CONTENTS Introduction... Transportation Demand Management (TDM) Program.... Background/Survey of Existing Student Commuting
Site 40. Recreational Center
 Speed Limit and Safety Nexus Studies for Automated Enforcement Locations in the District of Columbia Georgia Avenue S/B at Missouri Avenue NW Study Area and Location District PSA Ward ANC Phase Description
DESIGN CRITERIA MEMORANDUM
 State Route 49 Realignment Study DESIGN CRITERIA MEMORANDUM ATTACHMENT G SR 49 Realignment Study STATE ROUTE 49 El Dorado to Coloma El Dorado County, CA DESIGN CRITERIA MEMORANDUM Introduction The El
OR 217,I-5 Experience Portland, OR
 OR 217,I-5 Experience Portland, OR By: Abby Caringula Parsons Brinckerhoff July 8th, 2011 Presentation Outline Background VISUM Network Adjustment Model Origin-Destination(O-D) Demand Development ANM Export
ESTIMATING PARAMETERS FOR MODIFIED GREENSHIELD S MODEL AT FREEWAY SECTIONS FROM FIELD OBSERVATIONS
 0 ESTIMATING PARAMETERS FOR MODIFIED GREENSHIELD S MODEL AT FREEWAY SECTIONS FROM FIELD OBSERVATIONS Omor Sharif University of South Carolina Department of Civil and Environmental Engineering 00 Main Street
BOARD OF SUPERVISORS 2017 TRANSPORTATION SUMMIT INFORMATION ITEM
 BOARD OF SUPERVISORS 2017 TRANSPORTATION SUMMIT INFORMATION ITEM Date of Meeting: # 9 SUBJECT: ELECTION DISTRICTS: STAFF CONTACTS: Public and Private Infrastructure Improvements Adjacent to the Dulles
Managing DC Work Zones: DDOT s Citywide Transportation Management Plan
 Managing DC Work Zones: DDOT s Citywide Transportation Management Plan ARTBA National Work Zone Management Conference September 20, 2016 1 Outline Citywide Transportation Management Plan (TMP) Citywide
VTA s BART Silicon Valley Phase II Extension Project San Jose Downtown Association
 VTA s BART Silicon Valley Phase II Extension Project San Jose Downtown Association August 24, 2017 THANK YOU! San Jose Downtown Association for inviting us & San Jose First United Methodist Church for
Bluetooth Travel Time Technology Evaluation Using the BlueTOAD TM
 Bluetooth Travel Time Technology Evaluation Using the BlueTOAD TM E01271 PennDOT District 6-0 ITS & Support Open End Contract Work Order #1 Submitted To: Pennsylvania Department of Transportation Engineering
Study Area and Location District PSA Ward ANC Phase Description A Existing 1700 Block North Portal Drive Northwest Southwest-bound
 Speed Limit and Safety Nexus Studies for Automated Enforcement Locations in the District of Columbia 17 Block North Portal Drive NW Study Area and Location District PSA Ward ANC Phase Description 4 41
PUBLIC WORKS ORGANIZATIONAL CHART
 PUBLIC WORKS ORGANIZATIONAL CHART C-108 Actual 2012-13 Adopted Year-End Estimated 2014-15 2015-16 PROGRAM EXPENSES/REVENUES Salaries & Benefits $ 1,725,030 $ 1,855,980 $ 1,676,130 $ 1,956,510 $ 1,979,470
1.0 PURPOSE AND NEED
 1.0 PURPOSE AND NEED This chapter documents the need for transit improvements in the Northwest Corridor and the purposes that the proposed project is intended to serve. An overview of the study corridor
Bellevue s Traffic Adaptive Signals
 What we ll cover Bellevue s Traffic Adaptive Signals SCATS Phase 1 Implementation SCATS Operations Responsiveness New Features Some Initial Results 2011 Program and Beyond Final Thoughts ITE Quad Mtg April
Cedar Rapids ITS Deployment Project
 Cedar Rapids ITS Deployment Project Concept of Operations July 29, 2011 Table of Contents Section 1 Introduction Purpose Goal of ITS Deployments Section 2 Needs Assessment General Background Stakeholders
Appendix D Supportive Transportation Materials
 Appendix D Supportive Transportation Materials D.1. Stakeholder Input and Coordination As noted in Section 1.7 of the main Master Plan document, there have been several opportunities for stakeholders to
a. Co-Chairs will recap the work to date and explain the intent of the Downtown Access Strategy Update.
 TRANSPORTATION COMMITTEE DATE: Thursday, January 24, 2019 TIME: 12:00 p.m. 1:30 a.m. PLACE: Bellevue Downtown Association Fifth Floor Conference Room Co-Chairs: Amy Carlson & Susan Stead AGENDA 1. Welcome,
S-03-SegB: South Federal Way to Fife LRT
 Project Number S-03-SegB Subarea South King/Pierce Primary Mode Light Rail Facility Type Corridor Length 4.0 miles Version ST Board Workshop Date Last Modified 11-25-2015 PROJECT AREA AND REPRESENTATIVE
2011 Congestion Management Program Update
 PPLC Meeting 06/13/11 Agenda Item 4A Handout 2011 Congestion Management Program Update Presentation to PPLC June 13, 2011 Slide 1 2011 CMP Update Status Update Schedules, Issues, approach approved January
INTRODUCTION TO CUBE
 INTRODUCTION TO CUBE 1 WELCOME TO CUBE... 2 1.1 OVERVIEW... 2 1.2 THE ARCHITECTURE OF CUBE... 3 1.3 THE CUBE USER ENVIRONMENT... 5 1.4 INTEGRATION WITH ARCGIS... 7 1.5 INTEGRATION OF THE CUBE EXTENSIONS...
PROPOSED EXPANSION OF THE BOOYSENDAL SOUTH EVEREST MINE
 BOOYSENDAL PLATINUM (PTY) LTD TRAFFIC IMPACT STUDY (FEB 2017) REV 2 PROPOSED EXPANSION OF THE BOOYSENDAL SOUTH EVEREST MINE PREPARED BY: HAMATINO CONSULTING ENGINEERS 13 HOOGGELEGEN ROAD WHITE RIVER 1240
MARTA BOARD OF DIRECTORS OCTOBER 4, 2018
 MARTA BOARD OF DIRECTORS OCTOBER 4, 2018 TODAY S AGENDA o Key driver of the program o Recommended plan o Project summaries o Next steps 2 KEY DRIVER: PUBLIC INPUT o Atlanta City Design o Atlanta s Transportation
K. PUBLIC SERVICES K.1. POLICE PROTECTION
 K. PUBLIC SERVICES K.1. POLICE PROTECTION 1. INTRODUCTION This section addresses impacts on police protection services that would occur due to increased population, traffic, and construction activities
EXTENDING RED/PURPLE LINE REVENUE SERVICE TO EAST SIDE OF DOWNTOWN LOS ANGELES/ARTS DISTRICT
 16 One Gateway Plaza Los Angeles, CA 90012-2952 213.922.2000 Tel metro. net PLANNING AND PROGRAMMING COMMITTEE MARCH 18, 2015 SUBJECT: ACTION: EXTENDING RED/PURPLE LINE REVENUE SERVICE TO EAST SIDE OF
King County Ombudsman Whistle-Blowers Office Complaint
 King County Ombudsman Whistle-Blowers Office Complaint Filed by: Ho-Chuan Chen, Ph.D., P.E., Supervisor, Travel Forecasting and Data Management Group (TFDM) Hossein Barahimi, Transportation Planner III,
TRAFFIC CONCURRENCY INFORMATION
 PUBLIC WORKS DEPARTMENT 33325 8 th Avenue South Federal Way WA 98003-6325 253-835-2700; Fax 253-835-2709 www.cityoffederalway.com TRAFFIC CONCURRENCY INFORMATION What is a Concurrency Application? The
The Practical Side of Cell Phones as Traffic Probes
 The Practical Side of Cell Phones as Traffic Probes The information contained in this document is considered proprietary, and may not be reproduced or redistributed without the consent of Delcan Inc. Cell
ITS Canada Annual Conference and General Meeting. May 2013
 Evaluation of Travel Time Data Collection Technologies: An Innovative Approach for a Large- Scale Network ITS Canada Annual Conference and General Meeting May 2013 Study Steps Obtain the traffic data from
Building Success through Partnerships
 Building Success through Partnerships Washington APA Conference October 12, 2012 Vision Regional urban center Transit oriented district 5,000 new homes 25,000 new jobs Today Analysis of successful partnerships
IV.I.1 Police Protection
 1. INTRODUCTION This section of the Draft EIR discusses police protection within the project area. Sources of information used in the preparation of this section include: coordination with the Los Angeles
Variance Project Black Flag Attachments:
 Variance 15-01 Project Black Flag Attachments: 1. Locator 2. VAR 15-01 Staff report 3. Variance Exhibit 4. Applicant s Statement E Lookout Dr N Plano Rd 1402 E. Lookout Dr. N Greenville Ave Woodglen Dr
Managed Lane owner decision needed San Mateo County s options Understanding revenues & costs Pros & cons of County s options Proposed next steps
 San Mateo County Transportation Authority Meeting August 2, 2018 1 OVERVIEW Managed Lane owner decision needed San Mateo County s options Understanding revenues & costs Pros & cons of County s options
2017 STP PROJECT APPLICATION (OREGON)
") Project Title Section 1. Applicant Information Name of Lead Agency/ Organization Address Phone Number Name & Title of Contact Person Email Address Certified Local Public Agency (Yes/No) Section 2. Project
Project Title Section 1. Applicant Information Name of Lead Agency/ Organization Address Phone Number Name & Title of Contact Person Email Address Certified Local Public Agency (Yes/No) Section 2. Project
INDUSTRIAL LAND FOR SALE
 INDUSTRIAL LAND FOR SALE INDUSTRIAL LAND & DEVELOPMENT OPPORTUNITIES 150 ACRE INDUSTRIAL BUSINESS PARK LOTS RANGING FROM 5 150 ACRES Property Features Nexus at DIA provides a compelling opportunity for
APPENDIX G. VMT Spreadsheet Tool. FINAL REPORT Improved Data & Tools for Integrated Land Use-Transportation Planning in California TOPICS:
 FINAL REPORT Improved Data & Tools for Integrated Land Use-Transportation Planning in California APPENDIX G VMT Spreadsheet Tool TOPICS: 1. Overview of Tool 2. Code Documentation 3. User Guide 4. Validation
SITE DESCRIPTION. Vicinity
 SITE DESCRIPTION Vicinity The Montrose Shopping Center is located in the northeast quadrant of the intersection of Randolph Road and Rockville Pike (MD 355). The existing building (formally known as the
The Blue Line Extension
 The Blue Line Extension NORTH CAROLINA JOINT TRANSPORTATION OVERSIGHT COMMITTEE Presented by Carolyn Flowers CATS Chief Executive Officer Raleigh, NC February 10, 2012 Overview Charlotte Area Transit System
Proposed FY 06 Project Development Program and FY 05 Project Development Program Update
 Washington Metropolitan Area Transit Authority Proposed FY 06 Project Development Program and FY 05 Project Development Program Update Presented to the Board of Directors: P D E C Planning & Development
Central Corridor. - Central Corridor. Management Committee, Light Rail Transit. Rail-Volution - Weaving Transit into Existing Communities
 - Central Corridor Rail-Volution - Weaving Transit into Existing Communities Management Committee, October 31, 2009 June Improving 11, 2008 mobility Easing congestion Strengthening our communities Twin
Travel Demand Modeling and Project Coding Procedures
 Travel Demand Modeling and Project Coding Procedures Revised July 2008 As described in the Final Transportation Conformity Rule (section 93.122), travel demand models used to generate emission estimates
TURNING MOVEMENT CALCULATOR VERSION 3.0
 TURNING MOVEMENT CALCULATOR VERSION 3.0 User Guide February 23, 2008 Whitehouse Group Inc. For support: +1 (202) 241-2008 software@wgianalytics.com TABLE OF CONTENTS INTRODUCTION... 1 Features... 1 Benefits...
ROARING BROOK COMMUNITY INFORMATIONAL MEETING TACONIC STATE PARKWAY (TSP) AT PUDDING STREET INTERCHANGE
 AT PUDDING STREET INTERCHANGE") ROARING BROOK COMMUNITY INFORMATIONAL MEETING TACONIC STATE PARKWAY (TSP) AT PUDDING STREET INTERCHANGE Town of Putnam Valley, Putnam County February 7, 2018 1 2 MEETING AGENDA Introductions (5 minutes)
ROARING BROOK COMMUNITY INFORMATIONAL MEETING TACONIC STATE PARKWAY (TSP) AT PUDDING STREET INTERCHANGE Town of Putnam Valley, Putnam County February 7, 2018 1 2 MEETING AGENDA Introductions (5 minutes)
Kansas Division. January 31, 2018
 Division January 31, 6111 SW 29 th, Suite 100 Topeka, 66614 (785) 273-2600 (785) 273-2620 (fax) www.fhwa.dot.gov/ksdiv/index.htm Catherine M. Patrick, P.E. State Transportation Engineer Department of Transportation
IV. ENVIRONMENTAL IMPACT ANALYSIS J. PUBLIC SERVICES 1. FIRE PROTECTION
 IV. ENVIRONMENTAL IMPACT ANALYSIS J. PUBLIC SERVICES 1. FIRE PROTECTION INTRODUCTION This section evaluates the potential impacts of the Proposed Project on the fire and police protection services and
VTA s BART Silicon Valley Phase II Extension
 VTA s BART Silicon Valley Phase II Extension Alum Rock Community Working Group February 10, 2016 1 Agenda Follow-up Items and Work Plan Economic Analysis Surrounding BART Stations Nelson Nygaard San Jose
November 28, 2012 ALTERNATIVES ANALYSIS PUBLIC MEETING
 November 28, 2012 ALTERNATIVES ANALYSIS PUBLIC MEETING Project Background Description of the Project Alternatives Analysis Process Project Progress Activity Stations Comments Adjourn 2 VIA spent 2 years
APPENDIX A TDM Development Guideline
 Appendix A: TDM Development Guideline APPENDIX A TDM Development Guideline Appendix A: TDM Development Guideline Page A.1 1 INTRODUCTION AND OVERVIEW 1.1 About This Guideline This guideline contains information
ARLINGTON COUNTY, VIRGINIA
 ARLINGTON COUNTY, VIRGINIA County Board Agenda Item Meeting of December 12, 2015 DATE: December 1, 2015 SUBJECT: SP-84-U-15-1 USE PERMIT ASSOCIATED WITH A SITE PLAN for a telecommunications facility; located
SPEED SURVEY ANALYSIS SYSTEM
 SPEED SURVEY ANALYSIS SYSTEM user s manual CROSSROADS SOFTWARE 210 W. Birch Street, Suite 207 Brea, CA 92821 (714) 990-6433 Fax: (714) 990-5628 www.crossroadssoftware.com Chapter One: Introducing the Speed
Speed Limit and Safety Nexus Studies for Automated Enforcement Locations in the District of Columbia DC Miles South of Pennsylvania Avenue SE
 Speed Limit and Safety Nexus Studies for Automated Enforcement Locations in the District of Columbia DC 295.4 Miles South of Pennsylvania Avenue SE Study Area and Location District PSA Ward ANC Phase Description
Using GPS Based Origin-Destination Data to Improve Traffic Studies. Michael R. Wahlstedt, PE, PTOE OTEC October 11, 2017
 Using GPS Based Origin-Destination Data to Improve Traffic Studies Michael R. Wahlstedt, PE, PTOE OTEC October 11, 2017 Overview Benefits of using O-D data for traffic analysis, particularly for operational