Basic Medical Statistics Course
|
|
|
- Shannon Austin
- 6 years ago
- Views:
Transcription
 SPSS (40 min) Short break Exercise (60 min) This Afternoon During the course there will be several practicals.")
1 Basic Medical Statistics Course S0 SPSS Intro November 2013 Wilma Heemsbergen ~ Database (20 min) SPSS (40 min) Short break Exercise (60 min) This Afternoon During the course there will be several practicals. Answers will be provided afterwards, including SPSS syntax. 2

2 Research General research question Objective / hypothesis Study design Data collection Database Data analysis Discussion / conclusions A valid data analysis can only take place when all the previous steps were performed adequately 3 Database Example 4
3 Types of data Type Continous Categorical - binary -ordinal - nominal Text Date Example Age Treatment Arm T stage Hospital Remarks Date of Birth 5 Types of data: special cases Identifiers. A unique code / number to identify an individual patient. Key variable (for merging data, patient file research, etc ). Censored data. Most common is right-censored: event will occur, but we do not know when, e.g. death. Interval-censored: the event occurred in a certain time interval, but we do not know exactly when. Derived data. E.g.: age at start of treatment, derived from birth date and treatment date. Imputed data. A way of handling missing data. E.g. estimation of start treatment, based on blood values. Missing data. Missing data are often coded as missing. Beware of these values when you start analyzing data (e.g. 99 = missing). 6
4 Date and Time Variables To calculate the time between two dates, you can subtract dates from each other. E.g.: (date start therapy) (birth date) = (age at start therapy). Beware of the unit of the calculated age. In SPSS, it will be calculated in seconds (using the option compute ). Age at start (in days) = ( (date start) (birth date) ) / ( 60*60*24) Age at start (in years) = ( (date start) (birth date) ) / ( 60*60*24*365.25) SPSS also contains a date and time wizard, in which you can indicate the desired unit for calculations. 7 Code / Labels Two or more categories (not ordinal) Two: male, female 1, 2 or 0,1 More: Hospital A, B, C, D Whatever is convenient e.g. 1,2,3,4 or 11,17,22,33 Categories, ordinal Age: <40,40-60,>60 1, 2, 3 Risk factor: present, not present Prior surgery: yes, no 1, 0 8
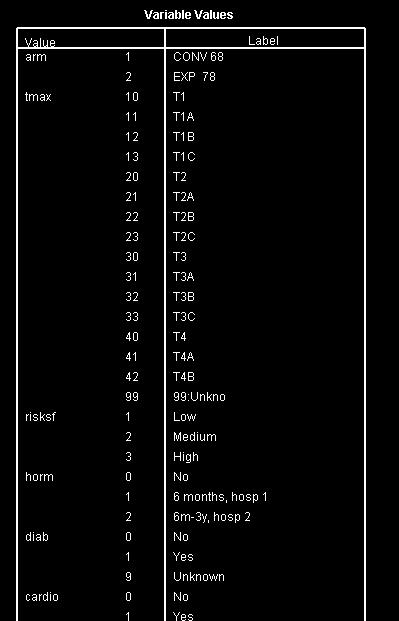
5 Building a Database - Keep a short paper file per patient (study forms). - Enter original data preferably in a database environment (not Excel). - Construct a code book (next slide). - Keep your original data well-organized. - Save + backup original data, apart from derived data. - Include in your data file name: date, version, ref to study. - Use a text field to comment (and update) for every patient (e.g.: emigrated, lost to follow-up, no visit at 2 years follow-up ) - Check and double-check the data. 9 Code Book Define each variable (previous to data entry) in a code book: name of variables, type (e.g. numerical, text, date), length, decimals, labels / extended variable name (e.g. date of diagnosis in referring hospital ), values (e.g. 1=male, 2=female), missing values: list of defined missing values (e.g. 99=unknown). The code book can also be used to construct an electronic data form for data entry (to minimize errors). Variable names should be reasonably short + well-organized, also to avoid problems when exported to other programs. 10
: E.g. stop date must be between x and y weeks after start date.")
6 Electronic Data Form Example of simple data entry form in ACCESS 11 Error Checking Range/outliers: are outliers true values, or errors? Missings: are missing values really missing? Dates: are dates within the expected range? Queries (logical rules): E.g. stop date must be between x and y weeks after start date. 12
7 Describing continuous data - Descriptives (mean, sd, range, percentiles, min, max, ) - Histogram (distribution of data) - Box plot (range / variation, outliers) - Stem-and-Leaf plot (range, outliers, exact values) - Scatter (2 continuous variables) 13 Describing categ/ordinal data Data can be described in absolute values (numbers) and/or in relative values (%). Data can be described with or without missing values. - Frequency tables - Crosstabs (at least 2 variables) - Graphs: bars, pie charts, 14
8 Handling & Describing Data in SPSS SPSS - SPSS windows: Data, Variables, Output, Syntax. - Import / export data, output files, syntax files. - Transform data (compute, recode,...). - Describing data (tables, graphs, ). SPSS can import/export other formats (e.g. excel). 16


. *.dbf, *.")
9 Windows in SPSS Open windows are shown in the tab Windows To open new windows (data, syntax, output), go to (menu): File new 17 Import Data in SPSS Using the paste button, corresponding syntax is pasted (ready to run). *.dbf, *.xls, *txt,/ 18
. To run: (select and) hit the run button. GET FILE='U:\data_statcursus\trial_rt.sav'. DATASET NAME DataSet1 WINDOW=FRONT.")
10 Menu: file open - data Get Data Use the paste button to get the syntax in the syntax window It is also possible to start with opening a syntax file, which will read / open the data (without using the menu). To run: (select and) hit the run button. GET FILE='U:\data_statcursus\trial_rt.sav'. DATASET NAME DataSet1 WINDOW=FRONT. 19 Variable View 20 21

11 Data File Information 21 Data File Information 22


12 Compute Menu: transform - compute DATASET ACTIVATE DataSet1. COMPUTE duur_rt=tend - tstart. EXECUTE. 23 Displaying Data (Graph) 24


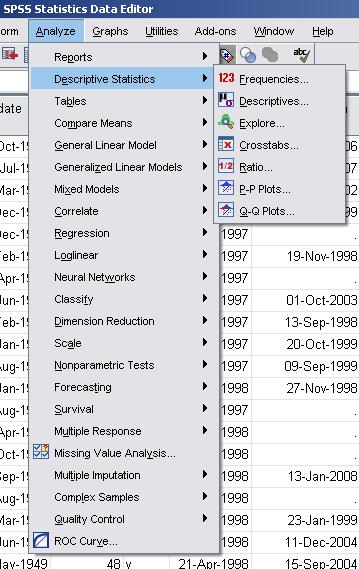
13 Histogram Menu: Graphs - Legacy dialogs - Histogram GRAPH /HISTOGRAM=duur_rt. 25 Reports, Describing 26

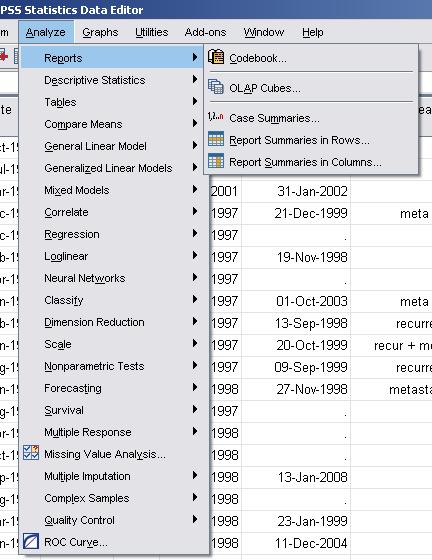
14 Case Summaries Menu: analyse reports case summaries overview, error checking, summary 27 Descriptives Menu: analyse - descriptive statistics - descriptives DESCRIPTIVES VARIABLES=age /STATISTICS=MEAN STDDEV MIN MAX. 28


 INTO age70.")
15 Recode Menu: transform - recode RECODE age (45 thru 69.99=0) (70 thru 90=1) INTO age70. EXECUTE. 29 Syntax 30
16 Data List Free Analyzing data without creating a data table first: data list free / naam1, naam 2, n. begin data end data. weight by n. 31 Other Options (exercise) 32


17 Merge Data Menu: Data Merge Files Add Cases / Add Variables 33 Split File / Selection Cases Menu: Data - Split File Data - Select Cases 34


18 35 Save Subset There is a possibility to save a subset of the variables: save as, option variables Menu: Data Save as 36
19 Crosstabs Menu: Analyse - Descriptive statistics - Crosstabs Explore Menu: Analyse - Descriptive statistics - Explore 38 39

 39 40 + stem-and-leaf plot + boxplot in")
20 Explore: factor (by group) Menu: analyse - descriptive statistics - explore EXAMINE VARIABLES=age BY arm /PLOT BOXPLOT STEMLEAF /COMPARE GROUPS /STATISTICS DESCRIPTIVES /CINTERVAL 95 /MISSING LISTWISE /NOTOTAL. (= default, you can change it) stem-and-leaf plot + boxplot in output 40 41
21 Stem-and-Leaf A Stem-and-Leaf diagram is a special type of histogram. First: stem and leaf must be defined. Example Data: 23, 26, 26, 27, 28, 30, 31, 45, 45, 45 Typically, a Stem-and-Leaf plot looks then like this (with stem unit of 10 and leaf unit of 1) (stem = 2, leafs are ) SPSS: a Stem-and-Leaf plot is generated when the option explore is used (descriptive statistics) Box Plot Visualizes: - distribution (normal? skew?) - full range of variation - outliers SPSS: a Box plot is generated when the option explore is used (descriptive statistics)
 - display")

22 Scatter Menu: Graphs Legacy Dialogs Scatter/Dot Pie Chart & Freq Table Variable: cause of death (COD) - display missing data, or not? - numbers or %? Menu: Graphs Legacy Dialogs Pie Charts (option: summaries for groups of cases) 44 45
23 SPSS Help There are helpful SPSS manuals / guides available at the internet (english) (english) (dutch) SPSS has an extensive Help Function. Demo on youtube about types of data : 45
Basic Medical Statistics Course
 Basic Medical Statistics Course S0 SPSS Intro December 2014 Wilma Heemsbergen w.heemsbergen@nki.nl This Afternoon 13.00 ~ 15.00 SPSS lecture Short break Exercise 2 Database Example 3 Types of data Type
Brief Guide on Using SPSS 10.0
 Brief Guide on Using SPSS 10.0 (Use student data, 22 cases, studentp.dat in Dr. Chang s Data Directory Page) (Page address: http://www.cis.ysu.edu/~chang/stat/) I. Processing File and Data To open a new
IBMSPSSSTATL1P: IBM SPSS Statistics Level 1
 SPSS IBMSPSSSTATL1P IBMSPSSSTATL1P: IBM SPSS Statistics Level 1 Version: 4.4 QUESTION NO: 1 Which statement concerning IBM SPSS Statistics application windows is correct? A. At least one Data Editor window
Research Methods for Business and Management. Session 8a- Analyzing Quantitative Data- using SPSS 16 Andre Samuel
 Research Methods for Business and Management Session 8a- Analyzing Quantitative Data- using SPSS 16 Andre Samuel A Simple Example- Gym Purpose of Questionnaire- to determine the participants involvement
SPSS. (Statistical Packages for the Social Sciences)
") Inger Persson SPSS (Statistical Packages for the Social Sciences) SHORT INSTRUCTIONS This presentation contains only relatively short instructions on how to perform basic statistical calculations in SPSS.
Inger Persson SPSS (Statistical Packages for the Social Sciences) SHORT INSTRUCTIONS This presentation contains only relatively short instructions on how to perform basic statistical calculations in SPSS.
Crash Course in Statistics
 Neuroscience Center Zurich Crash Course in Statistics Introduction to SPSS July 2014 Dr. Jürg Schwarz juerg.schwarz@schwarzpartners.ch Slide 2 Program 8 July 2014: Morning Lessons (09.00 12.00) First Part
Select Cases. Select Cases GRAPHS. The Select Cases command excludes from further. selection criteria. Select Use filter variables
 Select Cases GRAPHS The Select Cases command excludes from further analysis all those cases that do not meet specified selection criteria. Select Cases For a subset of the datafile, use Select Cases. In
1. Basic Steps for Data Analysis Data Editor. 2.4.To create a new SPSS file
 1 SPSS Guide 2009 Content 1. Basic Steps for Data Analysis. 3 2. Data Editor. 2.4.To create a new SPSS file 3 4 3. Data Analysis/ Frequencies. 5 4. Recoding the variable into classes.. 5 5. Data Analysis/
Intermediate SPSS. If you have an SPSS dataset (*.sav), you can open it in the following way:
, you can open it in the following way:") Center for Teaching, Research & Learning Research Support Group at the Social Science Research lab American University, Washington, D.C. http://www.american.edu/provost/ctrl/ 202-885-3862 Intermediate
Center for Teaching, Research & Learning Research Support Group at the Social Science Research lab American University, Washington, D.C. http://www.american.edu/provost/ctrl/ 202-885-3862 Intermediate
SPSS QM II. SPSS Manual Quantitative methods II (7.5hp) SHORT INSTRUCTIONS BE CAREFUL
 SHORT INSTRUCTIONS BE CAREFUL") SPSS QM II SHORT INSTRUCTIONS This presentation contains only relatively short instructions on how to perform some statistical analyses in SPSS. Details around a certain function/analysis method not covered
SPSS QM II SHORT INSTRUCTIONS This presentation contains only relatively short instructions on how to perform some statistical analyses in SPSS. Details around a certain function/analysis method not covered
MHPE 494: Data Analysis. Welcome! The Analytic Process
 MHPE 494: Data Analysis Alan Schwartz, PhD Department of Medical Education Memoona Hasnain,, MD, PhD, MHPE Department of Family Medicine College of Medicine University of Illinois at Chicago Welcome! Your
Dr Wan Nor Arifin Unit of Biostatistics and Research Methodology, Universiti Sains Malaysia.
 Introduction to SPSS Dr Wan Nor Arifin Unit of Biostatistics and Research Methodology, Universiti Sains Malaysia. wnarifin@usm.my Outlines Introduction Data Editor Data View Variable View Menus Shortcut
Applied Regression Modeling: A Business Approach
 i Applied Regression Modeling: A Business Approach Computer software help: SPSS SPSS (originally Statistical Package for the Social Sciences ) is a commercial statistical software package with an easy-to-use
Opening a Data File in SPSS. Defining Variables in SPSS
 Opening a Data File in SPSS To open an existing SPSS file: 1. Click File Open Data. Go to the appropriate directory and find the name of the appropriate file. SPSS defaults to opening SPSS data files with
Introduction (SPSS) Opening SPSS Start All Programs SPSS Inc SPSS 21. SPSS Menus
 Opening SPSS Start All Programs SPSS Inc SPSS 21. SPSS Menus") Introduction (SPSS) SPSS is the acronym of Statistical Package for the Social Sciences. SPSS is one of the most popular statistical packages which can perform highly complex data manipulation and analysis
Introduction (SPSS) SPSS is the acronym of Statistical Package for the Social Sciences. SPSS is one of the most popular statistical packages which can perform highly complex data manipulation and analysis
User Services Spring 2008 OBJECTIVES Introduction Getting Help Instructors
 User Services Spring 2008 OBJECTIVES Use the Data Editor of SPSS 15.0 to to import data. Recode existing variables and compute new variables Use SPSS utilities and options Conduct basic statistical tests.
Statistical Analysis Using SPSS for Windows Getting Started (Ver. 2018/10/30) The numbers of figures in the SPSS_screenshot.pptx are shown in red.
 The numbers of figures in the SPSS_screenshot.pptx are shown in red.") Statistical Analysis Using SPSS for Windows Getting Started (Ver. 2018/10/30) The numbers of figures in the SPSS_screenshot.pptx are shown in red. 1. How to display English messages from IBM SPSS Statistics
Statistical Analysis Using SPSS for Windows Getting Started (Ver. 2018/10/30) The numbers of figures in the SPSS_screenshot.pptx are shown in red. 1. How to display English messages from IBM SPSS Statistics
Digital literacy training
 Digital literacy training SPSS Introduction 2018 ANU Library anulib.anu.edu.au/training digital.literacy@anu.edu.au Table of Contents To start SPSS... 1 Import Excel files... 1 The Data View window...
IENG484 Quality Engineering Lab 1 RESEARCH ASSISTANT SHADI BOLOUKIFAR
 IENG484 Quality Engineering Lab 1 RESEARCH ASSISTANT SHADI BOLOUKIFAR SPSS (Statistical package for social science) Originally is acronym of Statistical Package for the Social Science but, now it stands
Applied Regression Modeling: A Business Approach
 i Applied Regression Modeling: A Business Approach Computer software help: SAS SAS (originally Statistical Analysis Software ) is a commercial statistical software package based on a powerful programming
Surviving SPSS.
 Surviving SPSS http://dataservices.gmu.edu/workshops/spss http://dataservices.gmu.edu/software/spss Debby Kermer George Mason University Libraries Data Services Research Consultant Mason Data Services
SPSS for Survey Analysis
 STC: SPSS for Survey Analysis 1 SPSS for Survey Analysis STC: SPSS for Survey Analysis 2 SPSS for Surveys: Contents Background Information... 4 Opening and creating new documents... 5 Starting SPSS...
TYPES OF VARIABLES, STRUCTURE OF DATASETS, AND BASIC STATA LAYOUT
 PRIMER FOR ACS OUTCOMES RESEARCH COURSE: TYPES OF VARIABLES, STRUCTURE OF DATASETS, AND BASIC STATA LAYOUT STEP 1: Install STATA statistical software. STEP 2: Read through this primer and complete the
Introductions Overview of SPSS
 Introductions Overview of SPSS Welcome to our SPSS tutorials. This first tutorial will provide a basic overview of the SPSS environment. We will be using SPSS version 22 for these tutorials, however, versions
The basic arrangement of numeric data is called an ARRAY. Array is the derived data from fundamental data Example :- To store marks of 50 student
 Organizing data Learning Outcome 1. make an array 2. divide the array into class intervals 3. describe the characteristics of a table 4. construct a frequency distribution table 5. constructing a composite
INTRODUCTION TO SPSS. Anne Schad Bergsaker 13. September 2018
 INTRODUCTION TO SPSS Anne Schad Bergsaker 13. September 2018 BEFORE WE BEGIN... LEARNING GOALS 1. Be familiar with and know how to navigate between the different windows in SPSS 2. Know how to write a
Statistical Package for the Social Sciences INTRODUCTION TO SPSS SPSS for Windows Version 16.0: Its first version in 1968 In 1975.
 Statistical Package for the Social Sciences INTRODUCTION TO SPSS SPSS for Windows Version 16.0: Its first version in 1968 In 1975. SPSS Statistics were designed INTRODUCTION TO SPSS Objective About the
2.1 Objectives. Math Chapter 2. Chapter 2. Variable. Categorical Variable EXPLORING DATA WITH GRAPHS AND NUMERICAL SUMMARIES
 EXPLORING DATA WITH GRAPHS AND NUMERICAL SUMMARIES Chapter 2 2.1 Objectives 2.1 What Are the Types of Data? www.managementscientist.org 1. Know the definitions of a. Variable b. Categorical versus quantitative
SPSS Statistics 19.0 Fix Pack 2 Fix List Release notes Abstract Content Number Description
 SPSS Statistics 19.0 Fix Pack 2 Fix List Release notes Abstract A comprehensive list of defect corrections for the SPSS Statistics 19.0 Fix Pack 2. Details of the fixes are listed below. If you have questions
- 1 - Fig. A5.1 Missing value analysis dialog box
 WEB APPENDIX Sarstedt, M. & Mooi, E. (2019). A concise guide to market research. The process, data, and methods using SPSS (3 rd ed.). Heidelberg: Springer. Missing Value Analysis and Multiple Imputation
BIOSTATISTICS LABORATORY PART 1: INTRODUCTION TO DATA ANALYIS WITH STATA: EXPLORING AND SUMMARIZING DATA
 BIOSTATISTICS LABORATORY PART 1: INTRODUCTION TO DATA ANALYIS WITH STATA: EXPLORING AND SUMMARIZING DATA Learning objectives: Getting data ready for analysis: 1) Learn several methods of exploring the
SPSS TRAINING SPSS VIEWS
 SPSS TRAINING SPSS VIEWS Dataset Data file Data View o Full data set, structured same as excel (variable = column name, row = record) Variable View o Provides details for each variable (column in Data
WELCOME! Lecture 3 Thommy Perlinger
 Quantitative Methods II WELCOME! Lecture 3 Thommy Perlinger Program Lecture 3 Cleaning and transforming data Graphical examination of the data Missing Values Graphical examination of the data It is important
AND NUMERICAL SUMMARIES. Chapter 2
 EXPLORING DATA WITH GRAPHS AND NUMERICAL SUMMARIES Chapter 2 2.1 What Are the Types of Data? 2.1 Objectives www.managementscientist.org 1. Know the definitions of a. Variable b. Categorical versus quantitative
Example how not to do it: JMP in a nutshell 1 HR, 17 Apr Subject Gender Condition Turn Reactiontime. A1 male filler
 JMP in a nutshell 1 HR, 17 Apr 2018 The software JMP Pro 14 is installed on the Macs of the Phonetics Institute. Private versions can be bought from
Surviving SPSS.
 Surviving SPSS http://dataservices.gmu.edu/workshops/spss http://dataservices.gmu.edu/software/spss Debby Kermer George Mason University Libraries Data Services Research Consultant Mason Data Services
13-FEB :53:53. /Users/yizheng/Dropbo x (ASU) /Work/Alias/ASU/Course /COE502/Labs/sample_ work/lab2/fl_student_s urvey_modified.
 /Work/Alias/ASU/Course /COE502/Labs/sample_ work/lab2/fl_student_s urvey_modified.") GET FILE='/Users/yizheng/Dropbox (ASU)/Work/Alias/ASU/Course/COE502/Labs/dataset s/fl_student_survey_modified.sav '. DATASET NAME DataSet1 WINDOW=FRONT. GET FILE='/Users/yizheng/Dropbox (ASU)/Work/Alias/ASU/Course/COE502/Labs/sample_
GET FILE='/Users/yizheng/Dropbox (ASU)/Work/Alias/ASU/Course/COE502/Labs/dataset s/fl_student_survey_modified.sav '. DATASET NAME DataSet1 WINDOW=FRONT. GET FILE='/Users/yizheng/Dropbox (ASU)/Work/Alias/ASU/Course/COE502/Labs/sample_
Frances Provan i #)# #%'
# #%'") !"#$%&#& Frances Provan i ##+), &'!#( $& #)# *% #%' & SPSS Versions... 2 Some slide shorthand... 2 Did you know you could... 2 Nice newish graphs... 2 Population Pyramids... 2 Population Pyramids: categories...
!"#$%&#& Frances Provan i ##+), &'!#( $& #)# *% #%' & SPSS Versions... 2 Some slide shorthand... 2 Did you know you could... 2 Nice newish graphs... 2 Population Pyramids... 2 Population Pyramids: categories...
Right-click on whatever it is you are trying to change Get help about the screen you are on Help Help Get help interpreting a table
 Q Cheat Sheets What to do when you cannot figure out how to use Q What to do when the data looks wrong Right-click on whatever it is you are trying to change Get help about the screen you are on Help Help
Introduction to SPSS Edward A. Greenberg, PhD
 Introduction to SPSS Edward A. Greenberg, PhD ASU HEALTH SOLUTIONS DATA LAB JANUARY 7, 2013 Files for this workshop Files can be downloaded from: http://www.public.asu.edu/~eagle/spss or (with less typing):
UNIT 4. Research Methods in Business
 UNIT 4 Preparing Data for Analysis:- After data are obtained through questionnaires, interviews, observation or through secondary sources, they need to be edited. The blank responses, if any have to be
LSP 121. LSP 121 Math and Tech Literacy II. Topics. Quartiles. Intro to Statistics. More Descriptive Statistics
 Greg Brewster, DePaul University Page 1 LSP 121 Math and Tech Literacy II More Descriptive Statistics Greg Brewster DePaul University Topics More Descriptive Statistics Quartiles Percentiles Categorical
Overview. Frequency Distributions. Chapter 2 Summarizing & Graphing Data. Descriptive Statistics. Inferential Statistics. Frequency Distribution
 Chapter 2 Summarizing & Graphing Data Slide 1 Overview Descriptive Statistics Slide 2 A) Overview B) Frequency Distributions C) Visualizing Data summarize or describe the important characteristics of a
CHAPTER 1. Introduction. Statistics: Statistics is the science of collecting, organizing, analyzing, presenting and interpreting data.
 1 CHAPTER 1 Introduction Statistics: Statistics is the science of collecting, organizing, analyzing, presenting and interpreting data. Variable: Any characteristic of a person or thing that can be expressed
Preparing for Data Analysis
 Preparing for Data Analysis Prof. Andrew Stokes March 27, 2018 Managing your data Entering the data into a database Reading the data into a statistical computing package Checking the data for errors and
3 Graphical Displays of Data
 3 Graphical Displays of Data Reading: SW Chapter 2, Sections 1-6 Summarizing and Displaying Qualitative Data The data below are from a study of thyroid cancer, using NMTR data. The investigators looked
Tabular & Graphical Presentation of data
 Tabular & Graphical Presentation of data bjectives: To know how to make frequency distributions and its importance To know different terminology in frequency distribution table To learn different graphs/diagrams
Spell out your full name (first, middle and last)
") Spell out your full name (first, middle and last) Be ready to share the following counts: Number of letters in your full name. Number of vowels Number of consonants Section 2-1 Organizing Data After completing
Spell out your full name (first, middle and last) Be ready to share the following counts: Number of letters in your full name. Number of vowels Number of consonants Section 2-1 Organizing Data After completing
Acquisition Description Exploration Examination Understanding what data is collected. Characterizing properties of data.
 Summary Statistics Acquisition Description Exploration Examination what data is collected Characterizing properties of data. Exploring the data distribution(s). Identifying data quality problems. Selecting
Statistics Lecture 6. Looking at data one variable
 Statistics 111 - Lecture 6 Looking at data one variable Chapter 1.1 Moore, McCabe and Craig Probability vs. Statistics Probability 1. We know the distribution of the random variable (Normal, Binomial)
Special Review Section. Copyright 2014 Pearson Education, Inc.
 Special Review Section SRS-1--1 Special Review Section Chapter 1: The Where, Why, and How of Data Collection Chapter 2: Graphs, Charts, and Tables Describing Your Data Chapter 3: Describing Data Using
FREQUENCIES VARIABLES=CAT_MSDS /STATISTICS=STDDEV MINIMUM MAXIMUM MEAN MEDIAN MODE /ORDER=ANALYSIS.
 1. Uji Univariat FREQUENCIES VARIABLES=CAT_MSDS /STATISTICS=STDDEV MINIMUM MAXIMUM MEAN MEDIAN MODE /ORDER=ANALYSIS. Frequencies Notes Output Created 31-MAY-2017 20:53:29 Comments Input Data Active Dataset
Math 120 Introduction to Statistics Mr. Toner s Lecture Notes 3.1 Measures of Central Tendency
 Math 1 Introduction to Statistics Mr. Toner s Lecture Notes 3.1 Measures of Central Tendency lowest value + highest value midrange The word average: is very ambiguous and can actually refer to the mean,
This chapter will show how to organize data and then construct appropriate graphs to represent the data in a concise, easy-to-understand form.
 CHAPTER 2 Frequency Distributions and Graphs Objectives Organize data using frequency distributions. Represent data in frequency distributions graphically using histograms, frequency polygons, and ogives.
Statistical Methods. Instructor: Lingsong Zhang. Any questions, ask me during the office hour, or me, I will answer promptly.
 Statistical Methods Instructor: Lingsong Zhang 1 Issues before Class Statistical Methods Lingsong Zhang Office: Math 544 Email: lingsong@purdue.edu Phone: 765-494-7913 Office Hour: Monday 1:00 pm - 2:00
3 Graphical Displays of Data
 3 Graphical Displays of Data Reading: SW Chapter 2, Sections 1-6 Summarizing and Displaying Qualitative Data The data below are from a study of thyroid cancer, using NMTR data. The investigators looked
Quick Start Guide Jacob Stolk PhD Simone Stolk MPH November 2018
 Quick Start Guide Jacob Stolk PhD Simone Stolk MPH November 2018 Contents Introduction... 1 Start DIONE... 2 Load Data... 3 Missing Values... 5 Explore Data... 6 One Variable... 6 Two Variables... 7 All
STA 570 Spring Lecture 5 Tuesday, Feb 1
 STA 570 Spring 2011 Lecture 5 Tuesday, Feb 1 Descriptive Statistics Summarizing Univariate Data o Standard Deviation, Empirical Rule, IQR o Boxplots Summarizing Bivariate Data o Contingency Tables o Row
At the end of the chapter, you will learn to: Present data in textual form. Construct different types of table and graphs
 DATA PRESENTATION At the end of the chapter, you will learn to: Present data in textual form Construct different types of table and graphs Identify the characteristics of a good table and graph Identify
Univariate Statistics Summary
 Further Maths Univariate Statistics Summary Types of Data Data can be classified as categorical or numerical. Categorical data are observations or records that are arranged according to category. For example:
Visualizing Data: Freq. Tables, Histograms
 Visualizing Data: Freq. Tables, Histograms Engineering Statistics Section 1.2 Josh Engwer TTU 25 January 2016 Josh Engwer (TTU) Visualizing Data: Freq. Tables, Histograms 25 January 2016 1 / 23 Descriptive
Chapter 6: DESCRIPTIVE STATISTICS
 Chapter 6: DESCRIPTIVE STATISTICS Random Sampling Numerical Summaries Stem-n-Leaf plots Histograms, and Box plots Time Sequence Plots Normal Probability Plots Sections 6-1 to 6-5, and 6-7 Random Sampling
Descriptive Statistics By
 Faculty of Medicine Epidemiology and Biostatistics الوبائيات واإلحصاء الحيوي (31505204) Lecture 3-5 Descriptive Statistics By Hatim Jaber MD MPH JBCM PhD 11+12-6-2017 1 Presentation outline 11-6-2017 Time
Ivy s Business Analytics Foundation Certification Details (Module I + II+ III + IV + V)
") Ivy s Business Analytics Foundation Certification Details (Module I + II+ III + IV + V) Based on Industry Cases, Live Exercises, & Industry Executed Projects Module (I) Analytics Essentials 81 hrs 1. Statistics
Ivy s Business Analytics Foundation Certification Details (Module I + II+ III + IV + V) Based on Industry Cases, Live Exercises, & Industry Executed Projects Module (I) Analytics Essentials 81 hrs 1. Statistics
CHAPTER 2 DESCRIPTIVE STATISTICS
 CHAPTER 2 DESCRIPTIVE STATISTICS 1. Stem-and-Leaf Graphs, Line Graphs, and Bar Graphs The distribution of data is how the data is spread or distributed over the range of the data values. This is one of
Preparing for Data Analysis
 Preparing for Data Analysis Prof. Andrew Stokes March 21, 2017 Managing your data Entering the data into a database Reading the data into a statistical computing package Checking the data for errors and
Maximizing Statistical Interactions Part II: Database Issues Provided by: The Biostatistics Collaboration Center (BCC) at Northwestern University
 at Northwestern University") Maximizing Statistical Interactions Part II: Database Issues Provided by: The Biostatistics Collaboration Center (BCC) at Northwestern University While your data tables or spreadsheets may look good to
Maximizing Statistical Interactions Part II: Database Issues Provided by: The Biostatistics Collaboration Center (BCC) at Northwestern University While your data tables or spreadsheets may look good to
PSS718 - Data Mining
 Lecture 5 - Hacettepe University October 23, 2016 Data Issues Improving the performance of a model To improve the performance of a model, we mostly improve the data Source additional data Clean up the
Data can be in the form of numbers, words, measurements, observations or even just descriptions of things.
 + What is Data? Data is a collection of facts. Data can be in the form of numbers, words, measurements, observations or even just descriptions of things. In most cases, data needs to be interpreted and
Organizing and Summarizing Data
 1 Organizing and Summarizing Data Key Definitions Frequency Distribution: This lists each category of data and how often they occur. : The percent of observations within the one of the categories. This
Chapter 2 Describing, Exploring, and Comparing Data
 Slide 1 Chapter 2 Describing, Exploring, and Comparing Data Slide 2 2-1 Overview 2-2 Frequency Distributions 2-3 Visualizing Data 2-4 Measures of Center 2-5 Measures of Variation 2-6 Measures of Relative
LAB 1 INSTRUCTIONS DESCRIBING AND DISPLAYING DATA
 LAB 1 INSTRUCTIONS DESCRIBING AND DISPLAYING DATA This lab will assist you in learning how to summarize and display categorical and quantitative data in StatCrunch. In particular, you will learn how to
STA 490H1S Initial Examination of Data
 Initial Examination of Data Alison L. Department of Statistics University of Toronto Winter 2011 Course mantra It s OK not to know. Expressing ignorance is encouraged. It s not OK to not have a willingness
MATH 117 Statistical Methods for Management I Chapter Two
 Jubail University College MATH 117 Statistical Methods for Management I Chapter Two There are a wide variety of ways to summarize, organize, and present data: I. Tables 1. Distribution Table (Categorical
1 Introduction. 1.1 What is Statistics?
 1 Introduction 1.1 What is Statistics? MATH1015 Biostatistics Week 1 Statistics is a scientific study of numerical data based on natural phenomena. It is also the science of collecting, organising, interpreting
12. A(n) is the number of times an item or number occurs in a data set.
 is the number of times an item or number occurs in a data set.") Chapter 15 Vocabulary Practice Match each definition to its corresponding term. a. data b. statistical question c. population d. sample e. data analysis f. parameter g. statistic h. survey i. experiment
Chapter 15 Vocabulary Practice Match each definition to its corresponding term. a. data b. statistical question c. population d. sample e. data analysis f. parameter g. statistic h. survey i. experiment
IAT 355 Visual Analytics. Data and Statistical Models. Lyn Bartram
 IAT 355 Visual Analytics Data and Statistical Models Lyn Bartram Exploring data Example: US Census People # of people in group Year # 1850 2000 (every decade) Age # 0 90+ Sex (Gender) # Male, female Marital
SPSS Instructions and Guidelines PSCI 2300 Intro to Political Science Research Dr. Paul Hensel Last updated 10 March 2018
 SPSS Instructions and Guidelines PSCI 2300 Intro to Political Science Research Dr. Paul Hensel Last updated 10 March 2018 Table of Contents Introduction... 1 Accessing SPSS... 2 Possible Alternative: PSPP...
DEPARTMENT OF HEALTH AND HUMAN SCIENCES HS900 RESEARCH METHODS
 DEPARTMENT OF HEALTH AND HUMAN SCIENCES HS900 RESEARCH METHODS Using SPSS Topics addressed today: 1. Accessing data from CMR 2. Starting SPSS 3. Getting familiar with SPSS 4. Entering data 5. Saving data
Creating a data file and entering data
 4 Creating a data file and entering data There are a number of stages in the process of setting up a data file and analysing the data. The flow chart shown on the next page outlines the main steps that
Can You Make A Box And Whisker Plot In Excel 2007
 Can You Make A Box And Whisker Plot In Excel 2007 The sheet is protected so that you can't accidentally change a formula, but Boxplots are quite difficult to do in Excel, see for example Box Plot and Whisker
Standard Safety Visualization Set-up Using Spotfire
 Paper SD08 Standard Safety Visualization Set-up Using Spotfire Michaela Mertes, F. Hoffmann-La Roche, Ltd., Basel, Switzerland ABSTRACT Stakeholders are requesting real-time access to clinical data to
SPSS: AN OVERVIEW. V.K. Bhatia Indian Agricultural Statistics Research Institute, New Delhi
 SPSS: AN OVERVIEW V.K. Bhatia Indian Agricultural Statistics Research Institute, New Delhi-110012 The abbreviation SPSS stands for Statistical Package for the Social Sciences and is a comprehensive system
Chapter2 Description of samples and populations. 2.1 Introduction.
 Chapter2 Description of samples and populations. 2.1 Introduction. Statistics=science of analyzing data. Information collected (data) is gathered in terms of variables (characteristics of a subject that
Using SPSS with The Fundamentals of Political Science Research
 Using SPSS with The Fundamentals of Political Science Research Paul M. Kellstedt and Guy D. Whitten Department of Political Science Texas A&M University c Paul M. Kellstedt and Guy D. Whitten 2009 Contents
Chapter 2: Descriptive Statistics
 Chapter 2: Descriptive Statistics Student Learning Outcomes By the end of this chapter, you should be able to: Display data graphically and interpret graphs: stemplots, histograms and boxplots. Recognize,
International Graduate School of Genetic and Molecular Epidemiology (GAME) Computing Notes and Introduction to Stata
 Computing Notes and Introduction to Stata") International Graduate School of Genetic and Molecular Epidemiology (GAME) Computing Notes and Introduction to Stata Paul Dickman September 2003 1 A brief introduction to Stata Starting the Stata program
International Graduate School of Genetic and Molecular Epidemiology (GAME) Computing Notes and Introduction to Stata Paul Dickman September 2003 1 A brief introduction to Stata Starting the Stata program
This document is designed to get you started with using R
 An Introduction to R This document is designed to get you started with using R We will learn about what R is and its advantages over other statistics packages the basics of R plotting data and graphs What
Mr. Kongmany Chaleunvong. GFMER - WHO - UNFPA - LAO PDR Training Course in Reproductive Health Research Vientiane, 22 October 2009
 Mr. Kongmany Chaleunvong GFMER - WHO - UNFPA - LAO PDR Training Course in Reproductive Health Research Vientiane, 22 October 2009 1 Object of the Course Introduction to SPSS The basics of managing data
Summarising Data. Mark Lunt 09/10/2018. Arthritis Research UK Epidemiology Unit University of Manchester
 Summarising Data Mark Lunt Arthritis Research UK Epidemiology Unit University of Manchester 09/10/2018 Summarising Data Today we will consider Different types of data Appropriate ways to summarise these
Software for glucose data management. Manual
 Software for glucose data management Manual Table of contents Fundamentals...2 Icons...3 Home Page...5 Data transfer...7 Print-outs...7 Import/Export...8 Patient...13 Glycaemia...16 List of results...16
INTRODUCTORY SPSS. Dr Feroz Mahomed Swalaha x2689
 INTRODUCTORY SPSS Dr Feroz Mahomed Swalaha fswalaha@dut.ac.za x2689 1 Statistics (the systematic collection and display of numerical data) is the most abused area of numeracy. 97% of statistics are made
Math 227 EXCEL / MEGASTAT Guide
 Math 227 EXCEL / MEGASTAT Guide Introduction Introduction: Ch2: Frequency Distributions and Graphs Construct Frequency Distributions and various types of graphs: Histograms, Polygons, Pie Charts, Stem-and-Leaf
Forfattere Intro to SPSS 19.0 Description
 Forfattere Nicholas Fritsche Rasmus Porsgaard Casper Voigt Rasmussen Martin Klint Hansen Morten Christoffersen Ulrick Tøttrup Niels Yding Sørensen Morten Mondrup Andreassen Jesper Pedersen Intro to SPSS
CS130 Software Tools. Fall 2010 Intro to SPSS and Data Handling
 Software Tools Intro to SPSS and Data Handling 1 Types of Analyses When doing data analysis, we are interested in two types of summaries: Statistical Summaries (e.g. descriptive, hypothesis testing) Visual
Introduction to Mplus
 Introduction to Mplus May 12, 2010 SPONSORED BY: Research Data Centre Population and Life Course Studies PLCS Interdisciplinary Development Initiative Piotr Wilk piotr.wilk@schulich.uwo.ca OVERVIEW Mplus
Introduction to StatsDirect, 15/03/2017 1
 INTRODUCTION TO STATSDIRECT PART 1... 2 INTRODUCTION... 2 Why Use StatsDirect... 2 ACCESSING STATSDIRECT FOR WINDOWS XP... 4 DATA ENTRY... 5 Missing Data... 6 Opening an Excel Workbook... 6 Moving around
QUESTION PORTOFOLIO FOR THE GRID TEST MVE
 1*Which of the following rules is not recommended when writing of a text in Microsoft Word: 0. Typing a space after a common punctuation mark; 1. Typing a space before a common punctuation mark; 2. Typing
Chapter 3: Data Description - Part 3. Homework: Exercises 1-21 odd, odd, odd, 107, 109, 118, 119, 120, odd
 Chapter 3: Data Description - Part 3 Read: Sections 1 through 5 pp 92-149 Work the following text examples: Section 3.2, 3-1 through 3-17 Section 3.3, 3-22 through 3.28, 3-42 through 3.82 Section 3.4,
Slides by. John Loucks. St. Edward s University. Slide South-Western, a part of Cengage Learning
 Slides by John Loucks St. Edward s University Slide 1 Chapter 2, Part B Descriptive Statistics: Tabular and Graphical Presentations Exploratory Data Analysis: Stem-and-Leaf Display Crosstabulations and