Big Data analytics and Visualization
|
|
|
- Edwina Richards
- 6 years ago
- Views:
Transcription
1 Big Data analytics and Visualization MTA Cloud symposium A. Agocs, D. Dardanis, R. Forster, J.-M. Le Goff, X. Ouvrard CERN MTA Head quarters, Budapest, 17 February
2 Background information Collaboration Spotting (CS) Platform (V2) used to process examples CS is a Visual Analytics tool originally developed to analyse the technology landscape of key enabling technologies for the Particle Physics programme at CERN Using Publications and Patent metadata The CS Platform has been used to visualize other datasets: CERN procurement data Ceased assets in collaborations with the UN-UNCRI Neuro-science data in collaboration with Wigner CS Platform V3 2
3 Characteristics of Big Data Huge quantity Processing and storage Distributed sources Access rights, security Complexity Interconnectivity Valuable information may be hidden behind complexity Unravelling new knowledge Data scientists are instrumental to analytics Domain experts are at the heart of the reasoning process 3
4 Big Data is organised in networks Big Data is distributed Document systems with metadata in Database Database tables with metadata in schema Big Data is strongly interconnected Connectivity not materialised due to the distributed nature of data sources Connectivity relates to the understanding of the data Technical challenges of using Big Data analytics 4

5 Big Data Intrinsic vs additional value The additional value of Big Data comes from its interconnectivity Discrete data Connected data Relational DBMS No-SQL Graph DB Conventional analytics Conventional + visual analytics Technical challenges of using Big Data analytics 5
6 Two Criteria: Bottom-up VS Top Down Discrete data VS highly interconnected data Technical challenges of using Big Data analytics 6


7 Top-Down VS Bottom-up Process driven Hypothesis Simulation software Validation with real data Review hypothesis Data driven Extract features from data Generate hypothesis Run what-if scenario Validate with data Experiments Compare results with simulation Typically hard sciences Big Data Software for domain expert to make sense out of Big Data Empirical approach Discrete data Connected data Relational DBMS No-SQL Graph DB Domain Expert Technical challenges of using Big Data Analytics 7


8 Domain expert vs Data scientist Domain expert Software developer Cycle is managed by Data Scientist Software developer Domain expert Source: JIOX: Intelligence Tradecraft & Analysis 8
9 Challenge Bring domain experts at the centre of the visual analytics cycle Experts have the knowledge Data scientists have the skills Bring analytics to experts Understand results of analytics Instruct computers to perform analytics according to findings Domain expert Data scientists to build platforms that enable experts to perform analytics by themselves 9
10 What is required? Network Data and Domain independent Scalable and flexible Easily accessible and navigable to Experts Enhance value of Data Network for Experts Support interconnectivity Support Cross Domain applications Smart Data management concepts and tools Support any combination of data sources Support any combination of data structures Support visualisation of network content Support visualisation of analysis results Smart graphic management concepts and tools Support navigation of network content Support queries of network content A Domain independent platform Technical challenges of using Big Data analytics 10
11 Smart Data Management Directed graphs are natural representations of large and interconnected datasets Complexity Interconnectivity Scalability Multi dimensional Schema is embedded in the data Nodes labels Compact graph structure Graph query language No schema evolution Graphs of connected elements constitute multi-dimensional networks Schema: labels and edges (interconnectivity) Labels Graph dimensions Edges Directed relationships between Labels Data graph: vertices and edges Vertices: data instances and dimension instances Edges: Directed relationships between vertices Graph Databases offer a natural support for storing network information Label property graph data model 11
12 Building a Network from two data sources (Pub/Pat) Document metadata Graph of data types SCat: Journal category, Kw: Keyword, Org: Organisation, Cny: Country, Tech: Technology Technical challenges of using Big Data analytics 12
13 Graph of Network T: Technologies, A: Pub/Pat, K: keywords, O: Organisations, C: Countries 13
14 Data Graph & Graph Schema Graph of data network Reachability Graph Technical challenges of using Big Data analytics 14

15 Building multi-dimensional networks File Systems Tables in DB Graphs in DB Processing/Populating/Labelling/Organising Multi-dimensional Network in GraphDB No limitations on the sixe of a network! Technical challenges of using Big Data analytics 15
16 Combining data sources Enriching networks More interconnectivity Data sources Publications/Patents Citations Institutions/Companies Data sources EU projects Financial data Geolocation data Schema: Graph of datatypes/labels Dimension: a datatype i.e. a node in the graph schema No limitations on the extension of the network s schema! 16
17 Smart Graphic Concepts and Management tools Graphs are excellent for visualising networks Retain complexity Singularities Clusters/communities/patterns Graphs contain many visual information Vertex label, shape, size and colour to visualise properties of datasets Edges colours to highlight clusters Visualisation enhances the perceptual reasoning potential of analytics 17
18 Smart Graphic Concepts and Management tools(2) Maximizing human understanding Selecting network dimensions Traversing network dimensions Graphical queries Time/Frequency evolution Enhancing reasoning Viewing multiple data sources Looking for collaborations Sorting communities Contextual visualisation & analytics Technical challenges of using Big Data analytics 18

 Technology Search: Czochralski Silicon wafer Pub/Pat: documents found in")
19 Selecting Visualisation dimensions (Tech) (Pub) (Pat) (SCat) (Kw) (Org) (Cny) Reference dimensions for Analytics Pub: Publications, Pat: Patents (Attributes: Title and abstract are used for semantic searches) Visualisation dimensions of Analytics results: SCat: Journal category, Kw: Keyword, Org: Organisation and Cny: Country) Technology Search: Czochralski Silicon wafer Pub/Pat: documents found in search results 19

 (SCat)")
")


20 Traversing Dimensions (Tech) (Pub) (Pat) (SCat) (Kw) (Org) (Cny) Technology Search: Czochralski Silicon wafer Pub/Pat: documents found in search results 20
21 How to scale up the graph approach for very large multidimensional networks? Technical challenges of using Big Data analytics 21
22 Visual analytics features Visual analytics does not replace Big Data analytics Visualize results Maintain visual perception quality and user interactivity No matter the size No matter the diversity (dimensions) No matter the interconnectivity Data sampling & filtering Visualize subsets of network dimensions View data from different perspectives Technical challenges of using Big Data analytics 22
23 Visual analytics Needs Visualize part of data network with respect to particular references and from different perspectives Reference: Data dimensions (labels) Perspective: Visual dimensions (labels) Need to navigate across visual dimensions => Visual queries Need to get contextual statistics In the context of a particular view Need to change Data Reference while navigating Queries adapted to change of reference Technical challenges of using Big Data analytics 23
24 Visual analytics Features (2) Structural vs Behavioural Understand from the data how something is working Visualization Maximum number of collaborations that can be processed (~100k) to feed visualization Maximum number of vertices and edges one can visualize within a graph (~ 10k) Maximum number of Clusters one can visualize within a graph (~10k) Data quality Can the data be trusted? How complete is the dataset under study? Technical challenges of using Big Data analytics 24
25 Visual analytics Needs(2) Need to visualize processes, interactions in addition to structure of data network Connectivity graphs AND Causality graphs directed edges For large graphs: Replace vertices with communities in complex graphs Compound graph approach For graphs built out of large collaborations Replace 2-adic calculations with m-adic Example Neuro science: paths of length 2 to visualize input/process/target flows Technical challenges of using Big Data analytics 25


26 Reduce visual complexity & faster graph processing: Hyperedges vs edges Organisation landscape graph view Organisation landscape hypergraph view Technology search: BGO Crystals Pub/Pat: documents found in search results Edges vs hyper-edges 26
27 Tailor visualisation to data STRATEGY: Combining various techniques to support quality visual perception and user interactions according to data and graph sizes Statistics Data sampling & Reduction Compound graphs 2-adic vs n-adic node-link graph representation Technical challenges of using Big Data analytics 27


28 Combining techniques for visualisation Visual Data Analysis: Compute Collaborations # collaborations too large? Yes No Community Processing: Compute clusters Can graph be layered? No Yes Yes # clusters too large? No No Visualize Data anyway? Yes Visual Data Analysis: Data Reduction/Sampling Community Processing: Compute Compound Graph Visual Data Analysis: Build statistics No # vertices too large Yes Visual Data Analysis: Filter/Reduce dataset Visual Analysis: Display Graph with vertices Visual Analysis: Display Graph with clusters as vertices Objective: Reduce dataset and graph content with very minimal loss in visual perception 28
29 Computing requirements for visualization Service users within a few seconds Heavy computing at the backend to process clusters, optimize layout and support visual navigation Need for Cloud computing Using machines with 4 CPU cores (8 threads), 8 GB of memory CPU vs GPU Comparing them using consumer level hardware (Intel Core i7, GeForce GTX 980) CS Platform V3 29
30 Computing requirements for visualization Computation on the CPU Graphs with tens of thousands of nodes and hundreds of thousands of edges, computing requires ~17 seconds. Further optimization can be achieved by further distributing the computation among multiple machines Computation on the GPU Same graphs compute ~8 times faster (~2 seconds) Distribution among multiple GPUs is a further possible optimization CS Platform V3 30
31 Runtime (s) Computing requirements for visualization 25 Computation time on CPU vs GPU CT 3D Database Silicon CPU GPU CS Platform V3 31
 g 2 :")
 *Data/slide: L. Négyessy, A.")
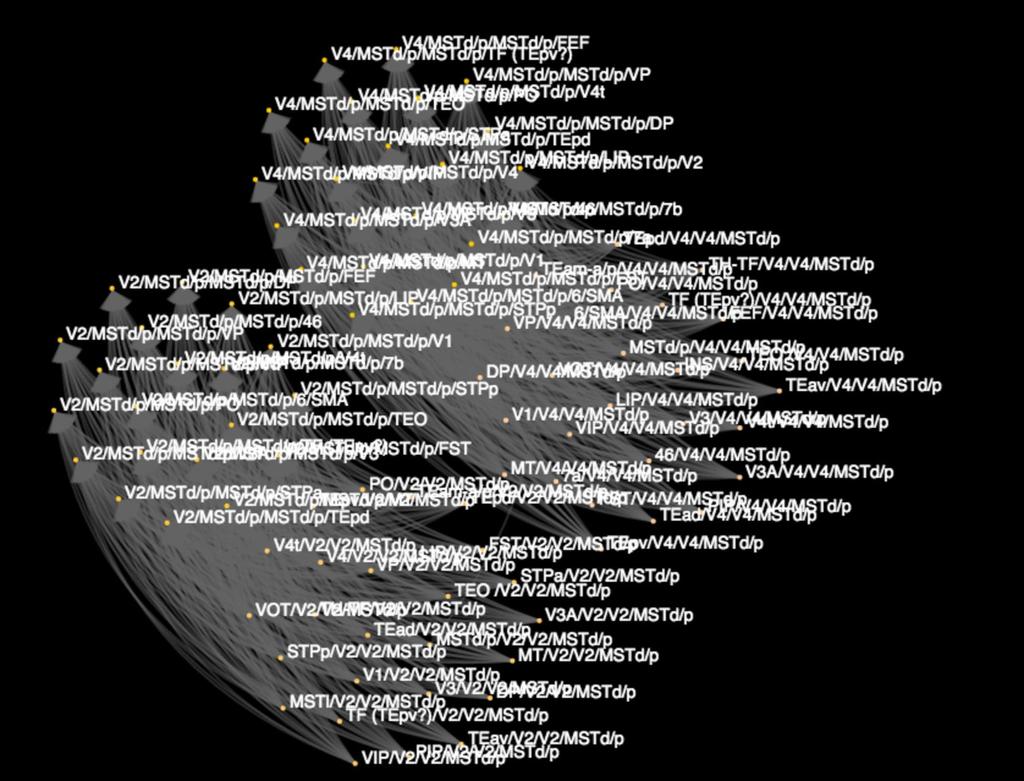
32 The macaque case g2 is too large for visual perception Communities 172 clusters edges g 0 : directed graph of brain area interconnectivity* (42 vertices = areas, 601 edges= interactions) g 2 : directed graph of cortical interactions* (Input/Processing/Target) (9869 vertices = IPT flows, edges = common interactions) *Data/slide: L. Négyessy, A. Fülöp Technical challenges of using Big Data analytics 32


33 Constructed Reachability Graph Brain Area Modality Target Area Processing Area Input Area Cerebral lobe L2_path ProcessType InterLobe g 0 edges g 2 edges g 2 g 0 connections Are type of processing and Interactive lobe - Vertex attributes? - Visual dimensions? Macaque brain network data: optimal for navigation 33

34 g 0 graph Technical Challenge of Using Big Data Analytics 34
 CS platform concepts")
35 g 2 (with intercluster edges) CS platform concepts V3 35

36 g 2 (paths of length 2 CS platform concepts V3 36

37 Community_61 Egocentric 37

38 Community_61 CS platform concepts V3 38
39 Community_61 39

40 CS platform concepts V3 40
41 Conclusion To visualize Big Data Analytics output you need: Graphs to store your data networks and their schema Graphs to view network structure through selected dimensions Graphs to navigate across dimensions to provide contextual data to visualisation tools To maintain visual perception you need to combine various techniques Statistics, sampling, compound graph, layered graph To support structural and behavioural visualisation you need to explore Clustering algorithms supporting directed edges Processes, interactions in relation with the data Technical challenges with Big Data Analysis 41
42 Thank you for your attention!
Enriching knowledge graphs with text processing techniques
 Enriching knowledge graphs with text processing techniques ERCIM News 111:https://ercim-news.ercim.eu/en111/r-i/collaboration-spotting-a-visual-analytics-platform-to-assist-knowledge-discovery J.-M. Le
Evolution of Database Systems
 Evolution of Database Systems Krzysztof Dembczyński Intelligent Decision Support Systems Laboratory (IDSS) Poznań University of Technology, Poland Intelligent Decision Support Systems Master studies, second
Exploring the Structure of Data at Scale. Rudy Agovic, PhD CEO & Chief Data Scientist at Reliancy January 16, 2019
 Exploring the Structure of Data at Scale Rudy Agovic, PhD CEO & Chief Data Scientist at Reliancy January 16, 2019 Outline Why exploration of large datasets matters Challenges in working with large data
Qlik. 10 key elements of a successful data strategy and modern analytics platform. February 2019 Julie Kae Executive Director, Qlik.
 Qlik 10 key elements of a successful data strategy and modern analytics platform February 2019 Julie Kae Executive Director, Qlik.org Legal Disclaimer Qlik roadmaps provide a general overview of our anticipated
Informatica Enterprise Information Catalog
 Data Sheet Informatica Enterprise Information Catalog Benefits Automatically catalog and classify all types of data across the enterprise using an AI-powered catalog Identify domains and entities with
Ontology and Hyper Graph Based Dashboards in Data Warehousing Systems
 Ontology and Hyper Graph Based Dashboards in Data Warehousing Systems Gitanjali.J #1, C Ranichandra #2, Meera Kuriakose #3, Revathi Kuruba #4 # School of Information Technology and Engineering, VIT University
Progress DataDirect For Business Intelligence And Analytics Vendors
 Progress DataDirect For Business Intelligence And Analytics Vendors DATA SHEET FEATURES: Direction connection to a variety of SaaS and on-premises data sources via Progress DataDirect Hybrid Data Pipeline
An Introduction to Big Data Formats
 Introduction to Big Data Formats 1 An Introduction to Big Data Formats Understanding Avro, Parquet, and ORC WHITE PAPER Introduction to Big Data Formats 2 TABLE OF TABLE OF CONTENTS CONTENTS INTRODUCTION
custinger - Supporting Dynamic Graph Algorithms for GPUs Oded Green & David Bader
 custinger - Supporting Dynamic Graph Algorithms for GPUs Oded Green & David Bader What we will see today The first dynamic graph data structure for the GPU. Scalable in size Supports the same functionality
Chapter 6. Foundations of Business Intelligence: Databases and Information Management VIDEO CASES
 Chapter 6 Foundations of Business Intelligence: Databases and Information Management VIDEO CASES Case 1a: City of Dubuque Uses Cloud Computing and Sensors to Build a Smarter, Sustainable City Case 1b:
An overview of Graph Categories and Graph Primitives
 An overview of Graph Categories and Graph Primitives Dino Ienco (dino.ienco@irstea.fr) https://sites.google.com/site/dinoienco/ Topics I m interested in: Graph Database and Graph Data Mining Social Network
High Performance Oracle Endeca Designs for Retail. Technical White Paper 24 June
 High Performance Oracle Endeca Designs for Retail Technical White Paper 24 June 2014 www.excogis.com Excogis - High Performance Oracle Endeca Designs for Retail Table of Contents 1 Executive Summary...
Abstract. The Challenges. ESG Lab Review InterSystems IRIS Data Platform: A Unified, Efficient Data Platform for Fast Business Insight
 ESG Lab Review InterSystems Data Platform: A Unified, Efficient Data Platform for Fast Business Insight Date: April 218 Author: Kerry Dolan, Senior IT Validation Analyst Abstract Enterprise Strategy Group
Analytics Fundamentals by Mark Peco
 Analytics Fundamentals by Mark Peco All rights reserved. Reproduction in whole or part prohibited except by written permission. Product and company names mentioned herein may be trademarks of their respective
Patent Image Retrieval
 Patent Image Retrieval Stefanos Vrochidis IRF Symposium 2008 Vienna, November 6, 2008 Aristotle University of Thessaloniki Overview 1. Introduction 2. Related Work in Patent Image Retrieval 3. Patent Image
The Definitive Guide to Preparing Your Data for Tableau
 The Definitive Guide to Preparing Your Data for Tableau Speed Your Time to Visualization If you re like most data analysts today, creating rich visualizations of your data is a critical step in the analytic
Welcome to the topic of SAP HANA modeling views.
 Welcome to the topic of SAP HANA modeling views. 1 At the end of this topic, you will be able to describe the three types of SAP HANA modeling views and use the SAP HANA Studio to work with views in the
What is Gluent? The Gluent Data Platform
 What is Gluent? The Gluent Data Platform The Gluent Data Platform provides a transparent data virtualization layer between traditional databases and modern data storage platforms, such as Hadoop, in the
BIG DATA INDUSTRY PAPER
 BIG DATA INDUSTRY PAPER Encryption Key Management INFORMATION-RICH BIG DATA IS UNDER INCREASING THREAT OF THEFT AND BUSINESS DISRUPTION. AS THE NETWORKS AND TECHNOLOGIES THAT ENABLE BIG DATA COLLECTION,
The Hadoop Paradigm & the Need for Dataset Management
 The Hadoop Paradigm & the Need for Dataset Management 1. Hadoop Adoption Hadoop is being adopted rapidly by many different types of enterprises and government entities and it is an extraordinarily complex
E6895 Advanced Big Data Analytics Lecture 4:
 E6895 Advanced Big Data Analytics Lecture 4: Data Store Ching-Yung Lin, Ph.D. Adjunct Professor, Dept. of Electrical Engineering and Computer Science Chief Scientist, Graph Computing, IBM Watson Research
Some Big Data Challenges
 Some Big Data Challenges 2,500,000,000,000,000,000 Bytes (2.5 x 10 18 ) of data are created every day! (2012) or 8,000,000,000,000,000,000 (8 exabytes) of new data were stored globally by enterprises in
OLAP Introduction and Overview
 1 CHAPTER 1 OLAP Introduction and Overview What Is OLAP? 1 Data Storage and Access 1 Benefits of OLAP 2 What Is a Cube? 2 Understanding the Cube Structure 3 What Is SAS OLAP Server? 3 About Cube Metadata
Securing Your Digital Transformation
 Securing Your Digital Transformation Security Consulting Managed Security Leveraging experienced, senior experts to help define and communicate risk and security program strategy using real-world data,
Built for Speed: Comparing Panoply and Amazon Redshift Rendering Performance Utilizing Tableau Visualizations
 Built for Speed: Comparing Panoply and Amazon Redshift Rendering Performance Utilizing Tableau Visualizations Table of contents Faster Visualizations from Data Warehouses 3 The Plan 4 The Criteria 4 Learning
Accelerate your SAS analytics to take the gold
 Accelerate your SAS analytics to take the gold A White Paper by Fuzzy Logix Whatever the nature of your business s analytics environment we are sure you are under increasing pressure to deliver more: more
HANA Performance. Efficient Speed and Scale-out for Real-time BI
 HANA Performance Efficient Speed and Scale-out for Real-time BI 1 HANA Performance: Efficient Speed and Scale-out for Real-time BI Introduction SAP HANA enables organizations to optimize their business
Oracle and Tangosol Acquisition Announcement
 Oracle and Tangosol Acquisition Announcement March 23, 2007 The following is intended to outline our general product direction. It is intended for information purposes only, and may
DATA FORMATS FOR DATA SCIENCE Remastered
 Budapest BI FORUM 2016 DATA FORMATS FOR DATA SCIENCE Remastered Valerio Maggio @leriomaggio Data Scientist and Researcher Fondazione Bruno Kessler (FBK) Trento, Italy WhoAmI Post Doc Researcher @ FBK Interested
Optimize Your Databases Using Foglight for Oracle s Performance Investigator
 Optimize Your Databases Using Foglight for Oracle s Performance Investigator Solve performance issues faster with deep SQL workload visibility and lock analytics Abstract Get all the information you need
Powering Knowledge Discovery. Insights from big data with Linguamatics I2E
 Powering Knowledge Discovery Insights from big data with Linguamatics I2E Gain actionable insights from unstructured data The world now generates an overwhelming amount of data, most of it written in natural
Construction Change Order analysis CPSC 533C Analysis Project
 Construction Change Order analysis CPSC 533C Analysis Project Presented by Chiu, Chao-Ying Department of Civil Engineering University of British Columbia Problems of Using Construction Data Hybrid of physical
Giovanni Lamanna LAPP - Laboratoire d'annecy-le-vieux de Physique des Particules, Université de Savoie, CNRS/IN2P3, Annecy-le-Vieux, France
 Giovanni Lamanna LAPP - Laboratoire d'annecy-le-vieux de Physique des Particules, Université de Savoie, CNRS/IN2P3, Annecy-le-Vieux, France ERF, Big data & Open data Brussels, 7-8 May 2014 EU-T0, Data
 dan.fay@microsoft.com Scientific Data Intensive Computing Workshop 2004 Visualizing and Experiencing E 3 Data + Information: Provide a unique experience to reduce time to insight and knowledge through
Technology In Action, Complete, 14e (Evans et al.) Chapter 11 Behind the Scenes: Databases and Information Systems
 Chapter 11 Behind the Scenes: Databases and Information Systems") Technology In Action, Complete, 14e (Evans et al.) Chapter 11 Behind the Scenes: Databases and Information Systems 1) A is a collection of related data that can be stored, sorted, organized, and queried.
Technology In Action, Complete, 14e (Evans et al.) Chapter 11 Behind the Scenes: Databases and Information Systems 1) A is a collection of related data that can be stored, sorted, organized, and queried.
This tutorial will help computer science graduates to understand the basic-to-advanced concepts related to data warehousing.
 About the Tutorial A data warehouse is constructed by integrating data from multiple heterogeneous sources. It supports analytical reporting, structured and/or ad hoc queries and decision making. This
Level 4 Diploma in Computing
 Level 4 Diploma in Computing 1 www.lsib.co.uk Objective of the qualification: It should available to everyone who is capable of reaching the required standards It should be free from any barriers that
Where do these data come from? What technologies do they use?? Whatever they use, they need models (schemas, metadata, )
") Week part 2: Database Applications and Technologies Data everywhere SQL Databases, Packaged applications Data warehouses, Groupware Internet databases, Data mining Object-relational databases, Scientific
Week part 2: Database Applications and Technologies Data everywhere SQL Databases, Packaged applications Data warehouses, Groupware Internet databases, Data mining Object-relational databases, Scientific
DB2 for z/os: Programmer Essentials for Designing, Building and Tuning
 Brett Elam bjelam@us.ibm.com - DB2 for z/os: Programmer Essentials for Designing, Building and Tuning April 4, 2013 DB2 for z/os: Programmer Essentials for Designing, Building and Tuning Information Management
GPU ACCELERATED DATABASE MANAGEMENT SYSTEMS
 CIS 601 - Graduate Seminar Presentation 1 GPU ACCELERATED DATABASE MANAGEMENT SYSTEMS PRESENTED BY HARINATH AMASA CSU ID: 2697292 What we will talk about.. Current problems GPU What are GPU Databases GPU
USC Viterbi School of Engineering
 Introduction to Computational Thinking and Data Science USC Viterbi School of Engineering http://www.datascience4all.org Term: Fall 2016 Time: Tues- Thur 10am- 11:50am Location: Allan Hancock Foundation
Data Mining Concepts & Techniques
 Data Mining Concepts & Techniques Lecture No. 01 Databases, Data warehouse Naeem Ahmed Email: naeemmahoto@gmail.com Department of Software Engineering Mehran Univeristy of Engineering and Technology Jamshoro
Chapter 3: Google Penguin, Panda, & Hummingbird
 Chapter 3: Google Penguin, Panda, & Hummingbird Search engine algorithms are based on a simple premise: searchers want an answer to their queries. For any search, there are hundreds or thousands of sites
QLIKVIEW ARCHITECTURAL OVERVIEW
 QLIKVIEW ARCHITECTURAL OVERVIEW A QlikView Technology White Paper Published: October, 2010 qlikview.com Table of Contents Making Sense of the QlikView Platform 3 Most BI Software Is Built on Old Technology
Basics of Data Management
 Basics of Data Management Chaitan Baru 2 2 Objectives of this Module Introduce concepts and technologies for managing structured, semistructured, unstructured data Obtain a grounding in traditional data
Feature Scope Description Document Version: CUSTOMER. SAP Analytics Hub. Software version 17.09
 Feature Scope Description Document Version: 2017-09-23 Software version 17.09 Typographic Conventions Type Style Example Description Words or characters quoted from the screen. These include field names,
Analytics Driven, Simple, Accurate and Actionable Cyber Security Solution CYBER ANALYTICS
 Analytics Driven, Simple, Accurate and Actionable Cyber Security Solution CYBER ANALYTICS Overview Cyberattacks are increasingly getting more frequent, more sophisticated and more widespread than ever
Inge Van Nieuwerburgh OpenAIRE NOAD Belgium. Tools&Services. OpenAIRE EUDAT. can be reused under the CC BY license
 Inge Van Nieuwerburgh OpenAIRE NOAD Belgium Tools&Services OpenAIRE EUDAT can be reused under the CC BY license Open Access Infrastructure for Research in Europe www.openaire.eu Research Data Services,
MAPR DATA GOVERNANCE WITHOUT COMPROMISE
 MAPR TECHNOLOGIES, INC. WHITE PAPER JANUARY 2018 MAPR DATA GOVERNANCE TABLE OF CONTENTS EXECUTIVE SUMMARY 3 BACKGROUND 4 MAPR DATA GOVERNANCE 5 CONCLUSION 7 EXECUTIVE SUMMARY The MapR DataOps Governance
Integrate MATLAB Analytics into Enterprise Applications
 Integrate Analytics into Enterprise Applications Lyamine Hedjazi 2015 The MathWorks, Inc. 1 Data Analytics Workflow Preprocessing Data Business Systems Build Algorithms Smart Connected Systems Take Decisions
At the heart of Europe s ICT ecosystem
 At the heart of Europe s ICT ecosystem Renato Lombardi VP of European Research Center A permanently connected World - where communication and information is merging into ICT 5G - era of Hyper Connectivity
Building a Data Strategy for a Digital World
 Building a Data Strategy for a Digital World Jason Hunter, CTO, APAC Data Challenge: Pushing the Limits of What's Possible The Art of the Possible Multiple Government Agencies Data Hub 100 s of Service
Microsoft Power BI for O365
 Microsoft Power BI for O365 Next hour.. o o o o o o o o Power BI for O365 Data Discovery Data Analysis Data Visualization & Power Maps Natural Language Search (Q&A) Power BI Site Data Management Self Service
Maximizing the Value of STM Content through Semantic Enrichment. Frank Stumpf December 1, 2009
 Maximizing the Value of STM Content through Semantic Enrichment Frank Stumpf December 1, 2009 What is Semantics and Semantic Processing? Content Knowledge Framework Technology Framework Search Text Images
Compact Muon Solenoid: Cyberinfrastructure Solutions. Ken Bloom UNL Cyberinfrastructure Workshop -- August 15, 2005
 Compact Muon Solenoid: Cyberinfrastructure Solutions Ken Bloom UNL Cyberinfrastructure Workshop -- August 15, 2005 Computing Demands CMS must provide computing to handle huge data rates and sizes, and
SAP Sybase SQL Anywhere Manage enterprise data in remote and mobile locations. Speaker s Name/Department (delete if not needed) Month 00, 2012
 Month 00, 2012") SAP Sybase SQL Anywhere Manage enterprise data in remote and mobile locations Speaker s Name/Department (delete if not needed) Month 00, 2012 The New Real-Time Business Real-Time Businesses are data-driven
SAP Sybase SQL Anywhere Manage enterprise data in remote and mobile locations Speaker s Name/Department (delete if not needed) Month 00, 2012 The New Real-Time Business Real-Time Businesses are data-driven
CORPORATE PROFILE. AI based Search Interface for your. B2B Marketing Campaigns
 CORPORATE PROFILE AI based Search Interface for your B2B Marketing Campaigns Businesses grapple with inconsistent and bad data affecting their campaigns metrics and eating up their budgets Bad data constitutes
Architectures for Scalable Media Object Search
 Architectures for Scalable Media Object Search Dennis Sng Deputy Director & Principal Scientist NVIDIA GPU Technology Workshop 10 July 2014 ROSE LAB OVERVIEW 2 Large Database of Media Objects Next- Generation
Massive Scalability With InterSystems IRIS Data Platform
 Massive Scalability With InterSystems IRIS Data Platform Introduction Faced with the enormous and ever-growing amounts of data being generated in the world today, software architects need to pay special
Knowledge Discovery. Javier Béjar URL - Spring 2019 CS - MIA
 Knowledge Discovery Javier Béjar URL - Spring 2019 CS - MIA Knowledge Discovery (KDD) Knowledge Discovery in Databases (KDD) Practical application of the methodologies from machine learning/statistics
Microservice Layout in Netflix
 Microservice Layout in Netflix Polyglot Persistence Powering Microservices Roopa Tangirala Engineering Manager Netflix Agenda 5 Use Cases Challenges Current Approach Takeaway AWS S3 CDE Search,
SAP Agile Data Preparation Simplify the Way You Shape Data PUBLIC
 SAP Agile Data Preparation Simplify the Way You Shape Data Introduction SAP Agile Data Preparation Overview Video SAP Agile Data Preparation is a self-service data preparation application providing data
Creating a Recommender System. An Elasticsearch & Apache Spark approach
 Creating a Recommender System An Elasticsearch & Apache Spark approach My Profile SKILLS Álvaro Santos Andrés Big Data & Analytics Solution Architect in Ericsson with more than 12 years of experience focused
Step-by-step data transformation
 Step-by-step data transformation Explanation of what BI4Dynamics does in a process of delivering business intelligence Contents 1. Introduction... 3 Before we start... 3 1 st. STEP: CREATING A STAGING
The Rules of Subsurface Analytics Jane McConnell, Practice Partner Oil and Gas, Teradata DEJ KL, 4 October 2017
 The Rules of Subsurface Analytics Jane McConnell, Practice Partner Oil and Gas, Teradata DEJ KL, 4 October 2017 Agenda Why subsurface analytics is different The Rules Rule 1: Right People Rule 2: Right
End to End Analysis on System z IBM Transaction Analysis Workbench for z/os. James Martin IBM Tools Product SME August 10, 2015
 End to End Analysis on System z IBM Transaction Analysis Workbench for z/os James Martin IBM Tools Product SME August 10, 2015 Please note IBM s statements regarding its plans, directions, and intent are
A Fast and High Throughput SQL Query System for Big Data
 A Fast and High Throughput SQL Query System for Big Data Feng Zhu, Jie Liu, and Lijie Xu Technology Center of Software Engineering, Institute of Software, Chinese Academy of Sciences, Beijing, China 100190
Data-Transformation on historical data using the RDF Data Cube Vocabulary
 Data-Transformation on historical data using the RD Data Cube Vocabulary Sebastian Bayerl, Michael Granitzer Department of Media Computer Science University of Passau SWIB15 Semantic Web in Libraries 22.10.2015
Think & Work like a Data Scientist with SQL 2016 & R DR. SUBRAMANI PARAMASIVAM (MANI)
") Think & Work like a Data Scientist with SQL 2016 & R DR. SUBRAMANI PARAMASIVAM (MANI) About the Speaker Dr. SubraMANI Paramasivam PhD., MCT, MCSE, MCITP, MCP, MCTS, MCSA CEO, Principal Consultant & Trainer
Think & Work like a Data Scientist with SQL 2016 & R DR. SUBRAMANI PARAMASIVAM (MANI) About the Speaker Dr. SubraMANI Paramasivam PhD., MCT, MCSE, MCITP, MCP, MCTS, MCSA CEO, Principal Consultant & Trainer
Embedded Technosolutions
 Hadoop Big Data An Important technology in IT Sector Hadoop - Big Data Oerie 90% of the worlds data was generated in the last few years. Due to the advent of new technologies, devices, and communication
New Approach to Graph Databases
 Paper PP05 New Approach to Graph Databases Anna Berg, Capish, Malmö, Sweden Henrik Drews, Capish, Malmö, Sweden Catharina Dahlbo, Capish, Malmö, Sweden ABSTRACT Graph databases have, during the past few
Chapter 3. Foundations of Business Intelligence: Databases and Information Management
 Chapter 3 Foundations of Business Intelligence: Databases and Information Management THE DATA HIERARCHY TRADITIONAL FILE PROCESSING Organizing Data in a Traditional File Environment Problems with the traditional
STRATEGIC INFORMATION SYSTEMS IV STV401T / B BTIP05 / BTIX05 - BTECH DEPARTMENT OF INFORMATICS. By: Dr. Tendani J. Lavhengwa
 STRATEGIC INFORMATION SYSTEMS IV STV401T / B BTIP05 / BTIX05 - BTECH DEPARTMENT OF INFORMATICS LECTURE: 05 (A) DATA WAREHOUSING (DW) By: Dr. Tendani J. Lavhengwa lavhengwatj@tut.ac.za 1 My personal quote:
Wearable Technology Orientation Using Big Data Analytics for Improving Quality of Human Life
 Wearable Technology Orientation Using Big Data Analytics for Improving Quality of Human Life Ch.Srilakshmi Asst Professor,Department of Information Technology R.M.D Engineering College, Kavaraipettai,
Data Warehouse and Data Mining
 Data Warehouse and Data Mining Lecture No. 05 Data Modeling Naeem Ahmed Email: naeemmahoto@gmail.com Department of Software Engineering Mehran Univeristy of Engineering and Technology Jamshoro Data Modeling
A Data Warehouse Implementation Using the Star Schema. For an outpatient hospital information system
 A Data Warehouse Implementation Using the Star Schema For an outpatient hospital information system GurvinderKaurJosan Master of Computer Application,YMT College of Management Kharghar, Navi Mumbai ---------------------------------------------------------------------***----------------------------------------------------------------
#mstrworld. Analyzing Multiple Data Sources with Multisource Data Federation and In-Memory Data Blending. Presented by: Trishla Maru.
 Analyzing Multiple Data Sources with Multisource Data Federation and In-Memory Data Blending Presented by: Trishla Maru Agenda Overview MultiSource Data Federation Use Cases Design Considerations Data
Approaching the Petabyte Analytic Database: What I learned
 Disclaimer This document is for informational purposes only and is subject to change at any time without notice. The information in this document is proprietary to Actian and no part of this document may
Module - 17 Lecture - 23 SQL and NoSQL systems. (Refer Slide Time: 00:04)
") Introduction to Morden Application Development Dr. Gaurav Raina Prof. Tanmai Gopal Department of Computer Science and Engineering Indian Institute of Technology, Madras Module - 17 Lecture - 23 SQL and
Introduction to Morden Application Development Dr. Gaurav Raina Prof. Tanmai Gopal Department of Computer Science and Engineering Indian Institute of Technology, Madras Module - 17 Lecture - 23 SQL and
TIBCO Spotfire Statement of Direction. Spotfire Product Management
 TIBCO Spotfire Statement of Direction Spotfire Product Management CONFIDENTIALITY The following information is confidential information of TIBCO Software Inc. Use, duplication, transmission, or republication
Integrate MATLAB Analytics into Enterprise Applications
 Integrate Analytics into Enterprise Applications Aurélie Urbain MathWorks Consulting Services 2015 The MathWorks, Inc. 1 Data Analytics Workflow Data Acquisition Data Analytics Analytics Integration Business
1 Copyright 2011, Oracle and/or its affiliates. All rights reserved.
 1 Copyright 2011, Oracle and/or its affiliates. All rights The following is intended to outline Oracle s general product direction. It is intended for information purposes only, and may not be incorporated
Archives in a Networked Information Society: The Problem of Sustainability in the Digital Information Environment
 Archives in a Networked Information Society: The Problem of Sustainability in the Digital Information Environment Shigeo Sugimoto Research Center for Knowledge Communities Graduate School of Library, Information
Visualisation of Abstract Information
 Visualisation of Abstract Information Visualisation Lecture 17 Institute for Perception, Action & Behaviour School of Informatics Abstract Information 1 Information Visualisation Previously data with inherent
Beyond Query/400: Leap into Business Intelligence with DB2 Web Query
 Beyond Query/400: Leap into Business Intelligence with DB2 Web Query Jarek Miszczyk ISV Solutions Enablement, IBM DB2 for i Team Rochester, MN USA 8 Copyright IBM Corporation, 2008. All Rights Reserved.
Test On Line: reusing SAS code in WEB applications Author: Carlo Ramella TXT e-solutions
 Test On Line: reusing SAS code in WEB applications Author: Carlo Ramella TXT e-solutions Chapter 1: Abstract The Proway System is a powerful complete system for Process and Testing Data Analysis in IC
Open Research Online The Open University s repository of research publications and other research outputs
 Open Research Online The Open University s repository of research publications and other research outputs The Smart Book Recommender: An Ontology-Driven Application for Recommending Editorial Products
GEO-SPATIAL METADATA SERVICES ISRO S INITIATIVE
 GEO-SPATIAL METADATA SERVICES ISRO S INITIATIVE Pushpalata B Shah, Navita J Thakkar Space Applications Centre (ISRO) Ahmedabad 380 015 - pushpa@sac.isro.gov.in Commission IV, Working Group IV/5 KEYWORDS:
Application of machine learning and big data technologies in OpenAIRE system
 Application of machine learning and big data technologies in OpenAIRE system Warsztaty Orange z cyklu Centrum Badawczo Rozwojowe zaprasza Mateusz Kobos, ICM, Univeristy of Warsaw Warszawa, 2017-05-10 OpenAIRE
Qlik s Associative Model
 White Paper Qlik s Associative Model See the Whole Story that Lives Within Your Data August, 2015 qlik.com Table of Contents Introduction 3 Qlik s associative model 3 Query-based visualization tools only
Overview. About CERN 2 / 11
 Overview CERN wanted to upgrade the data monitoring system of one of its Large Hadron Collider experiments called ALICE (A La rge Ion Collider Experiment) to ensure the experiment s high efficiency. They
Content Enrichment. An essential strategic capability for every publisher. Enriched content. Delivered.
 Content Enrichment An essential strategic capability for every publisher Enriched content. Delivered. An essential strategic capability for every publisher Overview Content is at the centre of everything
Introduction to Data Management. Lecture #1 (Course Trailer )
") Introduction to Data Management Lecture #1 (Course Trailer ) Instructor: Mike Carey mjcarey@ics.uci.edu Database Management Systems 3ed, R. Ramakrishnan and J. Gehrke 1 Today s Topics! Welcome to my biggest
Introduction to Data Management Lecture #1 (Course Trailer ) Instructor: Mike Carey mjcarey@ics.uci.edu Database Management Systems 3ed, R. Ramakrishnan and J. Gehrke 1 Today s Topics! Welcome to my biggest
OPEN. INTELLIGENT. Laser Scanning Software Solutions
 OPEN. INTELLIGENT. Laser Scanning Software Solutions www.lfm-software.com The Future of Laser Scanning Safe and efficient operation of complex engineering assets, and the efficient management of their
DATA WAREHOUSE EGCO321 DATABASE SYSTEMS KANAT POOLSAWASD DEPARTMENT OF COMPUTER ENGINEERING MAHIDOL UNIVERSITY
 DATA WAREHOUSE EGCO321 DATABASE SYSTEMS KANAT POOLSAWASD DEPARTMENT OF COMPUTER ENGINEERING MAHIDOL UNIVERSITY CHARACTERISTICS Data warehouse is a central repository for summarized and integrated data
NTP Software VFM Task Service for NetApp
 NTP Software VFM Task Service for NetApp Installation Guide Version 6.1 This guide provides quick instructions for the installation of NTP Software VFM Task Service, from an administrator s perspective.
Qlik Sense Desktop. Data, Discovery, Collaboration in minutes. Qlik Sense Desktop. Qlik Associative Model. Get Started for Free
 Qlik Sense Desktop Data, Discovery, Collaboration in minutes With Qlik Sense Desktop making business decisions becomes faster, easier, and more collaborative than ever. Qlik Sense Desktop puts rapid analytics
Migrate from Netezza Workload Migration
 Migrate from Netezza Automated Big Data Open Netezza Source Workload Migration CASE SOLUTION STUDY BRIEF Automated Netezza Workload Migration To achieve greater scalability and tighter integration with
Enterprise Knowledge Map: Toward Subject Centric Computing. March 21st, 2007 Dmitry Bogachev
 Enterprise Knowledge Map: Toward Subject Centric Computing March 21st, 2007 Dmitry Bogachev Are we ready?...the idea of an application is an artificial one, convenient to the programmer but not to the
The Emerging Data Lake IT Strategy
 The Emerging Data Lake IT Strategy An Evolving Approach for Dealing with Big Data & Changing Environments bit.ly/datalake SPEAKERS: Thomas Kelly, Practice Director Cognizant Technology Solutions Sean Martin,