Attribute data management
|
|
|
- Randolf Greene
- 6 years ago
- Views:
Transcription
1 LA561 Computer Applications in LA (GIS) Attribute data management Dr. Ragab Khalil Department of Landscape Architecture Faculty of Environmental Design King AbdulAziz University Room 103 Overview Using ArcMap tables Querying tables Table relationships Graphs from tables Dr. Ragab Khalil KAAU - FED LA561: GIS 2/45 Overview Using ArcMap tables Querying tables Table relationships Graphs from tables Dr. Ragab Khalil KAAU - FED LA561: GIS 3/45 1
2 What are attribute data? Positional data are the where things are. Attribute data are the what things are. Dr. Ragab Khalil KAAU - FED LA561: GIS 4/45 Introduction Tables are just as important as coordinate data in a GIS Tables are used to hold attribute data, and attributes control the what in a GIS Tables can be used to hold data that are not explicitly spatial in nature (related data, e.g., forest stand properties, sample data) Tables are the source of all statistics, summaries, classifications, legends, and graphs in the GIS Dr. Ragab Khalil KAAU - FED LA561: GIS 5/45 Introduction Tables are a graphical representation of tabular data Tables have their own GUI, and their own set of operations Tables in ArcMap can come from a variety of sources Multiple tables can be linked or joined based on common field values Dr. Ragab Khalil KAAU - FED LA561: GIS 6/45 2


3 Using ArcMap tables: Overview Creating tables from existing sources Creating a new table Adding fields to tables Adding records to tables Editing values in table records Calculating fields Dr. Ragab Khalil KAAU - FED LA561: GIS 7/45 Creating tables from existing sources Tables can be created from existing sources dbase files ASCII files (tab or comma delimited) INFO files ODBC connections OLE DB (Object Linking and Embedding, Database) Dr. Ragab Khalil KAAU - FED LA561: GIS 8/45 Creating tables from ODBC connections Tabular data can be obtained from ODBC databases (e.g., Oracle, Access) Dr. Ragab Khalil KAAU - FED LA561: GIS 9/45 3
 tables can be created")


4 Creating a new table New (dbase) tables can be created from scratch Creates a new file on disk New table is empty Dr. Ragab Khalil KAAU - FED LA561: GIS 10/45 Adding fields to tables Each field must be defined at add time Dr. Ragab Khalil KAAU - FED LA561: GIS 11/45 Adding records to tables Records in stand-alone tables are added New records have null values for all fields new record Dr. Ragab Khalil KAAU - FED LA561: GIS 12/45 4


5 Calculating fields Record values can be altered based on expressions Expressions can use other fields Acts on selected set of records Dr. Ragab Khalil KAAU - FED LA561: GIS 13/45 Overview Using ArcMap tables Querying tables Table relationships Graphs from tables Dr. Ragab Khalil KAAU - FED LA561: GIS 14/45 Querying tables: Overview Making queries Sorting records Displaying selected sets Modifying selected sets Basic descriptive statistics Table summaries Dr. Ragab Khalil KAAU - FED LA561: GIS 15/45 5


6 Making queries Selects records from tables/features from layers Dr. Ragab Khalil KAAU - FED LA561: GIS 16/45 Promoting records Displaying selected records Dr. Ragab Khalil KAAU - FED LA561: GIS 17/45 Sorting records Sorting records Dr. Ragab Khalil KAAU - FED LA561: GIS 18/45 6


7 Displaying selected sets Selected records from tables also select features from layers Dr. Ragab Khalil KAAU - FED LA561: GIS 19/45 Modifying selected sets Existing selections can be broadened or narrowed Additional query criteria Dr. Ragab Khalil KAAU - FED LA561: GIS 20/45 Basic descriptive statistics Basic descriptive statistics can be generated for a field will describe selected set (or all records if there is no active selection) Dr. Ragab Khalil KAAU - FED LA561: GIS 21/45 7


8 Table summaries Summarizing tables Creates a new table Summarizes values in numeric fields One output record per unique value in the field of interest Different summary statistics available Dr. Ragab Khalil KAAU - FED LA561: GIS 22/45 Table summaries Dr. Ragab Khalil KAAU - FED LA561: GIS 23/45 Overview Using ArcMap tables Querying tables Table relationships Graphs from tables Dr. Ragab Khalil KAAU - FED LA561: GIS 24/45 8
 has a matching value in Table B (Source table) Table A")
9 Table relationships: Overview Record relationships among tables Joining tables Linking tables Dr. Ragab Khalil KAAU - FED LA561: GIS 25/45 Record relationships among tables One-to-one relationship every record in Table A (Destination table) has a matching value in Table B (Source table) Table A Table B Dr. Ragab Khalil KAAU - FED LA561: GIS 26/45 Record relationships among tables Many-to-one relationship Many records in Table A have a match with only 1 record in Table B Table A Table B Dr. Ragab Khalil KAAU - FED LA561: GIS 27/45 9


10 Record relationships among tables One-to-many relationship Only 1 record in Table B has a match with many records in Table B Table A Table B Dr. Ragab Khalil KAAU - FED LA561: GIS 28/45 Joining tables Creates a virtual join (does not alter data sources) Used for: one-to-one many-to-one Dr. Ragab Khalil KAAU - FED LA561: GIS 29/45 Linking tables Does not join, but allows simultaneous selections Used for: one-to-many Dr. Ragab Khalil KAAU - FED LA561: GIS 30/45 10


11 Linking tables Does not join, but allows simultaneous selections Used for: one-to-many Dr. Ragab Khalil KAAU - FED LA561: GIS 31/45 Overview Using ArcMap tables Querying tables Table relationships Graphs from tables Dr. Ragab Khalil KAAU - FED LA561: GIS 32/45 Graphs from tables: Overview What are graphs? Creating graphs from tables Graph elements Graph types Graph legends Axis properties Axis increments and grid lines Displaying multiple fields Switching series and groups Dr. Ragab Khalil KAAU - FED LA561: GIS 33/45 11


12 What are graphs? Graphical representation of tabular data numbers are difficult to interpret graphs are easy to interpret Dr. Ragab Khalil KAAU - FED LA561: GIS 34/45 What are graphs? Graphs are dynamically linked to tables Dr. Ragab Khalil KAAU - FED LA561: GIS 35/45 Creating graphs from tables Dr. Ragab Khalil KAAU - FED LA561: GIS 36/45 12


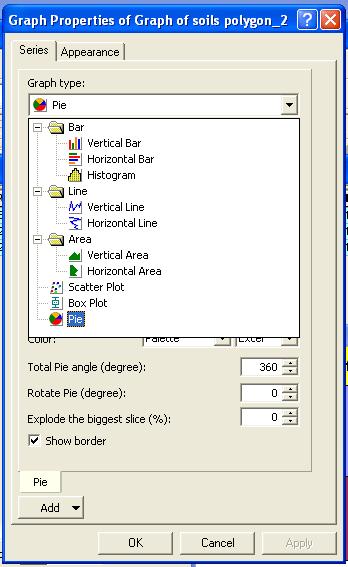
13 Advanced properties of tables Dr. Ragab Khalil KAAU - FED LA561: GIS 37/45 Graph elements Dr. Ragab Khalil KAAU - FED LA561: GIS 38/45 Graph types A number of different types of graphs exist Dr. Ragab Khalil KAAU - FED LA561: GIS 39/45 13


14 Axis properties X and Y axes have various properties Dr. Ragab Khalil KAAU - FED LA561: GIS 40/45 Axis increments and grid lines Increments and grid lines can be formatted in different ways Dr. Ragab Khalil KAAU - FED LA561: GIS 41/45 Axis increments and grid lines Maximum value can be specified Dr. Ragab Khalil KAAU - FED LA561: GIS 42/45 14

15 Displaying multiple fields Multiple fields can be displayed in the graph Dr. Ragab Khalil KAAU - FED LA561: GIS 43/45 Summary Using ArcMap tables Querying tables Table relationships Graphs from tables Dr. Ragab Khalil KAAU - FED LA561: GIS 44/45 Next week Midterm Exam 15 points Time 60 minutes Covers all lectures Written & lab Bring a CD with you. Dr. Ragab Khalil KAAU - FED LA561: GIS 45/45 15
Step by Step GIS. Section 1
 Step by Step GIS Section 1 Contact the web page given below for the data required to do the exercises (http://www.pasda.psu.edu/default.asp) Before beginning the tutorials please visit the Preparation
Creating a Crosstab Query in Design View
 Procedures LESSON 31: CREATING CROSSTAB QUERIES Using the Crosstab Query Wizard box, click Crosstab Query Wizard. 5. In the next Crosstab Query the table or query on which you want to base the query. 7.
Introduction to ArcCatalog
 Introduction to ArcCatalog Introduction To Arc Catalog ArcCatalog is a data- centric GUI tool used for managing spatial data With ArcCatalog you can. Inspect properties and attributes of data Preview and
Implementing Table Operations Using Structured Query Language (SQL) Using Multiple Operations. SQL: Structured Query Language
 Using Multiple Operations. SQL: Structured Query Language") Implementing Table Operations Using Structured Query Language (SQL) Using Multiple Operations Show Only certain columns and rows from the join of Table A with Table B The implementation of table operations
Implementing Table Operations Using Structured Query Language (SQL) Using Multiple Operations Show Only certain columns and rows from the join of Table A with Table B The implementation of table operations
Geog 459: Geographic Information Systems. Lesson 2 Laboratory Exercise
 Exercise Description Mapping and interpreting metropolitan growth and decline patterns between 1990 and 2000. Course Concepts Presented Sunbelt region, population redistribution, and metropolitan areas.
Connect Databases to AutoCAD with dbconnect Nate Bartley Test Development Engineer autodesk, inc.
 Connect Databases to AutoCAD with dbconnect Nate Bartley Test Development Engineer autodesk, inc. GD22-4 1 2 Agenda Introduction Overview of dbconnect Configure a data source Connect database to AutoCAD
CE 371 Surveying ANGLE MEASURING_3
 CE 371 Surveying ANGLE MEASURING_3 Dr. Ragab Khalil Department of Landscape Architecture Faculty of Environmental Design King AbdulAziz University Room LIE15 Overview 2/20 Deflection Angle Measurement
Data Assembling Topics:
 Topics: 1. GPX to Shape file 2. Data conversion with FME 3. Create a polygon feature 4. Merging /Appending data into a new dataset 5. Reproject data from one coordinate system to another 6. Data clipping
ArcMap - EXPLORING THE DATABASE Part I. SPATIAL DATA FORMATS Part II
 Week 5 ArcMap - EXPLORING THE DATABASE Part I SPATIAL DATA FORMATS Part II topics of the week Exploring the Database More on the Table of Contents Exploration tools Identify, Find, Measure, Map tips, Hyperlink,
Table of Contents DATA MANAGEMENT TOOLS 4. IMPORT WIZARD 6 Setting Import File Format (Step 1) 7 Setting Source File Name (Step 2) 8
 7 Setting Source File Name (Step 2) 8") Data Management Tools 1 Table of Contents DATA MANAGEMENT TOOLS 4 IMPORT WIZARD 6 Setting Import File Format (Step 1) 7 Setting Source File Name (Step 2) 8 Importing ODBC Data (Step 2) 10 Importing MSSQL
Data Management Tools 1 Table of Contents DATA MANAGEMENT TOOLS 4 IMPORT WIZARD 6 Setting Import File Format (Step 1) 7 Setting Source File Name (Step 2) 8 Importing ODBC Data (Step 2) 10 Importing MSSQL
Week 8 Lecture: Getting Things Done
 Week 8 Lecture: Input and Output, and Moving to Getting Things Done Introduction to Programming for GIS & Remote Sensing GEO6938-4172 GEO4938-4166 4166 Where We Are To this point we ve covered: Basics
Microsoft Access Illustrated. Unit B: Building and Using Queries
 Microsoft Access 2010- Illustrated Unit B: Building and Using Queries Objectives Use the Query Wizard Work with data in a query Use Query Design View Sort and find data (continued) Microsoft Office 2010-Illustrated
CE 371 Surveying Circular Curves
 Lec. 25 1 CE 371 Surveying Circular Curves Dr. Ragab Khalil Department of Landscape Architecture Faculty of Environmental Design King AbdulAziz University Room LIE15 Overview Introduction Definition of
SyncFirst Standard. Quick Start Guide User Guide Step-By-Step Guide
 SyncFirst Standard Quick Start Guide Step-By-Step Guide How to Use This Manual This manual contains the complete documentation set for the SyncFirst system. The SyncFirst documentation set consists of
Introduction to GIS & Mapping: ArcGIS Desktop
 Introduction to GIS & Mapping: ArcGIS Desktop Your task in this exercise is to determine the best place to build a mixed use facility in Hudson County, NJ. In order to revitalize the community and take
Call: Crystal Report Course Content:35-40hours Course Outline
 Crystal Report Course Content:35-40hours Course Outline Introduction Of Crystal Report & It s Benefit s Designing Reports Defining the Purpose Planning the Layout Examples of Reports Choosing Data Laying
QDA Miner. Addendum v2.0
 QDA Miner Addendum v2.0 QDA Miner is an easy-to-use qualitative analysis software for coding, annotating, retrieving and reviewing coded data and documents such as open-ended responses, customer comments,
GIS and Forest Engineering Applications
 FE 257. GIS and Forest Engineering Applications Week 3 This week s topics Clip and erase processes Chapter 6 Selecting landscape features in a GIS Chapter 5 GIS Lab3: Determining land use and ownership
Part 18. Developer 2000
 Part 18 Developer 2000 Oracle Developer/2000 Key Features WYSIWYG Layout Editor Object Navigator View all application objects, drag and drop, speed search, create and remove objects Inch, centimeter, character
Lab 7: Tables Operations in ArcMap
 Lab 7: Tables Operations in ArcMap What You ll Learn: This Lab provides more practice with tabular data management in ArcMap. In this Lab, we will view, select, re-order, and update tabular data. You should
presented by: Tim Haithcoat University of Missouri Columbia
 12 presented by: Tim Haithcoat University of Missouri Columbia Introduction Very early attempts to build GIS began from scratch, using limited tools like operating systems & compilers More recently, GIS
About using Microsoft Query to retrieve external data
 Show All About using Microsoft Query to retrieve external data This topic contains information about: What is Microsoft Query? Setting up data sources Defining your query Working with the data in Microsoft
Exam Information Guide
 Exam Information Guide Exam Numbers: Certification Track: RDCR201 & RDCR301 Availability Date: April 4, 2005 Languages Published: Exam Specifics: Target Audience: CRCP - Crystal Reports Certified Professional
SmartMAP at Clarion University: GIS for Smart Classrooms Management
 SmartMAP at Clarion University: GIS for Smart Classrooms Management By: Yasser Ayad Abstract The Smart Classrooms are spread all over Clarion University s campus and are expanding with different configurations.
Graphical Presentation of Data
 Graphical Presentation of Data Dr Steve Woodhead Supporting your argument Introducing Matlab Graph plotting in Matlab Matlab demonstrations Lecture Overview Lab two The assignment part two Next week Lecture
Using 2001 Census Data in ArcView 3.3 with Census Data from the CHASS Census Analyzer and Statistics Canada Digital Cartographic Files
 Using 2001 Census Data in ArcView 3.3 with Census Data from the CHASS Census Analyzer and Statistics Canada Digital Cartographic Files These procedures outline: 1. Downloading and opening the Cartographic
Massachusetts Institute of Technology Department of Urban Studies and Planning
 Massachusetts Institute of Technology Department of Urban Studies and Planning 11.204: Planning, Communication, and Digital Media Fall 2004 Recitation 6: Using Access to Query Multiple Data Sets 1. What
Microsoft Access 2010
 Microsoft Access 2010 Chapter 2 Querying a Database Objectives Create queries using Design view Include fields in the design grid Use text and numeric data in criteria Save a query and use the saved query
Review of File Management and Introduction to ArcGIS
 Review of File Management and Introduction to ArcGIS RNR/GEOG 417/517 Overview of Presentation Discuss the objectives of the lab exercise Introduce the class directory structure General file policies Introduce
Lab 18c: Spatial Analysis III: Clip a raster file using a Polygon Shapefile
 Environmental GIS Prepared by Dr. Zhi Wang, CSUF EES Department Lab 18c: Spatial Analysis III: Clip a raster file using a Polygon Shapefile These instructions enable you to clip a raster layer in ArcMap
Overview. Image Geometric Correction. LA502 Special Studies Remote Sensing. Why Geometric Correction?
 LA502 Special Studies Remote Sensing Image Geometric Correction Department of Landscape Architecture Faculty of Environmental Design King AbdulAziz University Room 103 Overview Image rectification Geometric
Store and Manage Data in a DBMS With ArcView Database Access. Presented By: Andrew Arana & Canserina Kurnia
 Store and Manage Data in a DBMS With ArcView Database Access Presented By: Andrew Arana & Canserina Kurnia Overview Topics to be Covered: General method for accessing data database themes, database tables
9. Introduction to MS Access
 9. Introduction to MS Access 9.1 What is MS Access? Essentially, MS Access is a database management system (DBMS). Like other products in this category, Access: o Stores and retrieves data, o Presents
USING 2001 CENSUS DATA IN ArcMap 8.2
 USING 2001 CENSUS DATA IN ArcMap 8.2 This is a guide to mapping 2001 Census data in ArcMap using age and sex profile data for Toronto at the census tract level. Importing boundary files, importing census
How to use Pivot table macro
 How to use Pivot table macro Managing Pivot Tables Table Filter and Charts for Confluence add-on allows you to summarize your table data and produce its aggregated view in the form of a pivot table. You
TRAINING GUIDE. Advanced Crystal 1
 TRAINING GUIDE Advanced Crystal 1 Using Crystal Reports with Lucity Advanced Examples 1 The fifth of a seven-part series, this workbook is designed for Crystal Reports users with some experience, who wish
hvpcp.apr user s guide: set up and tour
 : set up and tour by Rob Edsall HVPCP (HealthVis-ParallelCoordinatePlot) is a visualization environment that serves as a follow-up to HealthVis (produced by Dan Haug and Alan MacEachren at Penn State)
OLAP and Data Warehousing
 OLAP and Data Warehousing Lab Exercises Part I OLAP Purpose: The purpose of this practical guide to data warehousing is to learn how online analytical processing (OLAP) methods and tools can be used to
Text editors for phone CSV data file creation. You cannot modify or delete the Simple Phone or Default Phone file formats.
 Phone file formats This chapter provides information about configuring file formats for CSV data files that are created using a text editor. Text editors for phone CSV data file creation, page 1 Find phone
TABLES, ANATOMY OF A TABLE
 week 6 TABLES, ANATOMY OF A TABLE topics of the week Table structure Working with tables Table relationships Cardinality, Joins and Relates Table Jargon What is a Database? What is a Table? What is a Record/Row?
Steve Graves Forensic Geography Lab: Joining Data from Census to GIS. Background
 Steve Graves Forensic Geography Lab: Joining Data from Census to GIS Background Now that you have some experience downloading Census Data from the internet, you must now learn to make it appear on a map
Overview. Profile 2/27/2018. CE 371 Surveying PROFILE LEVELING & Trigonometric LEVELING
 Lec 10 + Lec 11 CE 371 Surveying PROFILE LEVELING & Trigonometric LEVELING Dr. Ragab Khalil Department of Landscape Architecture Faculty of Environmental Design King AbdulAziz University Room LIE15 Overview
WORKING WITH.TBL FILES LIO SNIF PACKAGED DATA
 To work with the.tbl files provided by the LIO SNIF data we need to create files that are readable and usable by ArcMap and ArcCatalog. 1) Rename.tbl files to.txt - to rename right-click on the filename.
Microsoft Office Illustrated Introductory, Building and Using Queries
 Microsoft Office 2007- Illustrated Introductory, Building and Using Queries Creating a Query A query allows you to ask for only the information you want vs. navigating through all the fields and records
Introducing the SAS ODBC Driver
 1 CHAPTER 1 Introducing the SAS ODBC Driver Overview: The SAS ODBC Driver 1 What Is ODBC? 2 What Is the SAS ODBC Driver? 2 Types of Data Accessed with the SAS ODBC Driver 3 Understanding SAS 5 SAS Data
Exercise 4 Compiling a Spatial Database: Adding and Linking Attribute Data
 Geog, IES 377/Cee 357 Exercise 4 Page: 1/9 GEOG 377/CEE 357: An Introduction to Geographic Information Systems Exercise 4 Compiling a Spatial Database: Adding and Linking Attribute Data 1. Introduction
Access Module 2: Building and Using Queries
 1. A query allows the selection of a subset of fields and records from one or more tables, then presents the selected data as a single datasheet. True REFERENCES: Access 28 Use the Query Wizard LEARNING
CS313T ADVANCED PROGRAMMING LANGUAGE
 CS313T ADVANCED PROGRAMMING LANGUAGE Computer Science department Lecture 1 : Introduction Lecture Contents 2 Course Info. Course objectives Course plan Books and references Assessment methods and grading
Testpassport.
 Testpassport http://www.testpassport.cn Exam : 77-427 Title : Microsoft Excel 2013 Expert Part 1 Version : Demo 1 / 4 1.You work as an Office Assistant for Blue Well Inc. The company has a Windows-based
Introduction to SQL Server 2005/2008 and Transact SQL
 Introduction to SQL Server 2005/2008 and Transact SQL Week 5: SQL Server Reporting Services Building Reports Steve Stedman - Instructor Steve@SteveStedman.com This Weeks Overview Introduction to SQL Server
TRAINING GUIDE. Advanced Crystal 1
 TRAINING GUIDE Advanced Crystal 1 Using Crystal Reports with Lucity Advanced Examples 1 The fifth of a seven-part series, this workbook is designed for Crystal Reports users with some experience, who wish
LSGI 521: Principles of GIS. Lecture 5: Spatial Data Management in GIS. Dr. Bo Wu
 Lecture 5: Spatial Data Management in GIS Dr. Bo Wu lsbowu@polyu.edu.hk Department of Land Surveying & Geo-Informatics The Hong Kong Polytechnic University Contents 1. Learning outcomes 2. From files to
TIM 50 - Business Information Systems
 TIM 50 - Business Information Systems Lecture 15 UC Santa Cruz May 20, 2014 Announcements DB 2 Due Tuesday Next Week The Database Approach to Data Management Database: Collection of related files containing
CHAPTER 6 SUMMARY. Objective 1: Identify Good Database Design
 Objective 1: Identify Good Database Design CHAPTER 6 SUMMARY A database is an organized collection of data facts about people, events, things, or ideas related to a specific topic or purpose. Information
User Guide. Module 7: Generating Reports
 User Guide Module 7: Generating Reports Module 7 provides information on generating reports to meet the needs of students, faculty, and administration. NOTE: There may be a 10-minute delay from the time
Telerik Training for Mercury 3
 Telerik Training for Mercury 3 Telerik training is intended for IT professionals and Power Users familiar with constructing reports based on raw data from databases or spreadsheets. You will learn how
Mid-term exam. GIS and Forest Engineering Applications. Week 5. FE 257. GIS and Forest Engineering Applications. Week 5
 FE 257. GIS and Forest Engineering Applications Week 5 Week 5 Last week (Chapter 3): Acquiring, creating, and editing GIS s Examining Error Chapter 7 Buffering and other proximity operations Questions?
W h i t e P a p e r. Integration Overview Importing Data and Controlling BarTender from Within Other Programs
 W h i t e P a p e r Integration Overview Importing Data and Controlling BarTender from Within Other Programs Contents Contents...2 Introduction...3 Selecting the Desired Label Data...3 Why you Usually
Lab 8: More Spatial Selection, Importing, Joining Tables
 Lab 8: More Spatial Selection, Importing, Joining Tables What You ll Learn: This lesson introduces spatial selection, importing text, combining rows, and joins. You should have read, and be ready to refer
-In windows explorer navigate to your Exercise_4 folder and right-click the DEC_10_SF1_P1.csv file and choose Open With > Notepad.
 BIOL 4460/5460 and GEOL 4460 Introduction to GIS LAB 4 MAKING A THEMATIC MAP This exercise is to show you how to create a map for printing. As you have seen in the lecture, maps can have different purposes
DNR Garmin A User Guide for Educators Prepared by: The Virginia Geospatial Extension Program
 Introduction to GPS DNR Garmin A User Guide for Educators Prepared by: The Virginia Geospatial Extension Program Overview DNR Garmin is an easy-to-use software application that allows you to manage, manipulate
Overview of the Data Sources Available in Seagate Analysis 7 (Standalone)
") Overview of the Data Sources Available in 7 (Standalone) Overview This document provides an overview of the various data sources available to the user. In standalone, these data sources are listed under
Overview of the Data Sources Available in 7 (Standalone) Overview This document provides an overview of the various data sources available to the user. In standalone, these data sources are listed under
GEOL 452/552 - GIS for Geoscientists I
 GEOL 452/552 - GIS for Geoscientists I Lecture 8 Chapter 4 - Attribute Data Today Chapter 4: Attribute Data Tables (general, import formats, field types), Selecting, SQL Query, Statistics, field calculator,
GIS LAB 1. Basic GIS Operations with ArcGIS. Calculating Stream Lengths and Watershed Areas.
 GIS LAB 1 Basic GIS Operations with ArcGIS. Calculating Stream Lengths and Watershed Areas. ArcGIS offers some advantages for novice users. The graphical user interface is similar to many Windows packages
Model 4.2 Faculty member + student Course syllabus for Advanced programming language - CS313D
 Model 4.2 Faculty member + student Course syllabus for Advanced programming language - CS1D 1. Faculty member information: Name of faculty member responsible for the course Dr. Myriam Hadjouni Office Hours
Key Terms. Attribute join Target table Join table Spatial join
 Key Terms Attribute join Target table Join table Spatial join Lect 10A Building Geodatabase Create a new file geodatabase Map x,y data Convert shape files to geodatabase feature classes Spatial Data Formats
Astra Schedule User Guide Resources
 California State University Long Beach Astra Schedule User Guide Resources View and manage your room resources. Revised 10/22/2015 Contents Astra Schedule User Guide... 1 Resources... 1 Viewing Room Information...
A Examcollection.Premium.Exam.47q
 A2090-303.Examcollection.Premium.Exam.47q Number: A2090-303 Passing Score: 800 Time Limit: 120 min File Version: 32.7 http://www.gratisexam.com/ Exam Code: A2090-303 Exam Name: Assessment: IBM InfoSphere
ARPEGGIO Data Access Frequently Asked Questions
 Technical Bulletin ARPEGGIO Data Access Frequently Asked Questions Product: ARPEGGIO products Version: ARPEGGIO 1.0 & later Host: Mainframe, AS/400 RS/6000 NIC: N/A Interface: RUMBA Router Microsoft SNA
Guide to Editing Map Legends
 Guide to Editing Map Legends Map legends explain map symbols and are crucial to the communication of a map s message. Effective legends are created with careful consideration of labels and text, classes,
User Manual. Version 3.1. Copyright 2000 Academia Software Solutions All Rights Reserved
 The GR System User Manual Version 3.1 Copyright 2000 Academia Software Solutions All Rights Reserved All contents of this manual are copyrighted by Academia Software Solutions. The information contained
For many companies, information systems cost 40 percent of overall costs.
 Types of Information Systems Competition needs very fast decisions and rapid development of information systems. Concentrate on what to do rather than how to do. For many companies, information systems
Geodatabases. Dr. Zhang SPRING 2016 GISC /03/2016
 Geodatabases Dr. Zhang SPRING 2016 GISC 1401 10/03/2016 Using and making maps Navigating GIS maps Map design Working with spatial data Spatial data infrastructure Interactive maps Map Animations Map layouts
Tutorial 4: Query and Select Spatial Data
 Tutorial 4: Query and Select Spatial Data This tutorial will introduce you to the following: Identifying Attribute Data Sources (Review) Toxic Release Inventory (TRI) facilities and NJ County boundaries
Note: you must explicitly follow these instructions to avoid problems
 Exercise 4 Attribute Tables and Census Tract Mapping 30 Points Note: We recommend that you use the Firefox web browser when working with the Census Bureau web site. Objectives: Become familiar with census
Queries give database managers its real power. Their most common function is to filter and consolidate data from tables to retrieve it.
 1 2 Queries give database managers its real power. Their most common function is to filter and consolidate data from tables to retrieve it. The data you want to see is usually spread across several tables
SQL Studio (BC) HELP.BCDBADASQL_72. Release 4.6C
 HELP.BCDBADASQL_72. Release 4.6C") HELP.BCDBADASQL_72 Release 4.6C SAP AG Copyright Copyright 2001 SAP AG. All rights reserved. No part of this publication may be reproduced or transmitted in any form or for any purpose without the express
HELP.BCDBADASQL_72 Release 4.6C SAP AG Copyright Copyright 2001 SAP AG. All rights reserved. No part of this publication may be reproduced or transmitted in any form or for any purpose without the express
Index COPYRIGHTED MATERIAL. Symbols and Numerics
 Symbols and Numerics ( ) (parentheses), in functions, 173... (double quotes), enclosing character strings, 183 #...# (pound signs), enclosing datetime literals, 184... (single quotes), enclosing character
Lab #7: Mapping US Census Data
 Lab #7: Mapping US Census Data Objectives: Access US Census Data via the Web Download census data in excel format Create new variables based on calculations Create key fields for merging with NYC Planning
7 CREATING QUERY WITH QUERY WIZARD AND QUERY DESIGNER
 7 CREATING QUERY WITH QUERY WIZARD AND QUERY DESIGNER 7.1 INTRODUCTION Query is the most powerful feature of any database. A Query is a set of instructions in a logical order, required to produce the output
COURSE OUTLINE. Page : 1 of 5. Semester: 2 Academic Session: 2017/2018
 Course Code: SCSD5 Page : 1 of 5 S Lecturer : Nor Hawaniah Zakaria Room No. : 40-06, Block N8 Telephone No. : 07-55410 E-mail : hawaniah@utm.my Synopsis : This course introduces students to the concept
Geography 281 Map Making with GIS Project Two: Map Design Issues in ArcMap
 Geography 281 Map Making with GIS Project Two: Map Design Issues in ArcMap This activity provides an introduction to the map design process. It takes you through a typical sequence from the initial decision
Telerik Training for Mercury 3
 Telerik Training for Mercury 3 Telerik training is intended for IT professionals and Power Users familiar with constructing reports based on raw data from databases or spreadsheets. You will learn how
Access 2016 Essentials Syllabus
 Access 2016 Essentials Syllabus Lesson 1 Creating & Managing Databases 1.1 Introduction Lesson content; What is a database? The course folders; The course player; Screen resolution notes; Prerequisites;
Calculate a Distance Matrix of Locations along River Network
 Calculate a Distance Matrix of Locations along River Network These instructions enable you to measure the length of line segments between points, which is much more useful than simple straight-line distances
Astra Scheduling Grids
 Astra Scheduling Grids To access the grids, click on the Scheduling Grids option from the Calendars tab. A default grid will be displayed as defined by the calendar permission within your role. Choosing
Select the Parks within Forest Acres
 Select the Parks within Forest Acres TASKS RESULT 1. Add the county boundary, municipalities and parks (pts.) layers to your map 2. Save your map (.mxd) to your desktop Your map should look something like
Microsoft Excel 2007 and the Government Meeting Professional
 Microsoft Excel 2007 and the Government Meeting Professional Tips on how to manage, create, and utilize Excel to be more efficient and cost effective. Excel 2007 Today s Topics Basic Organization Skills
TerraStation II v7 Training
 WORKED EXAMPLE Loading and using Core Analysis Data Core Analysis Data is frequently not available at exact well increments. In order to retain the exact depth at which this data is sampled, it needs to
Exercise 1: Introduction to MapInfo
 Geog 578 Exercise 1: Introduction to MapInfo Page: 1/22 Geog 578: GIS Applications Exercise 1: Introduction to MapInfo Assigned on January 25 th, 2006 Due on February 1 st, 2006 Total Points: 10 0. Convention
Getting Started With LP360
 Getting Started With LP360 12/22/2015 1 Contents What is LP360?... 3 System Requirements... 3 Installing LP360... 4 How to Enable the LP360 Extension... 4 How to Display the LP360 Toolbar... 4 How to Import
Functionality Guide. for CaseWare IDEA Data Analysis
 Functionality Guide for CaseWare IDEA Data Analysis CaseWare IDEA Quick Access Functionality Crib Sheet A quick guide to the major functionality you will use within IDEA. FILE TAB: Passport The single
Disk Operating System
 In the name of Allah Islamic University of Gaza Faculty of Engineering Computer Engineering Department Introduction To Computer Lab Lab # 1 Disk Operating System El-masry 2013 Objective To be familiar
In this lab, you will create two maps. One map will show two different projections of the same data.
 Projection Exercise Part 2 of 1.963 Lab for 9/27/04 Introduction In this exercise, you will work with projections, by re-projecting a grid dataset from one projection into another. You will create a map
E-IT Look-up Tools and Reports
 This manual will demonstrate how to look up and open current and past E-ITs and will also show how an IT initiator can run a formatted report for individual ITs Look-up Tools Default Org Approvers, Plus
SAS Data Explorer 2.1: User s Guide
 SAS Data Explorer 2.1: User s Guide Working with SAS Data Explorer Understanding SAS Data Explorer SAS Data Explorer and the Choose Data Window SAS Data Explorer enables you to copy data to memory on SAS
Sage Abra Alerts is designed and licensed exclusively for use with the Sage Abra HRMS database.
 Release Notes Product: Sage Abra Alerts Version: 5.1 Overview Upgrade Information Sage Abra Alerts is designed and licensed exclusively for use with the Sage Abra HRMS database. Sage requires that Sage
Interview Questions on DBMS and SQL [Compiled by M V Kamal, Associate Professor, CSE Dept]
![Interview Questions on DBMS and SQL [Compiled by M V Kamal, Associate Professor, CSE Dept]](/thumbs/82/85344438.jpg "Interview Questions on DBMS and SQL [Compiled by M V Kamal, Associate Professor, CSE Dept]") Interview Questions on DBMS and SQL [Compiled by M V Kamal, Associate Professor, CSE Dept] 1. What is DBMS? A Database Management System (DBMS) is a program that controls creation, maintenance and use
Interview Questions on DBMS and SQL [Compiled by M V Kamal, Associate Professor, CSE Dept] 1. What is DBMS? A Database Management System (DBMS) is a program that controls creation, maintenance and use
Internal Commands COPY and TYPE
 Internal Commands COPY and TYPE Ch 5 1 Overview Will review file-naming rules. Ch 5 2 Overview Will learn some internal commands that can be used to manage and manipulate files. Ch 5 3 Overview The value
Cyrious Control: Listen 360 Manual Export
 Cyrious Control: Listen 360 Manual Export In order to export information in the specific format that Listen 360 recommends you must perform an advanced order explorer query. The steps below will walk you