What is KNIME? workflows nodes standard data mining, data analysis data manipulation
|
|
|
- Cornelius Malone
- 6 years ago
- Views:
Transcription
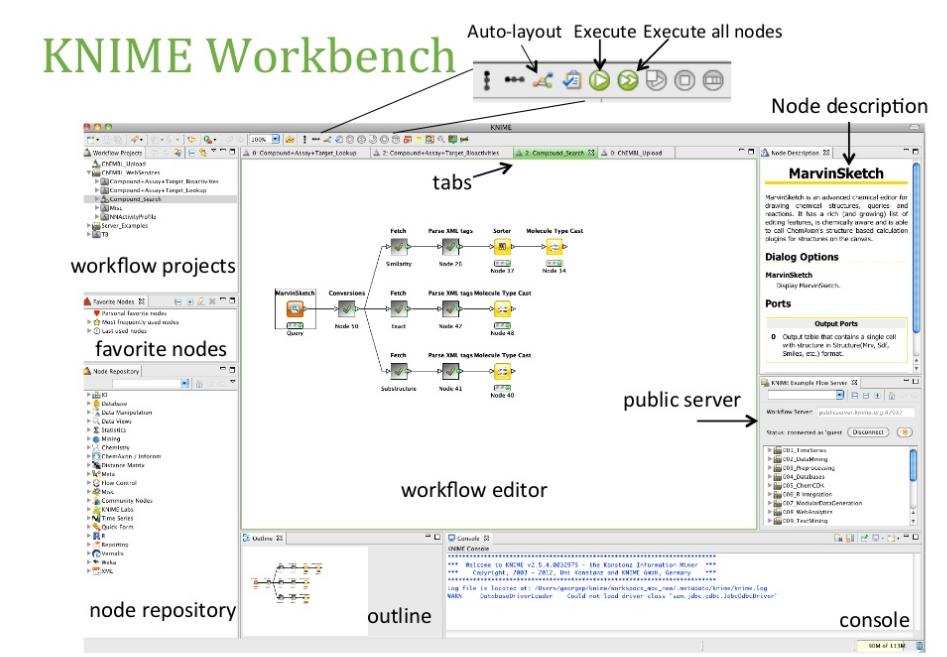
1 KNIME TUTORIAL
2 What is KNIME? KNIME = Konstanz Information Miner Developed at University of Konstanz in Germany Desktop version available free of charge (Open Source) Modular platform for building and executing workflows using predefined components, called nodes Functionality available for tasks such as standard data mining, data analysis and data manipulation Extra features and functionalities available in KNIME by extensions Written in Java based on the Eclipse SDK platform
3 KNIME resources Web pages containing documentation - tech.knime.org tech.knime.org installation-0 Downloads knime.org/download-desktop Community forum tech.knime.org/forum Books and white papers knime.org/node/33079
4 Installation and updates Download and unzip KNIME No further setup required Additional nodes after first launch Workflows and data are stored in a workspace New software (nodes) from update sites
5

6 Workspace The workspace is the directory where all your workflows and preferences are saved in the next KNIME session. The workspace directory can be located anywhere on your hard-disk. By default, the workspace directory is [KNIME] \workspace. But, you can change it, by changing the path requested at the beginning, before starting the KNIME working session.

7 Download Extensions From the Top Menu, select Help -> Software Updates In the Software Updates window, select Tab Available Software Open the sites and select the extensions Click the Install button on the top right Restart KNIME In the Node Repository you can see the new nodes
8 What can you do with KNIME? Data manipulation and analysis File & database I/O, filtering, grouping, joining,. Data mining / machine learning WEKA, R, Interactive plotting Scripting Integration R, Perl, Python, Matlab Much more Bioinformatics, text mining and network analysis

9 KNIME Workflow KNIME does not work with scripts, it works with workflows. A workflow is an analysis flow, which is the sequence of the analysis steps necessary to reach a given result: Read data Clean data Filter data Train a model KNIME implements its workflows graphically. Each step of the data analysis is executed by a little box, called a node. A sequence of nodes makes a workflow.
10 Import/export of workflow
11

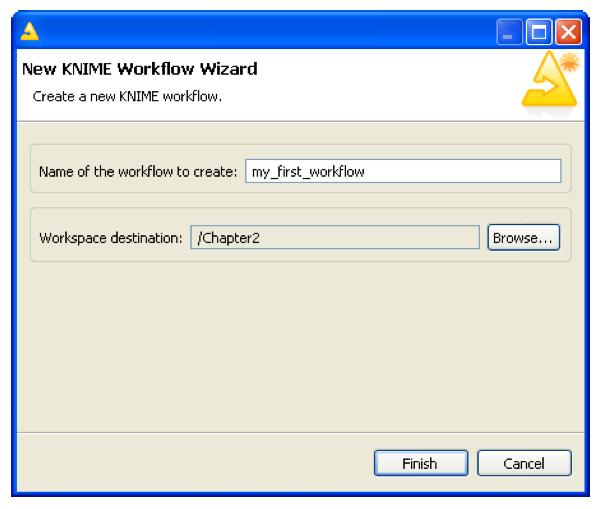
12 Create a new workflow
13 KNIME nodes: Overview


14 Ports Data Port: a white triangle which transfers flat data tables from node to node Database Port: Nodes executing commands inside a database are recognized by their database ports (brown square) PMML Ports: Data Mining nodes learn a model which is passed to the referring predictor node via a blue squared PMML port
.")
15 Other Ports Whenever a node provides data that does not fit a flat data table structure, a general purpose port for structured data is used (dark cyan square). All ports not listed above are known as "unknown" types (gray square).

16 Node Creation
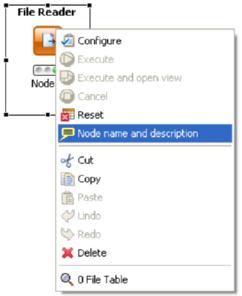
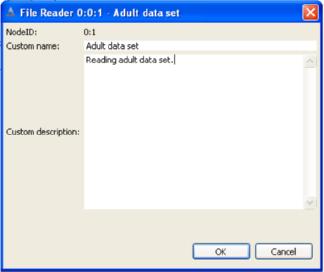
17 Node Operations

18 I/O Operations ARFF (Attribute-Relation File Format) file is an ASCII text file that describes a list of instances sharing a set of attributes. CSV (Comma-Separated Values) file stores tabular data (numbers and text) in plain-text form.

19 Read data from file

20 Read data from file Click in the column name Change column name Change type

21 Table Data


22 Other input nodes: CSV Reader

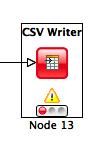
23 CSV Writer
24 Data Manipulation Three main sections Columns: binning, replace, filters, normalizer, missing values, Rows: filtering, sampling, partitioning, Matrix: Transpose


25 Statistics node For all numeric columns computes statistics such as minimum, maximum, mean, standard deviation, variance, median, overall sum, number of missing values and row counts For all nominal values counts them together with their occurrences.

26 Correlation Analysis Linear Correlation node computes for each pair of selected columns a correlation coefficient, i.e. a measure of the correlation of the two variables Pearson Correlation Coefficient Correlation Filtering node uses the model as generated by a Correlation node to determine which columns are redundant (i.e. correlated) and filters them out. The output table will contain the reduced set of columns.
27 Data Views Box Plots Histograms, Pie Charts, Scatter plots, Scatter Matrix
28 Mining Algorithms Clustering Hierarchical K-means Fuzzy c-means Decision Tree Item sets / Association Rules Borgelt s Algorithms (Extension) Weka (Extension)
29 Data Manipulation See Workflow on the course website
KNIME TUTORIAL. Anna Monreale KDD-Lab, University of Pisa
 KNIME TUTORIAL Anna Monreale KDD-Lab, University of Pisa Email: annam@di.unipi.it Outline Introduction on KNIME KNIME components Exercise: Data Understanding Exercise: Market Basket Analysis Exercise:
Introduction to Knime 1
 Introduction to Knime 1 Marta Arias marias@lsi.upc.edu Dept. LSI, UPC Fall 2012 1 Thanks to José L. Balcázar for the slides, they are essentially a copy from a tutorial he gave. KNIME, I KNIME,[naim],
Installation KNIME AG. All rights reserved. 1
 Installation 1. Install KNIME Analytics Platform (from thumb drive) 2. Help > Install New Software > Add (> Archive): 00_InstallationFiles/CommunityContributions_trunk.zip https://update.knime.org/community-contributions/trunk
Short instructions on using Weka
 Short instructions on using Weka G. Marcou 1 Weka is a free open source data mining software, based on a Java data mining library. Free alternatives to Weka exist as for instance R and Orange. The current
Computing a Gain Chart. Comparing the computation time of data mining tools on a large dataset under Linux.
 1 Introduction Computing a Gain Chart. Comparing the computation time of data mining tools on a large dataset under Linux. The gain chart is an alternative to confusion matrix for the evaluation of a classifier.
1 Topic. Image classification using Knime.
 1 Topic Image classification using Knime. The aim of image mining is to extract valuable knowledge from image data. In the context of supervised image classification, we want to assign automatically a
Tutorial Case studies
 1 Topic Wrapper for feature subset selection Continuation. This tutorial is the continuation of the preceding one about the wrapper feature selection in the supervised learning context (http://data-mining-tutorials.blogspot.com/2010/03/wrapper-forfeature-selection.html).
Quick Start Guide Jacob Stolk PhD Simone Stolk MPH November 2018
 Quick Start Guide Jacob Stolk PhD Simone Stolk MPH November 2018 Contents Introduction... 1 Start DIONE... 2 Load Data... 3 Missing Values... 5 Explore Data... 6 One Variable... 6 Two Variables... 7 All
Introduction to BEST Viewpoints
 Introduction to BEST Viewpoints This is not all but just one of the documentation files included in BEST Viewpoints. Introduction BEST Viewpoints is a user friendly data manipulation and analysis application
KNIME What s new?! Bernd Wiswedel KNIME.com AG, Zurich, Switzerland
 KNIME What s new?! Bernd Wiswedel KNIME.com AG, Zurich, Switzerland Data Access ASCII (File/CSV Reader, ) Excel Web Services Remote Files (http, ftp, ) Other domain standards (e.g. Sdf) Databases Data
Introduction to MatLab. Introduction to MatLab K. Craig 1
 Introduction to MatLab Introduction to MatLab K. Craig 1 MatLab Introduction MatLab and the MatLab Environment Numerical Calculations Basic Plotting and Graphics Matrix Computations and Solving Equations
Copyright 2018 by KNIME Press
 2 Copyright 2018 by KNIME Press All rights reserved. This publication is protected by copyright, and permission must be obtained from the publisher prior to any prohibited reproduction, storage in a retrieval
Lab 1: Getting started with R and RStudio Questions? or
 Lab 1: Getting started with R and RStudio Questions? david.montwe@ualberta.ca or isaacren@ualberta.ca 1. Installing R and RStudio To install R, go to https://cran.r-project.org/ and click on the Download
KANRI DISTANCE CALCULATOR. User Guide v2.4.9
 KANRI DISTANCE CALCULATOR User Guide v2.4.9 KANRI DISTANCE CALCULATORTM FLOW Participants Input File Correlation Distance Type? Generate Target Profile General Target Define Target Profile Calculate Off-Target
An Introduction to Minitab Statistics 529
 An Introduction to Minitab Statistics 529 1 Introduction MINITAB is a computing package for performing simple statistical analyses. The current version on the PC is 15. MINITAB is no longer made for the
DATA SCIENCE INTRODUCTION QSHORE TECHNOLOGIES. About the Course:
 DATA SCIENCE About the Course: In this course you will get an introduction to the main tools and ideas which are required for Data Scientist/Business Analyst/Data Analyst/Analytics Manager/Actuarial Scientist/Business
Contents. Tutorials Section 1. About SAS Enterprise Guide ix About This Book xi Acknowledgments xiii
 Contents About SAS Enterprise Guide ix About This Book xi Acknowledgments xiii Tutorials Section 1 Tutorial A Getting Started with SAS Enterprise Guide 3 Starting SAS Enterprise Guide 3 SAS Enterprise
Tutorial on Machine Learning Tools
 Tutorial on Machine Learning Tools Yanbing Xue Milos Hauskrecht Why do we need these tools? Widely deployed classical models No need to code from scratch Easy-to-use GUI Outline Matlab Apps Weka 3 UI TensorFlow
COMP33111: Tutorial/lab exercise 2
 COMP33111: Tutorial/lab exercise 2 Part 1: Data cleaning, profiling and warehousing Note: use lecture slides and additional materials (see Blackboard and COMP33111 web page). 1. Explain why legacy data
GRETL FOR TODDLERS!! CONTENTS. 1. Access to the econometric software A new data set: An existent data set: 3
 GRETL FOR TODDLERS!! JAVIER FERNÁNDEZ-MACHO CONTENTS 1. Access to the econometric software 3 2. Loading and saving data: the File menu 3 2.1. A new data set: 3 2.2. An existent data set: 3 2.3. Importing
CS 8520: Artificial Intelligence. Weka Lab. Paula Matuszek Fall, CSC 8520 Fall Paula Matuszek
 CS 8520: Artificial Intelligence Weka Lab Paula Matuszek Fall, 2015!1 Weka is Waikato Environment for Knowledge Analysis Machine Learning Software Suite from the University of Waikato Been under development
Rosaria Silipo, Michael P. Mazanetz. The KNIME Cookbook Recipes for the Advanced User
 Rosaria Silipo, Michael P. Mazanetz The KNIME Cookbook Recipes for the Advanced User 1 Copyright 2012 by KNIME Press All rights reserved. This publication is protected by copyright, and permission must
Engineering Innovation Center MATLAB Basics
 Engineering Innovation Center MATLAB Basics MATLAB Short for MATrix LABoratory Both a programming language and the interface Designed to deal with large sets of data and analysis Allows matrix manipulations,
WEKA homepage.
 WEKA homepage http://www.cs.waikato.ac.nz/ml/weka/ Data mining software written in Java (distributed under the GNU Public License). Used for research, education, and applications. Comprehensive set of
Fathom Dynamic Data TM Version 2 Specifications
 Data Sources Fathom Dynamic Data TM Version 2 Specifications Use data from one of the many sample documents that come with Fathom. Enter your own data by typing into a case table. Paste data from other
SAS Enterprise Miner : Tutorials and Examples
 SAS Enterprise Miner : Tutorials and Examples SAS Documentation February 13, 2018 The correct bibliographic citation for this manual is as follows: SAS Institute Inc. 2017. SAS Enterprise Miner : Tutorials
1. Basic Steps for Data Analysis Data Editor. 2.4.To create a new SPSS file
 1 SPSS Guide 2009 Content 1. Basic Steps for Data Analysis. 3 2. Data Editor. 2.4.To create a new SPSS file 3 4 3. Data Analysis/ Frequencies. 5 4. Recoding the variable into classes.. 5 5. Data Analysis/
MATLAB Introduction to MATLAB Programming
 MATLAB Introduction to MATLAB Programming MATLAB Scripts So far we have typed all the commands in the Command Window which were executed when we hit Enter. Although every MATLAB command can be executed
Enterprise Miner Version 4.0. Changes and Enhancements
 Enterprise Miner Version 4.0 Changes and Enhancements Table of Contents General Information.................................................................. 1 Upgrading Previous Version Enterprise Miner
JChem Extensions for KNIME KNIME.com products
 JChem Extensions for KNIME KNIME.com products ChemAxon 2011 US User Group Meeting San Diego, CA Takahiro Ohshima Overview INFOCOM KNIME JChem Extensions Marvin Family Nodes KNIME.com products KNIME Enterprise
Desktop Command window
 Chapter 1 Matlab Overview EGR1302 Desktop Command window Current Directory window Tb Tabs to toggle between Current Directory & Workspace Windows Command History window 1 Desktop Default appearance Command
Choosing the Right Procedure
 3 CHAPTER 1 Choosing the Right Procedure Functional Categories of Base SAS Procedures 3 Report Writing 3 Statistics 3 Utilities 4 Report-Writing Procedures 4 Statistical Procedures 5 Efficiency Issues
Choosing the Right Procedure
 3 CHAPTER 1 Choosing the Right Procedure Functional Categories of Base SAS Procedures 3 Report Writing 3 Statistics 3 Utilities 4 Report-Writing Procedures 4 Statistical Procedures 6 Available Statistical
Data Mining: Exploring Data. Lecture Notes for Data Exploration Chapter. Introduction to Data Mining
 Data Mining: Exploring Data Lecture Notes for Data Exploration Chapter Introduction to Data Mining by Tan, Steinbach, Karpatne, Kumar 02/03/2018 Introduction to Data Mining 1 What is data exploration?
Matrices 4: use of MATLAB
 Matrices 4: use of MATLAB Anthony Rossiter http://controleducation.group.shef.ac.uk/indexwebbook.html http://www.shef.ac.uk/acse Department of Automatic Control and Systems Engineering Introduction The
Data Mining: Concepts and Techniques. (3 rd ed.) Chapter 3. Chapter 3: Data Preprocessing. Major Tasks in Data Preprocessing
 Chapter 3. Chapter 3: Data Preprocessing. Major Tasks in Data Preprocessing") Data Mining: Concepts and Techniques (3 rd ed.) Chapter 3 1 Chapter 3: Data Preprocessing Data Preprocessing: An Overview Data Quality Major Tasks in Data Preprocessing Data Cleaning Data Integration Data
Data Mining: Concepts and Techniques (3 rd ed.) Chapter 3 1 Chapter 3: Data Preprocessing Data Preprocessing: An Overview Data Quality Major Tasks in Data Preprocessing Data Cleaning Data Integration Data
static MM_Index snap(mm_index corect, MM_Index ligct, int imatch0, int *moleatoms, i
 GLIDE static MM_Index snap(mm_index corect, MM_Index ligct, int imatch0, int *moleatoms, int *refcoreatoms){int ncoreat = :vector mappings; PhpCoreMapping mapping; for COMMON(glidelig).
Introduction to R and R-Studio Toy Program #1 R Essentials. This illustration Assumes that You Have Installed R and R-Studio
 Introduction to R and R-Studio 2018-19 Toy Program #1 R Essentials This illustration Assumes that You Have Installed R and R-Studio If you have not already installed R and RStudio, please see: Windows
Chapter 3: Data Description Calculate Mean, Median, Mode, Range, Variation, Standard Deviation, Quartiles, standard scores; construct Boxplots.
 MINITAB Guide PREFACE Preface This guide is used as part of the Elementary Statistics class (Course Number 227) offered at Los Angeles Mission College. It is structured to follow the contents of the textbook
AN OVERVIEW AND EXPLORATION OF JMP A DATA DISCOVERY SYSTEM IN DAIRY SCIENCE
 AN OVERVIEW AND EXPLORATION OF JMP A DATA DISCOVERY SYSTEM IN DAIRY SCIENCE A.P. Ruhil and Tara Chand National Dairy Research Institute, Karnal-132001 JMP commonly pronounced as Jump is a statistical software
Sample Data. Sample Data APPENDIX A. Downloading the Sample Data. Images. Sample Databases
 APPENDIX A Sample Data Sample Data If you wish to follow the examples used in this book and I hope you will you will need some sample data to work with. All the files referenced in this book are available
Using the DATAMINE Program
 6 Using the DATAMINE Program 304 Using the DATAMINE Program This chapter serves as a user s manual for the DATAMINE program, which demonstrates the algorithms presented in this book. Each menu selection
Tableau Training Content
 TABLEAU DESKTOP INTRODUCTION AND GETTING STARTED Tableau desktop role in the tableau product line Application terminology View terminology Data terminology Visual cues for fields BEST PRACTICES IN CONNECTING
KNIME for the life sciences Cambridge Meetup
 KNIME for the life sciences Cambridge Meetup Greg Landrum, Ph.D. KNIME.com AG 12 July 2016 What is KNIME? A bit of motivation: tool blending, data blending, documentation, automation, reproducibility More
GoTo [ File ] [ Import KNIME workflow ] Select archive file: and import the CountNuclei.zip example workflow.
![GoTo [ File ] [ Import KNIME workflow ] Select archive file: and import the CountNuclei.zip example workflow.](/thumbs/75/71593469.jpg "GoTo [ File ] [ Import KNIME workflow ] Select archive file: and import the CountNuclei.zip example workflow.") Manual KNIME Image Processing :: First steps This manual aims to provide first insights in KNIME Image Processing. The image processing workflow Count nuclei is described in detail and can be downloaded
Manual KNIME Image Processing :: First steps This manual aims to provide first insights in KNIME Image Processing. The image processing workflow Count nuclei is described in detail and can be downloaded
New Features in SGeMS
 Annual Meeting 2010 Stanford Center for Reservoir Forecasting New Features in SGeMS Rahul Gupta Computer Sciences, Stanford University Alexandre Boucher EESS, Stanford University Outline Introduction to
DATA ANALYSIS WITH WEKA. Author: Nagamani Mutteni Asst.Professor MERI
 DATA ANALYSIS WITH WEKA Author: Nagamani Mutteni Asst.Professor MERI Topic: Data Analysis with Weka Course Duration: 2 Months Objective: Everybody talks about Data Mining and Big Data nowadays. Weka is
Prototyping DM Techniques with WEKA and YALE Open-Source Software
 TIES443 Contents Tutorial 1 Prototyping DM Techniques with WEKA and YALE Open-Source Software Department of Mathematical Information Technology University of Jyväskylä Mykola Pechenizkiy Course webpage:
Elixir Ad-hoc Report. Release Elixir Technology Pte Ltd
 Elixir Ad-hoc Report Release 4.0.0 Elixir Technology Pte Ltd Elixir Ad-hoc Report: Release 4.0.0 Elixir Technology Pte Ltd Published 2015 Copyright 2015 Elixir Technology Pte Ltd All rights reserved. Java
Introduction to Minitab 1
 Introduction to Minitab 1 We begin by first starting Minitab. You may choose to either 1. click on the Minitab icon in the corner of your screen 2. go to the lower left and hit Start, then from All Programs,
Math 227 EXCEL / MEGASTAT Guide
 Math 227 EXCEL / MEGASTAT Guide Introduction Introduction: Ch2: Frequency Distributions and Graphs Construct Frequency Distributions and various types of graphs: Histograms, Polygons, Pie Charts, Stem-and-Leaf
Lab 0a: Introduction to MATLAB
 http://www.comm.utoronto.ca/~dkundur/course/real-time-digital-signal-processing/ Page 1 of 1 Lab 0a: Introduction to MATLAB Professor Deepa Kundur Introduction and Background Welcome to your first real-time
Introduction to R Programming
 Course Overview Over the past few years, R has been steadily gaining popularity with business analysts, statisticians and data scientists as a tool of choice for conducting statistical analysis of data
Introduction to IBM Data Studio, Part 1: Get started with IBM Data Studio, Version and Eclipse
 Introduction to IBM Data Studio, Part 1: Get started with IBM Data Studio, Version 1.1.0 and Eclipse Install, work with data perspectives, create connections, and create a project Skill Level: Intermediate
PATRISTICv1.0. Patristic runs on Windows, Mac and Linux in a graphic mode. Make sure you have a version a Java.
 PATRISTICv1.0 Introduction: Patristic is a Java program that uses as input different tree files and computes their patristic distances. Patristic allows saving and editing in different ways those distances.
KNIME Analytics Platform Course for Beginners
 KNIME Analytics Platform Course for Beginners KNIME AG Overview KNIME Analytics Platform 1 2 What is KNIME Analytics Platform? A tool for data analysis, manipulation, visualization, and reporting Based
e-bridge Color Profile Tool Quick Start Guide
 e-bridge Color Profile Tool Quick Start Guide 1 Contents 1. Installation... 3 1.1. Installing the e-bridge Color Profile Tool Software... 3 1.1. Removing the e-bridge Color Profile Tool... 4 1.2. Installing
Installing SQL Server Developer Last updated 8/28/2010
 Installing SQL Server Developer Last updated 8/28/2010 1. Run Setup.Exe to start the setup of SQL Server 2008 Developer 2. On some OS installations (i.e. Windows 7) you will be prompted a reminder to install
Data Mining: Exploring Data. Lecture Notes for Chapter 3
 Data Mining: Exploring Data Lecture Notes for Chapter 3 1 What is data exploration? A preliminary exploration of the data to better understand its characteristics. Key motivations of data exploration include
Bluman & Mayer, Elementary Statistics, A Step by Step Approach, Canadian Edition
 Bluman & Mayer, Elementary Statistics, A Step by Step Approach, Canadian Edition Online Learning Centre Technology Step-by-Step - Minitab Minitab is a statistical software application originally created
User Guide for ModuLand Cytoscape plug-in
 User Guide for ModuLand Cytoscape plug-in Created for the ModuLand plug-in version 1.3 (April 2012) This user guide is based on the following publications, where the ModuLand method and its versions have
Lab of COMP 406. MATLAB: Quick Start. Lab tutor : Gene Yu Zhao Mailbox: or Lab 1: 11th Sep, 2013
 Lab of COMP 406 MATLAB: Quick Start Lab tutor : Gene Yu Zhao Mailbox: csyuzhao@comp.polyu.edu.hk or genexinvivian@gmail.com Lab 1: 11th Sep, 2013 1 Where is Matlab? Find the Matlab under the folder 1.
UNIVERSITI TEKNIKAL MALAYSIA MELAKA FAKULTI KEJURUTERAAN ELEKTRONIK DAN KEJURUTERAAN KOMPUTER
 UNIVERSITI TEKNIKAL MALAYSIA MELAKA FAKULTI KEJURUTERAAN ELEKTRONIK DAN KEJURUTERAAN KOMPUTER FAKULTI KEJURUTERAAN ELEKTRONIK DAN KEJURUTERAAN KOMPUTER BENC 2113 DENC ECADD 2532 ECADD LAB SESSION 6/7 LAB
Dr. Barbara Morgan Quantitative Methods
 Dr. Barbara Morgan Quantitative Methods 195.650 Basic Stata This is a brief guide to using the most basic operations in Stata. Stata also has an on-line tutorial. At the initial prompt type tutorial. In
CDAA No. 4 - Part Two - Multiple Regression - Initial Data Screening
 CDAA No. 4 - Part Two - Multiple Regression - Initial Data Screening Variables Entered/Removed b Variables Entered GPA in other high school, test, Math test, GPA, High school math GPA a Variables Removed
CollabNet TeamForge 5.3 Evaluator s Guide
 CollabNet TeamForge 5.3 Evaluator s Guide Thank you for evaluating CollabNet TeamForge 5.3. This Evaluator s Guide will help you experience the key features of CollabNet TeamForge by walking you through
JMP Book Descriptions
 JMP Book Descriptions The collection of JMP documentation is available in the JMP Help > Books menu. This document describes each title to help you decide which book to explore. Each book title is linked
The Explorer. chapter Getting started
 chapter 10 The Explorer Weka s main graphical user interface, the Explorer, gives access to all its facilities using menu selection and form filling. It is illustrated in Figure 10.1. There are six different
Data Mining: Exploring Data. Lecture Notes for Chapter 3. Introduction to Data Mining
 Data Mining: Exploring Data Lecture Notes for Chapter 3 Introduction to Data Mining by Tan, Steinbach, Kumar What is data exploration? A preliminary exploration of the data to better understand its characteristics.
In Minitab interface has two windows named Session window and Worksheet window.
 Minitab Minitab is a statistics package. It was developed at the Pennsylvania State University by researchers Barbara F. Ryan, Thomas A. Ryan, Jr., and Brian L. Joiner in 1972. Minitab began as a light
ECO375 Tutorial 1 Introduction to Stata
 ECO375 Tutorial 1 Introduction to Stata Matt Tudball University of Toronto Mississauga September 14, 2017 Matt Tudball (University of Toronto) ECO375H5 September 14, 2017 1 / 25 What Is Stata? Stata is
Matlab Tutorial 1: Working with variables, arrays, and plotting
 Matlab Tutorial 1: Working with variables, arrays, and plotting Setting up Matlab First of all, let's make sure we all have the same layout of the different windows in Matlab. Go to Home Layout Default.
Matlab Practice Sessions
 Matlab Practice Sessions 1. Getting Started Startup Matlab Observe the following elements of the desktop; Command Window Current Folder Window Command History Window Workspace Window Notes: If you startup
KNIME User Training KNIME AG. Copyright 2017 KNIME AG
 KNIME User Training KNIME AG Overview KNIME Analytics Platform 1 2 What is KNIME Analytics Platform? A tool for data analysis, manipulation, visualization, and reporting Based on the graphical programming
Introduction. Matlab for Psychologists. Overview. Coding v. button clicking. Hello, nice to meet you. Variables
 Introduction Matlab for Psychologists Matlab is a language Simple rules for grammar Learn by using them There are many different ways to do each task Don t start from scratch - build on what other people
Bar Charts and Frequency Distributions
 Bar Charts and Frequency Distributions Use to display the distribution of categorical (nominal or ordinal) variables. For the continuous (numeric) variables, see the page Histograms, Descriptive Stats
STN AnaVist, Version 2.0 Quick Start Guide for STN Login IDs for Shared Projects
 STN AnaVist, Version 2.0 Quick Start Guide for STN Login IDs for Shared Projects Contents Contents Introduction About this Guide...3 Using STN AnaVist with STN Login ID for Shared Projects...3 Opening
KNIME Big Data Training
 KNIME Big Data Training education@knime.com Overview KNIME Analytics Platform 1 2 What is KNIME Analytics Platform? A tool for data analysis, manipulation, visualization, and reporting Based on the graphical
CLAREMONT MCKENNA COLLEGE. Fletcher Jones Student Peer to Peer Technology Training Program. Basic Statistics using Stata
 CLAREMONT MCKENNA COLLEGE Fletcher Jones Student Peer to Peer Technology Training Program Basic Statistics using Stata An Introduction to Stata A Comparison of Statistical Packages... 3 Opening Stata...
Computational Databases: Inspirations from Statistical Software. Linnea Passing, Technical University of Munich
 Computational Databases: Inspirations from Statistical Software Linnea Passing, linnea.passing@tum.de Technical University of Munich Data Science Meets Databases Data Cleansing Pipelines Fuzzy joins Data
Tutorial 8 Sharing, Integrating and Analyzing Data
 Tutorial 8 Sharing, Integrating and Analyzing Data Microsoft Access 2013 Objectives Session 8.1 Export an Access query to an HTML document and view the document Import a CSV file as an Access table Use
Minitab Study Card J ENNIFER L EWIS P RIESTLEY, PH.D.
 Minitab Study Card J ENNIFER L EWIS P RIESTLEY, PH.D. Introduction to Minitab The interface for Minitab is very user-friendly, with a spreadsheet orientation. When you first launch Minitab, you will see
Breeding Guide. Customer Services PHENOME-NETWORKS 4Ben Gurion Street, 74032, Nes-Ziona, Israel
 Breeding Guide Customer Services PHENOME-NETWORKS 4Ben Gurion Street, 74032, Nes-Ziona, Israel www.phenome-netwoks.com Contents PHENOME ONE - INTRODUCTION... 3 THE PHENOME ONE LAYOUT... 4 THE JOBS ICON...
SPSS. (Statistical Packages for the Social Sciences)
") Inger Persson SPSS (Statistical Packages for the Social Sciences) SHORT INSTRUCTIONS This presentation contains only relatively short instructions on how to perform basic statistical calculations in SPSS.
Inger Persson SPSS (Statistical Packages for the Social Sciences) SHORT INSTRUCTIONS This presentation contains only relatively short instructions on how to perform basic statistical calculations in SPSS.
Command Line and Python Introduction. Jennifer Helsby, Eric Potash Computation for Public Policy Lecture 2: January 7, 2016
 Command Line and Python Introduction Jennifer Helsby, Eric Potash Computation for Public Policy Lecture 2: January 7, 2016 Today Assignment #1! Computer architecture Basic command line skills Python fundamentals
Getting Started with JMP at ISU
 Getting Started with JMP at ISU 1 Introduction JMP (pronounced like jump ) is the new campus-wide standard statistical package for introductory statistics courses at Iowa State University. JMP is produced
Index. Bar charts, 106 bartlett.test function, 159 Bottles dataset, 69 Box plots, 113
 Index A Add-on packages information page, 186 187 Linux users, 191 Mac users, 189 mirror sites, 185 Windows users, 187 aggregate function, 62 Analysis of variance (ANOVA), 152 anova function, 152 as.data.frame
Assignment: Backgrounding and Optical Flow.
 Assignment: Backgrounding and Optical Flow. April 6, 00 Backgrounding In this part of the assignment, you will develop a simple background subtraction program.. In this assignment, you are given two videos.
Python & Spark PTT18/19
 Python & Spark PTT18/19 Prof. Dr. Ralf Lämmel Msc. Johannes Härtel Msc. Marcel Heinz The Big Picture [Aggarwal15] Plenty of Building Blocks are involved in this Big Picture Back to the Big Picture [Aggarwal15]
PART 1 PROGRAMMING WITH MATHLAB
 PART 1 PROGRAMMING WITH MATHLAB Presenter: Dr. Zalilah Sharer 2018 School of Chemical and Energy Engineering Universiti Teknologi Malaysia 23 September 2018 Programming with MATHLAB MATLAB Environment
JMP 10 Student Edition Quick Guide
 JMP 10 Student Edition Quick Guide Instructions presume an open data table, default preference settings and appropriately typed, user-specified variables of interest. RMC = Click Right Mouse Button Graphing
Automated Bioinformatics Analysis System on Chip ABASOC. version 1.1
 Automated Bioinformatics Analysis System on Chip ABASOC version 1.1 Phillip Winston Miller, Priyam Patel, Daniel L. Johnson, PhD. University of Tennessee Health Science Center Office of Research Molecular
Brief Guide on Using SPSS 10.0
 Brief Guide on Using SPSS 10.0 (Use student data, 22 cases, studentp.dat in Dr. Chang s Data Directory Page) (Page address: http://www.cis.ysu.edu/~chang/stat/) I. Processing File and Data To open a new
SAP BusinessObjects Integration Option for Microsoft SharePoint Getting Started Guide
 SAP BusinessObjects Integration Option for Microsoft SharePoint Getting Started Guide SAP BusinessObjects XI3.1 Service Pack 4 Copyright 2011 SAP AG. All rights reserved.sap, R/3, SAP NetWeaver, Duet,
Supplementary text S6 Comparison studies on simulated data
 Supplementary text S Comparison studies on simulated data Peter Langfelder, Rui Luo, Michael C. Oldham, and Steve Horvath Corresponding author: shorvath@mednet.ucla.edu Overview In this document we illustrate
GRAD6/8104; INES 8090 Spatial Statistic Spring 2017
 Lab #1 Basics in Spatial Statistics (Due Date: 01/30/2017) PURPOSES 1. Get familiar with statistics and GIS 2. Learn to use open-source software R for statistical analysis Before starting your lab, create
Using the Text Import Node
 Using the Text Import Node 1/4 Using the Text Import Node Contents You can use the Text Import node to import documents from a directory or the Web. See the following for examples of how to use the Text
An Introduction to R- Programming
 An Introduction to R- Programming Hadeel Alkofide, Msc, PhD NOT a biostatistician or R expert just simply an R user Some slides were adapted from lectures by Angie Mae Rodday MSc, PhD at Tufts University
SAS Report Viewer 8.2 Documentation
 SAS Report Viewer 8.2 Documentation About SAS Report Viewer SAS Report Viewer (the report viewer) enables users who are not report designers to view a report using a web browser. To open a report in the