Tutorial 10: Performing What-If Analyses. Microsoft Excel 2013 Enhanced
|
|
|
- Dinah Rogers
- 6 years ago
- Views:
Transcription

1 Tutorial 10: Performing What-If Analyses Microsoft Excel 2013 Enhanced
2 Objectives Explore the principles of cost-volume-profit relationships Create a one-variable data table Create a two-variable data table Create and apply different Excel scenarios with the Scenario Manager Generate a scenario summary report 2
3 Objectives Generate a scenario PivotTable report Explore the principles of a product mix Run Solver to calculate optimal solutions Create and apply constraints to a Solver model Save and load a Solver model 3

4 Visual Overview: Data Tables and What-If Analysis 2016 Cengage Learning. May not be scanned, copied or duplicated, or posted to a publicly accessible website, in whole or in part. Enhanced New Perspectives on Microsoft Excel

5 Visual Overview: Data Tables and What-If Analysis Enhanced New Perspectives on Microsoft Excel Cengage Learning. May not be scanned, copied or duplicated, or posted to a publicly accessible website, in whole or in part.
6 Understanding Cost-Volume Relationships Cost-volume-profit (CVP) analysis Studies the relationship between expenses, sales volume, and profitability Helps predict the effect of cutting overhead or raising prices on a company s net income 6
7 Understanding Cost-Volume Relationships Comparing Expenses and Revenue Types of expenses Variable expenses change in proportion to the amount of business a company does Fixed expense must be paid regardless of sales volume Mixed expense is part variable and part fixed 7
8 Understanding Cost-Volume Relationships 8
9 Understanding Cost-Volume Relationships Exploring the Break-Even Point The point where total revenue equals total expenses is called the break-even point When sales are above the break-even point, a company profits When sales are below the break even point, a company loses money CVP analysis is sometimes called break-even analysis 9
10 Understanding Cost-Volume Relationships Exploring the Break-Even Point (cont t) A CVP chart shows the relationship between total expenses and total revenue; the break-even point occurs where the two lines cross publicly accessible website, in whole or in part. Enhanced New Perspectives on Microsoft Excel
11 Understanding Cost-Volume Relationships Finding the Break-Even Point with What-if Analysis Lets you explore the impact of changing different values in a worksheet Can use to explore the impact of changing financial conditions on a company s profitability One way of finding the break-even point is to use Goal Seek, but a more efficient approach is to use a data table publicly accessible website, in whole or in part. Enhanced New Perspectives on Microsoft Excel
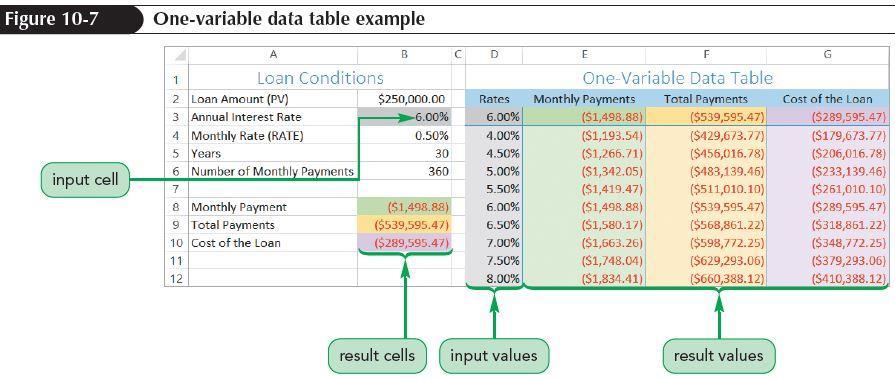
12 Working with Data Tables A data table is an Excel table that displays the results from several what-if analyses; the table consists of input cells and result cells Input cells are the cells whose value would be changed in a what-if analysis Result cells are cells whose values are impacted by the changing input values You can use one-variable data tables and twovariable data tables 12
13 Working with Data Tables Creating a One-Variable Data Table Specify one input cell and any number of result cells The range of possible values for the input cell is entered in the first row or column of the data table; the corresponding result values appear in the subsequent rows or columns Useful in business to explore how changing a single input cell can impact several financial results 13

14 Working with Data Tables 14

15 Working with Data Tables Creating a One-Variable Data Table (con t) Identify the result value cell based on input values The row input cell is used when the input values have been placed in the first row of the data table The column input cell is used when the input values are placed in the data table s first column publicly accessible website, in whole or in part. Enhanced New Perspectives on Microsoft Excel

16 Working with Data Tables Charting a One-Variable Data Table Gives a better picture of relationship between sales volume, revenue, and total expenses 16
17 Working with Data Tables Modifying a Data Table Data tables are dynamic; changes in the worksheet are automatically reflected in the data table values Includes changes to cells that are not part of the data table but are involved in the values displayed in the result cells publicly accessible website, in whole or in part. Enhanced New Perspectives on Microsoft Excel

18 Working with Data Tables Creating a Two-Variable Data Table Lets you view the relationship between two input cells, but can display only a single result value Analyzes a variety of combinations simultaneously 18

19 Working with Data Tables publicly accessible website, in whole or in part. Enhanced New Perspectives on Microsoft Excel

20 Working with Data Tables Formatting the Result Cell You can hide a cell value using the custom format text, where text is the text you want to display in place of the cell value publicly accessible website, in whole or in part. Enhanced New Perspectives on Microsoft Excel

21 Working with Data Tables publicly accessible website, in whole or in part. Enhanced New Perspectives on Microsoft Excel

22 Working with Data Tables Charting a Two-Variable Data Table You can chart the values from a two-variable data table using lines to represent the different columns of the table publicly accessible website, in whole or in part. Enhanced New Perspectives on Microsoft Excel

23 Visual Overview: What-If Scenarios 2016 Cengage Learning. May not be scanned, copied or duplicated, or posted to a publicly accessible website, in whole or in part. Enhanced New Perspectives on Microsoft Excel


24 Visual Overview: What-If Scenarios 2016 Cengage Learning. May not be scanned, copied or duplicated, or posted to a publicly accessible website, in whole or in part. Enhanced New Perspectives on Microsoft Excel

25 Developing Financial Scenarios with the Scenario Manager Create scenarios to perform a what-if analysis with more than two input cells A scenario is a defined set of values for different cells grouped under a common name 25
26 Developing Financial Scenarios with the Scenario Manager Create scenarios using the Scenario Manager Lets you define input values within a named scenario and quickly switch from one to the other Can be used to create summary reports Before using the Scenario Manager Define names for all input and result cells that you intend to use in the analysis Defined names automatically appear in reports generated by the Scenario Manager Using defined names makes it easier to work with scenarios and understand the scenario reports publicly accessible website, in whole or in part. Enhanced New Perspectives on Microsoft Excel
27 Developing Financial Scenarios with the Scenario Manager Defining a Scenario Each scenario includes a scenario name, input cells, and values for each input cell Number of scenarios is limited only by computer s memory Input cells are referred to as changing cells Contain values that are changed under the scenario Can be located anywhere in the worksheet 27


28 Developing Financial Scenarios with the Scenario Manager 28

29 Developing Financial Scenarios with the Scenario Manager publicly accessible website, in whole or in part. Enhanced New Perspectives on Microsoft Excel
30 Developing Financial Scenarios with the Scenario Manager Viewing Scenarios View the effect of each scenario by selecting it in the Scenario Manager dialog box Switch from one scenario to another by clicking the Show button in the Scenario Manager dialog box Excel automatically changes the values of the input cells to match the scenario 30

31 Developing Financial Scenarios with the Scenario Manager Editing a Scenario Edit the assumptions to view other possible outcomes Worksheet calculations are automatically updated to reflect the new scenario 31
32 Creating a Scenario Summary Report Create a report either as an Excel table or as an Excel PivotTable to compare the results from multiple scenarios on a single worksheet To create a scenario summary report, you must identify which result cells you want to include in the report The scenario summary report displays the values of the input cells and result cells under each scenario Each scenario is listed by name The current worksheet values are also displayed The report used the defined names you created 32

33 Creating a Scenario Summary Report 33

34 Creating a Scenario Summary Report A Scenario PivotTable report displays results from each scenario as a PivotTable field in a PivotTable Scenario PivotTable reports are created through the Scenario Manager used to create a summary report 34

35 Creating a Scenario Summary Report You can edit the scenario PivotTable to make it easier to read Results for a scenario PivotTable can be displayed in a PivotChart 35

36 Visual Overview: Optimal Solutions with Solver publicly accessible website, in whole or in part. Enhanced New Perspectives on Microsoft Excel

37 Visual Overview: Optimal Solutions with Solver 2016 Cengage Learning. May not be scanned, copied or duplicated, or posted to a publicly accessible website, in whole or in part. Enhanced New Perspectives on Microsoft Excel
38 Introducing Product Mix The combination of products offered by a company is known as the company s product mix Products differ in their sales price, production costs, and attractiveness to consumers A company might find that it is more profitable to devote more of its resources to selling one product over another Goal is to maximize profits while meeting the demands of the market The optimal product mix is the product mix that will result in the most profit for the company publicly accessible website, in whole or in part. Enhanced New Perspectives on Microsoft Excel


39 Introducing Product Mix publicly accessible website, in whole or in part. Enhanced New Perspectives on Microsoft Excel
40 Introducing Product Mix Different product mixes result in lower or higher profit for the company The best way to find the optimal product mix usually isn t obvious; there are too many possible combinations To find the one product mix that results in the maximum net profit for the company, you can use Solver publicly accessible website, in whole or in part. Enhanced New Perspectives on Microsoft Excel
41 Finding an Optimal Solution Using Solver Solver finds the numeric solution to a problem involving several input values Solver can: Be used to find the combination of input values that maximizes profits Be used to find a set of input values that minimizes costs Act like Goal Seek and find the input values required to match a given result publicly accessible website, in whole or in part. Enhanced New Perspectives on Microsoft Excel

42 Finding an Optimal Solution Using Solver Activating Solver Solver is an add-in a program that adds customized commands and features to Microsoft Office programs Solver might need to be activated before you can use it publicly accessible website, in whole or in part. Enhanced New Perspectives on Microsoft Excel
43 Finding an Optimal Solution Using Solver Setting the Objective Cell and Variable Cells Every Solver model needs an objective cell and one or more variable cells An objective cell is a result cell that is maximized, minimized, or set to a specific value A variable cell is an input cell that changes so that the objective cell can meet its defined goal 43

44 Finding an Optimal Solution Using Solver publicly accessible website, in whole or in part. Enhanced New Perspectives on Microsoft Excel

45 Finding an Optimal Solution Using Solver Adding Constraints to Solver Almost every Solver model needs one or more constraints A constraint is a limit that is placed on the solution Solver supports six types of constraints 45


46 Finding an Optimal Solution Using Solver 46

47 Finding an Optimal Solution Using Solver 47
48 Creating a Solver Answer Report Solver can create three different reports Answer report summarizes the results of a successful solution by displaying information about the objective cell, changing cells, and constraints Sensitivity report and limits report are often used in science and engineering to investigate the mathematical aspects of the Solver solution; these reports allow you to quantify the reliability of the solution 48

49 Creating a Solver Answer Report publicly accessible website, in whole or in part. Enhanced New Perspectives on Microsoft Excel

50 Creating a Solver Answer Report The answer report is divided into the following sections: Title Solver Engine Solver Options Objective Cell Variable Cell Constraints 50
51 Creating a Solver Answer Report The status of each constraint is listed as either Binding or Not Binding A binding constraint must be included in the Solver model and is a limiting factor in arriving at the solution A nonbinding constraint does not need to be included as part of the Solver model The Constraints section also shows the slack for each constraint; the slack is the difference between the value in the cell and the value at the limit of the constraint publicly accessible website, in whole or in part. Enhanced New Perspectives on Microsoft Excel
52 Saving and Loading Solver Models You can apply several Solver models to the same data You can store the Solver parameters for a model in worksheet cells that you can later retrieve and use to rerun that Solver model By saving the Solver model parameters to cells on the worksheet, you can create as many models as you need to effectively analyze the data You can then load and apply these different models to your analysis as new data is entered 52

53 Saving and Loading Solver Models 53
Tutorial 9. Review. Data Tables and Scenario Management. Data Validation. Protecting Worksheet. Range Names. Macros
 Tutorial 9 Data Tables and Scenario Management Review Data Validation Protecting Worksheet Range Names Macros 1 Examine cost-volume-profit relationships Suppose you were the owner of a water store. An
Customizing the Excel 2013 program window. Getting started with Excel 2013
 Customizing the Excel 2013 program window 1 2 Getting started with Excel 2013 Working with data and Excel tables Creating workbooks Modifying workbooks Modifying worksheets Merging and unmerging cells
Technology for Merchandise Planning and Control
 Contents: Technology for Merchandise Planning and Control Module Seven: Enhancing Charts Using What if Analysis REFERENCE/PAGES Enhancing Charts... Unit J 1 XL2007 Customizing a Data Series... Excel 226,
COMM 391 Winter 2014 Term 1. Tutorial 1: Microsoft Excel - Creating Pivot Table
 COMM 391 Winter 2014 Term 1 Tutorial 1: Microsoft Excel - Creating Pivot Table The purpose of this tutorial is to enable you to create Pivot Table to analyze worksheet data in Microsoft Excel. You should
Course Overview. Audience Profile. At Course Completion. Module Title : 50546A: Learn Microsoft Excel 2010 Step by Step, Level 3
 Module Title : 50546A: Learn Microsoft Excel 2010 Step by Step, Level 3 Duration : 1 day Course Overview This one-day instructor-ledcourse provides students with the skills to analyze alternative data
COMP1000 / Spreadsheets Week 2 Review
 / Spreadsheets Week 2 Review Plot chart Column chart/bar chart/pie chart Customize chart Chart style/labels/titles Add trendline Create table Create table/apply different style/print table Sort/filter
Unleash the Power of Excel
 Unleash the Power of Excel Administrative Professionals Conference, April 18, 2018 Tricia Olinger, Administrative Office Professional Program Lead Rochester Community and Technical College Tables and Charts
Excel Forecasting Tools Review
 Excel Forecasting Tools Review Duke MBA Computer Preparation Excel Forecasting Tools Review Focus The focus of this assignment is on four Excel 2003 forecasting tools: The Data Table, the Scenario Manager,
Copyright & License Notes 3 Introduction 13 Chapter 1 - Excel Basics 14. Chapter 2 - Working with Data 32
 TABLE OF CONTENTS Copyright & License Notes 3 Introduction 13 Chapter 1 - Excel Basics 14 Creating an Excel Workbook 14 Examining the Excel Environment 15 Opening an Existing Workbook 19 Navigating a Worksheet
Creating Automated Dashboard Excel 2013 Contents
 Creating Automated Dashboard Excel 2013 Contents Summarize Data Using Pivot Table... 2 Constructing Report Summary... 2 Create a PivotTable from worksheet data... 2 Add fields to a PivotTable... 2 Grouping
Tutorial 5: Working with Excel Tables, PivotTables, and PivotCharts. Microsoft Excel 2013 Enhanced
 Tutorial 5: Working with Excel Tables, PivotTables, and PivotCharts Microsoft Excel 2013 Enhanced Objectives Explore a structured range of data Freeze rows and columns Plan and create an Excel table Rename
PHLI Instruction (734) Introduction. Lists.
 Introduction. Lists.") INTERMEDIATE EXCEL Introduction Microsoft Excel has many purposes. In addition to being an excellent data manger, Excel provides the means to perform complex analysis and evaluation of data. This brief
INTERMEDIATE EXCEL Introduction Microsoft Excel has many purposes. In addition to being an excellent data manger, Excel provides the means to perform complex analysis and evaluation of data. This brief
2013 ADVANCED MANUAL
 2013 ADVANCED MANUAL C B C H O U S E 2 4 C A N N I N G S T R E E T E D I N B U R G H E H 3 8 E G 0 1 3 1 2 7 2 2 7 9 0 W W W. I T R A I N S C O T L A N D. C O. U K I N F O @ I T R A I N S C O T L A N D.
Tutorial 6: Managing Multiple Worksheets and Workbooks. Microsoft Excel 2013 Enhanced
 Tutorial 6: Managing Multiple Worksheets and Workbooks Microsoft Excel 2013 Enhanced 2 Objectives Create a worksheet group Format and edit multiple worksheets at once Create cell references to other worksheets
1. Two types of sheets used in a workbook- chart sheets and worksheets
 Quick Check Answers Session 1.1 1. Two types of sheets used in a workbook- chart sheets and worksheets 2. Identify the active cell- The active cell is surrounded by a thick border and its cell reference
Microsoft Excel Pivot Tables & Pivot Table Charts
 Microsoft Excel 2007 Pivot Tables & Pivot Table Charts A pivot table report allows you to analyze and summarize a million rows of data in Excel 2007 without entering a single formula. Pivot Tables let
Table of Contents. 1. Creating a Microsoft Excel Workbook...1 EVALUATION COPY
 Table of Contents Table of Contents 1. Creating a Microsoft Excel Workbook...1 Starting Microsoft Excel...1 Creating a Workbook...2 Saving a Workbook...3 The Status Bar...5 Adding and Deleting Worksheets...6
OTEC 1822 Microsoft Excel
 South Central College OTEC 1822 Microsoft Excel Common Course Outline Course Information Description Instructional Level Total Credits 4.00 Total Hours 64.00 Types of Instruction This course prepares students
1. Data Table. 1.1 The One-Variable Data Table
 1. Data Table Data Tables are a tool used frequently in Excel models to track how small changes in inputs affect the results of formulas in your model that are dependent on those inputs. An analysis of
Excel Tutorial 2: Formatting Workbook Text and Data
 Excel Tutorial 2: Formatting Workbook Text and Data Microsoft Office 2013 Objectives Change fonts, font style, and font color Add fill colors and a background image Create formulas to calculate sales data
Pivot Tables and Pivot Charts Activities
 PMI Online Education Pivot Tables and Pivot Charts Activities Microcomputer Applications Updated 12.16.2011 Table of Contents Objective 1: Create and Modify PivotTable Reports... 3 Organizing Data to Display
MICROSOFT Excel 2010 Advanced Self-Study
 MICROSOFT Excel 2010 Advanced Self-Study COPYRIGHT This manual is copyrighted: S&G Training Limited. This manual may not be copied, photocopied or reproduced in whole or in part without the written permission
Data Visualization via Conditional Formatting
 Data Visualization Data visualization - the process of displaying data (often in large quantities) in a meaningful fashion to provide insights that will support better decisions. Data visualization improves
New Perspectives on Microsoft Excel Module 5: Working with Excel Tables, PivotTables, and PivotCharts
 New Perspectives on Microsoft Excel 2016 Module 5: Working with Excel Tables, PivotTables, and PivotCharts Objectives, Part 1 Explore a structured range of data Freeze rows and columns Plan and create
M i c r o s o f t E x c e l A d v a n c e d P a r t 3-4. Microsoft Excel Advanced 3-4
 Microsoft Excel 2010 Advanced 3-4 0 Absolute references There may be times when you do not want a cell reference to change when copying or filling cells. You can use an absolute reference to keep a row
Excel Advanced
 Excel 2016 - Advanced LINDA MUCHOW Alexandria Technical & Community College 320-762-4539 lindac@alextech.edu Table of Contents Macros... 2 Adding the Developer Tab in Excel 2016... 2 Excel Macro Recorder...
Excel 2010 Statistics
 Excel 2010 Statistics Table of Contents Exploring Scenarios...3 What is a Scenario?... 3 Creating a Scenario... 4 Saving Multiple Scenarios... 8 Merging Scenarios... 10 Creating a Scenario Summary Report...
HOW TO USE THIS BOOK... V 1 GETTING STARTED... 2
 TABLE OF CONTENTS HOW TO USE THIS BOOK...................... V 1 GETTING STARTED.......................... 2 Introducing Data Analysis with Excel...2 Tour the Excel Window...3 Explore the Ribbon...4 Using
Instruction How To Use Excel 2007 Pivot Table Example Data Source
 Instruction How To Use Excel 2007 Pivot Table Example Data Source Excel pivot tables allow you to group the spreadsheet or external data source by any of your data fields. The screen snap below shows a
Creating a Spreadsheet by Using Excel
 The Excel window...40 Viewing worksheets...41 Entering data...41 Change the cell data format...42 Select cells...42 Move or copy cells...43 Delete or clear cells...43 Enter a series...44 Find or replace
Introducing Excel Entering Text, Numbers and Dates
 Chapter 1 Use excel to do quantitative analysis (numerical analysis) Know what rows, columns, etc. are What are the things you want to keep in mind when creating a workbook (planning, etc.)? Three different
Content-Based Assessments
 GO! Fix It Project H Park Revenue For Project H, you will need the following file: e0h_park_revenue Lastname_Firstname_H_Park_Revenue Open the file e0h_park_revenue, and then save the file in your Excel
STUDENT LEARNING OUTCOMES
 Extended Learning Module D Decision Analysis with Spreadsheet Software STUDENT LEARNING OUTCOMES 1. Define a list and list definition table within the context of spreadsheet software and describe the importance
Microsoft Excel Pivot Tables & Pivot Table Charts
 Microsoft Excel 2013 Pivot Tables & Pivot Table Charts A pivot table report allows you to analyze and summarize a million rows of data in Excel 2013 without entering a single formula. Pivot Tables let
Syllabus KCXXXXXX: Excel Level I, Version 2010
 Syllabus KCXXXXXX: Excel Level I, Version 2010 ITSW 1022 Introduction to Electronic Spreadsheets 8 classroom hours Course Description: This course is designed to introduce the student to basic spreadsheet
Englische Access 2016-Trainingsskripte für IT Seminare und EDV Schulungen als Word-Dokument zum Ausdrucken und fürs Intranet
 Englische Access 2016-Trainingsskripte für IT Seminare und EDV Schulungen als Word-Dokument zum Ausdrucken und fürs Intranet 9 Data analyses To analyze data, a tabular preparation of the data or a chart
GO! with Microsoft Excel 2016 Comprehensive
 GO! with Microsoft Excel 2016 Comprehensive First Edition Chapter 7 Creating PivotTables and PivotCharts Learning Objectives Create a PivotTable Report Use Slicers and Search Filters Modify a PivotTable
EVALUATION ONLY. Table of Contents. iv Labyrinth Learning
 Quick Reference Tables Preface EXCEL 2013 LESSON 1: EXPLORING EXCEL 2013 Presenting Excel 2013 Starting Excel Windows 7 Windows 8 Exploring the Excel Program Window Using Worksheets and Workbooks Mousing
Mathematical Operators for Excel
 EXCEL ADVANCED 1 Mathematical Operators for Excel < > = >=
Chapter at a glance. Templates. Link. Consolidate. Use workbooks as templates for other workbooks, page 196
 Chapter at a glance Templates Use workbooks as templates for other workbooks, page 196 Link Link to data in other worksheets and workbooks, page 204 Consolidate Consolidate multiple sets of data into a
1. In the accompanying figure, the months were rotated by selecting the text and dragging the mouse pointer up and to the right.
 Excel: Chapter 3 True/False Indicate whether the statement is true or false. Figure 3-3 1. In the accompanying figure, the months were rotated by selecting the text and dragging the mouse pointer up and
Microsoft Excel 2016 Level 1
 Microsoft Excel 2016 Level 1 One Day Course Course Description You have basic computer skills such as using a mouse, navigating through windows, and surfing the Internet. You have also used paper-based
Microsoft Office Excel 2010: Intermediate (R2) Course Overview. Course Outline
 Course Overview. Course Outline") Microsoft Office Excel 2010: Intermediate (R2) Course Overview This course builds on the skills and concepts taught in Excel 2010: Basic, First Look Edition. Students will learn how to use multiple worksheets
Microsoft Office Excel 2010: Intermediate (R2) Course Overview This course builds on the skills and concepts taught in Excel 2010: Basic, First Look Edition. Students will learn how to use multiple worksheets
Excel Tables & PivotTables
 Excel Tables & PivotTables A PivotTable is a tool that is used to summarize and reorganize data from an Excel spreadsheet. PivotTables are very useful where there is a lot of data that to analyze. PivotTables
ABOUT PIVOTTABLES TABLE OF CONTENTS
 University of Southern California Academic Information Services Excel 2007 - PivotTables ABOUT PIVOTTABLES PivotTables provide an excellent means of analyzing data stored in database format by rearranging
Advance Excel Performing calculations on data 1. Naming groups of data 2. Creating formulas to calculate values
 Advance Excel 2013 Getting started with Excel 2013 1. Identifying the different Excel 2013 programs 2. Identifying new features of Excel 2013 a. If you are upgrading from Excel 2010 b. If you are upgrading
Consolidate and Summarizing Data from Multiple Worksheets
 Consolidate and Summarizing Data from Multiple Worksheets There are a few methods to summarize data from different worksheets in a workbook. You can use the Consolidate command, in the Data Tools group
Corporate essentials
 Microsoft Office Excel 2016, Corporate essentials A comprehensive package for corporates and government organisations Knowledge Capital London transforming perfomance through learning MS OFFICE EXCEL 2016
Lesson 6: Modeling Basics
 Lesson 6: Modeling Basics MyEducator Issues? So you did everything and received a zero Make sure you don t change the file name If you have done work in Filename(2) or Filename-2 Happens when you download
How to Create and Use a Pivot Table in Excel
 How to Create and Use a Pivot Table in Excel Nikki Casasanto What you need Microsoft Office: Excel 2013 Data Why use a Pivot Table? Microsoft Excel pivot tables offer a way to quickly summarize data. It
PRACTICAL EXERCISE 1.1.6b
 PRACTICAL EXERCISE 1.1.6b PLAN, SELECT & USE APPROPRIATE IT SYSTEMS & SOFTWARE 1. Explain the purpose for using IT. EXPLAIN THE PURPOSE FOR USING IT a) Explain the type of document that is to be produced
Office 2016 Excel Basics 21 Video/Class Project #33 Excel Basics 21: Relationships Rather than VLOOKUP for PivotTable Reports (Excel 2016 Data Model)
") Office 2016 Excel Basics 21 Video/Class Project #33 Excel Basics 21: Relationships Rather than VLOOKUP for PivotTable Reports (Excel 2016 Data Model) Goal in video # 21: Learn about how to use the Relationships
Office 2016 Excel Basics 21 Video/Class Project #33 Excel Basics 21: Relationships Rather than VLOOKUP for PivotTable Reports (Excel 2016 Data Model) Goal in video # 21: Learn about how to use the Relationships
ADVANCED EXCEL Course Modules for Advance Excel Training Online (MS Excel 2013 Course):
:") Course Modules for Advance Excel Training Online (MS Excel 2013 Course): ADVANCED EXCEL 2013 1 Getting started with Excel 2013 A Identifying the different Excel 2013 programs B Identifying new features
Course Modules for Advance Excel Training Online (MS Excel 2013 Course): ADVANCED EXCEL 2013 1 Getting started with Excel 2013 A Identifying the different Excel 2013 programs B Identifying new features
Making EXCEL Work for YOU!
 Tracking and analyzing numerical data is a large component of the daily activity in today s workplace. Microsoft Excel 2003 is a popular choice among individuals and companies for organizing, analyzing,
How to insert table in Excel?
 What is Table in Excel? Tables allow you to analyze your data in Excel quickly and easily. How to insert table in Excel? To insert a table, execute the following steps. 1. Click any single cell inside
EXCEL 2016 SERIES AT NORTH SEATTLE COLLEGE
 EXCEL 2016 SERIES AT NORTH SEATTLE COLLEGE Instructor: Instructor Email: Website: Class Days/Times: Course Duration Mikel Anne Aldrich Mikel.Aldrich@seattlecolleges.edu www.aldrichcorptech.com Saturdays,
Microsoft Excel Expert 2010, Objective Domain
 Exam Design 77 888 Microsoft Excel Expert 2010, Objective Domain The Basics This is a Technical Specialist exam designed to assess candidates hands on skills using Microsoft Office Excel 2010 at the Expert
Excel 2007 Pivot Table Sort Column Headings
 Excel 2007 Pivot Table Sort Column Headings Pivot table is not used for sorting and filtering, it is used for summarizing and reporting. labels and col5 to values, as shown in the figure above (col1, col2
DESCRIPTION 1 TO DEFINE A NAME 2. USING RANGE NAMES 2 Functions 4 THE IF FUNCTION 4 THE VLOOKUP FUNCTION 5 THE HLOOKUP FUNCTION 6
 Table of contents The use of range names 1 DESCRIPTION 1 TO DEFINE A NAME 2 USING RANGE NAMES 2 Functions 4 THE IF FUNCTION 4 THE VLOOKUP FUNCTION 5 THE HLOOKUP FUNCTION 6 THE ROUND FUNCTION 7 THE SUMIF
Microsoft Office 2011 for Mac: Introductory Q&As Excel Chapter 3
 Microsoft Office 2011 for Mac: Introductory Q&As Excel Chapter 3 What if Excel automatically opens a workbook when I start Excel? (EX 139) If you had a workbook open when you last quit Excel, Excel will,
Microsoft Office Excel Create a worksheet group. A worksheet group. Tutorial 6 Working With Multiple Worksheets and Workbooks
 Microsoft Office Excel 2003 Tutorial 6 Working With Multiple Worksheets and Workbooks 1 Create a worksheet group A workbook is a collection of worksheets. You may want to work with the worksheets within
SBCUSD IT Training Program. MS Excel lll. VLOOKUPS, PivotTables, Macros, and More
 SBCUSD IT Training Program MS Excel lll VLOOKUPS, PivotTables, Macros, and More Revised 10/25/2018 TABLE OF CONTENTS VLOOKUP...2 VLOOLUP...2 SUMIF...3 SUMIF...3 PivotTable...4 Create PivotTable...4 Build
Since its earliest days about 14 years ago Access has been a relational
 Storing and Displaying Data in Access Since its earliest days about 14 years ago Access has been a relational database program, storing data in tables and using its own queries, forms, and reports to sort,
Acknowledgements About the Author Starting off on the Right Foot p. 1 Basic Terminology p. 2 Title Bar p. 3 Menu Bar p. 3 Active Cell p.
 Acknowledgements p. a About the Author p. e Starting off on the Right Foot p. 1 Basic Terminology p. 2 Title Bar p. 3 Menu Bar p. 3 Active Cell p. 3 Toolbar Collections p. 3 Toolbar Collections p. 4 Help
COURSE CONTENT EXCEL BASIC ONE DAY
 COURSE CONTENT EXCEL BASIC ONE DAY SOME OF THE BENEFITS OF USING A SPREADSHEET STARTING EXCEL GETTING YOURSELF ORIENTATED WITH THE EXCEL SCREEN THE OFFICE BUTTON/FILE TAB THE TITLE BAR THE RIBBONS GROUPS
Microsoft Office Excel 2010: Advanced. Course Overview. Course Length: 1 Day. Course Overview
 Microsoft Office Excel 2010: Advanced Course Length: 1 Day Course Overview This course builds on the skills and concepts taught in Excel 2010: Intermediate. Students will work with advanced formulas, as
Learning Microsoft Excel Module 1 Contents. Chapter 1: Introduction to Microsoft Excel
 Module 1 Contents Chapter 1: Introduction to Microsoft Excel The Microsoft Excel Screen...1-1 Moving the Cursor...1-3 Using the Mouse...1-3 Using the Arrow Keys...1-3 Using the Scroll Bars...1-4 Moving
Assignment 1 MIS Spreadsheet (Excel)
") Assignment 1 MIS Spreadsheet (Excel) Summary Create a Microsoft Excel file with six worksheets that provides extensive use of Excel capabilities including: importing data, formatting data in tables, summarizing
Assignment 1 MIS Spreadsheet (Excel) Summary Create a Microsoft Excel file with six worksheets that provides extensive use of Excel capabilities including: importing data, formatting data in tables, summarizing
Key concepts through Excel Basic videos 01 to 25
 Key concepts through Excel Basic videos 01 to 25 1) Row and Colum make up Cell 2) All Cells = Worksheet = Sheet 3) Name of Sheet is in Sheet Tab 4) All Worksheets = Workbook File 5) Default Alignment In
Linear Programming: Basic Concepts. Chapter 2: Hillier and Hillier
 Linear Programming: Basic Concepts Chapter 2: Hillier and Hillier Agenda Define Linear Programming The Case of the Wyndor Glass Co. A Maximization Problem Developing a Mathematical Representation of Wyndor
Why Spreadsheets and Microsoft Excel? Spreadsheets are the most common, general purpose software for data analysis and reporting.
 DATA 301 Introduction to Data Analytics Spreadsheets: Microsoft Excel Dr. Ramon Lawrence University of British Columbia Okanagan ramon.lawrence@ubc.ca DATA 301: Data Analytics (2) Why Spreadsheets and
DATA 301 Introduction to Data Analytics Spreadsheets: Microsoft Excel
 DATA 301 Introduction to Data Analytics Spreadsheets: Microsoft Excel Dr. Ramon Lawrence University of British Columbia Okanagan ramon.lawrence@ubc.ca DATA 301: Data Analytics (2) Why Spreadsheets and
Microsoft Office Illustrated. Analyzing Table Data
 Analyzing Table Data Objectives Filter a Table Create a custom filter Filter a Table with Advanced Filter Extract Table data 2 Objectives Look up values in a table Summarize table data Validate table data
WHY USE EXCEL? KEY EXCEL TERMINOLOGY
 WHY USE EXCEL? Excel allows users to organize, format, and calculate data with formulas using a spreadsheet system broken up by rows and columns. Excel allows us the ability to create templates with multiple
Office Applications II Lesson Objectives
 Office Applications II Lesson Unit 1: MICROSOFT EXCEL SPREADSHEETS BASICS What is a Spreadsheet and What Are Its Uses? Define spreadsheets Define the Microsoft Excel application List business, consumer,
1. Introduction to Microsoft Excel
 1. Introduction to Microsoft Excel A spreadsheet is an online version of an accountant's worksheet, which can automatically do most of the calculating for you. You can do budgets, analyze data, or generate
Excel 2010: A Case Approach
 THE O'LEARY SERIES COMPLETE EDITION Excel 2010: A Case Approach Timothy J. O'Leary Professor Emeritus, Arizona State University Linda I. O'Leary Mc Learn Succeed' ar ) Connect # Introduction to Microsoft
More Skills 12 Create Web Queries and Clear Hyperlinks
 CHAPTER 9 Excel More Skills 12 Create Web Queries and Clear Hyperlinks Web queries are requests that are sent to web pages to retrieve and display data in Excel workbooks. Web queries work best when retrieving
EXCEL ADVANCED Linda Muchow
 EXCEL ADVANCED 2016 Alexandria Technical and Community College Customized Training Technology Specialist 1601 Jefferson Street, Alexandria, MN 56308 320-762-4539 Linda Muchow lindac@alextech.edu 1 Table
COMM 391 Winter 2014 Term 1. Tutorial 2: Microsoft Excel Using VLookUp and Creating PivotChart
 COMM 391 Winter 2014 Term 1 Tutorial 2: Microsoft Excel Using VLookUp and Creating PivotChart The purpose of this tutorial is to enable you to learn how to use the VLookUp function and create a PivotChart
Taking a First Look at Excel s Reporting Tools
 CHAPTER 1 Taking a First Look at Excel s Reporting Tools This chapter provides you with an overview of Excel s reporting features. It shows you the principal types of Excel reports and how you can use
Creating Custom Financial Statements Using
 Creating Custom Financial Statements Using Steve Collins Sage 50 Solution Provider scollins@iqacct.com 918-851-9713 www.iqaccountingsolutions.com Financial Statement Design Sage 50 Accounting s built in
Learning Microsoft Excel Module 1 Contents. Chapter 1: Introduction to Microsoft Excel
 Module 1 Contents Chapter 1: Introduction to Microsoft Excel Loading Microsoft Excel...1-1 The Microsoft Excel Screen...1-2 Moving the Cursor...1-4 Using the Mouse...1-4 Using the Arrow Keys...1-4 Using
Excel Basic 1 GETTING ACQUAINTED WITH THE ENVIRONMENT 2 INTEGRATION WITH OFFICE EDITING FILES 4 EDITING A WORKBOOK. 1.
 Excel Basic 1 GETTING ACQUAINTED WITH THE ENVIRONMENT 1.1 Introduction 1.2 A spreadsheet 1.3 Starting up Excel 1.4 The start screen 1.5 The interface 1.5.1 A worksheet or workbook 1.5.2 The title bar 1.5.3
Math 2524: Activity 1 (Using Excel) Fall 2002
 Fall 2002") Math 2524: Activity 1 (Using Excel) Fall 22 Often in a problem situation you will be presented with discrete data rather than a function that gives you the resultant data. You will use Microsoft Excel
Math 2524: Activity 1 (Using Excel) Fall 22 Often in a problem situation you will be presented with discrete data rather than a function that gives you the resultant data. You will use Microsoft Excel
Excel 2003 Tutorials - Video File Attributes
 Using Excel Files 18.00 2.73 The Excel Environment 3.20 0.14 Opening Microsoft Excel 2.00 0.12 Opening a new workbook 1.40 0.26 Opening an existing workbook 1.50 0.37 Save a workbook 1.40 0.28 Copy a workbook
Microsoft Excel Chapter 3. Working with Large Worksheets, Charting, and What-If Analysis
 Microsoft Excel 2013 Chapter 3 Working with Large Worksheets, Charting, and What-If Analysis Objectives Rotate text in a cell Create a series of month names Copy, paste, insert, and delete cells Format
New Perspectives on Microsoft Excel Module 1: Getting Started with Excel
 New Perspectives on Microsoft Excel 2016 Module 1: Getting Started with Excel 1 Objectives, Part 1 Open and close a workbook Navigate through a workbook and worksheet Select cells and ranges Plan and create
Pivot Tables, Lookup Tables and Scenarios
 Introduction Format and manipulate data using pivot tables. Using a grading sheet as and example you will be shown how to set up and use lookup tables and scenarios. Contents Introduction Contents Pivot
Tutorial 8: Working with Advanced Functions. Microsoft Excel 2013 Enhanced
 Tutorial 8: Working with Advanced Functions Microsoft Excel 2013 Enhanced Objectives Use the IF function Use the AND function Use the OR function Use structured references in formulas Nest the IF function
Let s start by examining an Excel worksheet for the linear programming. Maximize P 70x 120y. subject to
 Excel is a useful tool for solving linear programming problems. In this question we ll solve and analyze our manufacturing problem with Excel. Although this problem can easily be solved graphically or
Integrating Microsoft Office Learn about object linking and embedding (OLE) Tutorial 1 Integrating Word and Excel
 Tutorial 1 Integrating Word and Excel") Integrating Microsoft Office 2003 Integrating Word and Excel 1 Learn about object linking and embedding (OLE) You can easily share data that you create in different Office applications through object linking
Integrating Microsoft Office 2003 Integrating Word and Excel 1 Learn about object linking and embedding (OLE) You can easily share data that you create in different Office applications through object linking
Patricia Andrada Quick Guide Excel 2010 Data Management-July 2011 Page 1
 Patricia Andrada Quick Guide Excel 2010 Data Management-July 2011 Page 1 Excel 2010 Data Management AutoFill and Custom Lists AutoFill 1. Select the range that contains the initial value(s) of the series
Formatting Spreadsheets in Microsoft Excel
 Formatting Spreadsheets in Microsoft Excel This document provides information regarding the formatting options available in Microsoft Excel 2010. Overview of Excel Microsoft Excel 2010 is a powerful tool
Pivot Table Project. Objectives. By the end of this lesson, you will be able to:
 Pivot Table Project Objectives By the end of this lesson, you will be able to: Set up a Worksheet Enter Labels and Values Use Sum and IF functions Format and align cells Change column width Use AutoFill
Creating an Excel Pivot Table Manually
 It is easy to use Recommended PivotTables option for creating pivot tables. But you might prefer to create a pivot table manually. Prior to Excel 2013, manually creating a pivot table was your only option.
SAMaRT User Guide Microsoft Excel (Advanced version)
") SAMaRT User Guide Microsoft Excel (Advanced version) Before you start...2 Macros...2 Exploring the tool...2 Using the tool for the first time...3 Introduction page...3 Changing the drop down list options...3
SAMaRT User Guide Microsoft Excel (Advanced version) Before you start...2 Macros...2 Exploring the tool...2 Using the tool for the first time...3 Introduction page...3 Changing the drop down list options...3
Creating a Pivot Table
 Contents Introduction... 1 Creating a Pivot Table... 1 A One-Dimensional Table... 2 A Two-Dimensional Table... 4 A Three-Dimensional Table... 5 Hiding and Showing Summary Values... 5 Adding New Data and
WAAT-PivotTables Accounting Seminar
 WAAT-PivotTables-08-26-2016-Accounting Seminar Table of Contents What does a PivotTable do?... 2 How to create PivotTable:... 2 Add conditions to the PivotTable:... 2 Grouping Daily Dates into Years, Quarters,
Excel. More Skills 11 Insert and Edit Comments. To complete this workbook, you will need the following file: You will save your workbook as: CHAPTER 2
 CHAPTER 2 Excel More Skills 11 Insert and Edit Comments A comment is a note that is attached to a cell, separate from other cell content. Comments can describe how a complex formula works or provide feedback