Using Prometheus with InfluxDB for metrics storage
|
|
|
- Mabel Boyd
- 6 years ago
- Views:
Transcription


1 Using Prometheus with InfluxDB for metrics storage Roman Vynar Senior Site Reliability Engineer, Quiq September 26, 2017


2 About Quiq Quiq is a messaging platform for customer service. We monitor all our infrastructure with 1 Prometheus: 190 targets, 190K time-series, 10K samples/sec ingestion rate. We store customer-related and developer metrics of all the micro-services in InfluxDB using in-house InfluxDB HA implementation. 2

3 3 Time-series databases

4 Prometheus Prometheus is 100% open-source and community-driven Modern and efficient Multi-dimensional data model Collection via pull model Powerful query language and HTTP API Service discovery Alerting toolkit and integrations Federation of Prometheis 4

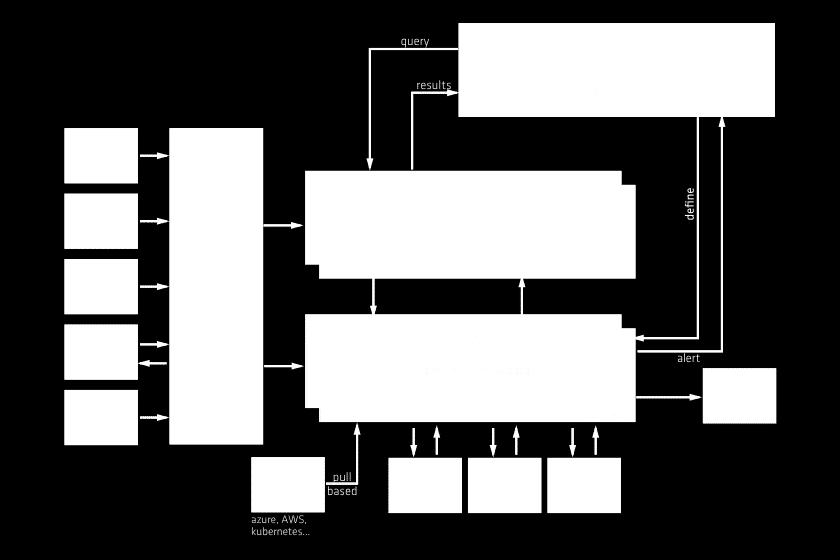
5 5 Prometheus architecture


6 InfluxDB Open-source and commercial offering Modern and efficient Multi-dimensional data model Collection via push model SQL and HTTP API A component of a full-stack platform Backup and restore Clustering (proprietary, commercial) 6

7 7 InfluxDB architecture
8 Time-series structure Prometheus: metric{job=" ", instance=" ", label1=" ", label2=" "} float64 timestamp (ms) gauge counter histogram summary InfluxDB: db.retention.measurement tag1=" ",tag2=".." field1=bool,field2="string",field3=int float64 timestamp (ns) 8
9 Prometheus vs InfluxDB Feature Prometheus InfluxDB Metrics collection model Pull Push Storage Ephemeral Long-lived Data retention A single, global Multiple, per database Service discovery Built-in N/A Clustering Federation Commercial Downsampling Recording rules Continuous queries Query language PromQL InfluxSQL Backup and restore Another prom instance Binary and raw formats Integrations Components, 3rd-party TICK stack, 3rd-party 9
10 Prometheus and pull Prometheus scrapes metrics from remote exporters Configurable frequency of scraping Relabeling Simple protocol-buffer or text-based exposition format Custom on-demand metrics via textfile collector of node_exporter "Push" is also possible via pushgateway 10
11 Prometheus storage and retention A sophisticated local storage subsystem Chunks of constant size for the bulk sample data LevelDB for indexes Circular global retention Not really designed for long-term storage 11
12 Prometheus service discovery Service discovery out the box DNS Consul AWS GCP Azure Kubernetes Openstack Dynamic and flexible configuration 12
13 Prometheus federation Federation allows a Prometheus server to scrape selected time series from another Prometheus server. Hierarchical federation Cross-service federation 13
14 Prometheus recording rules Recording rules allow you to precompute frequently needed or expensive expressions and save their result as a new set of time series Can be used for downsampling 14
15 PromQL Prometheus provides a functional expression language that lets the user select and aggregate time series data in real time. Cross-metric queries Grouping and joins Functions over functions 15
16 Prometheus and backups No backup mechanism However, you can run multiple Prometheus instances to do exactly the same job to keep a standby copy. 16
17 Prometheus integrations Grafana Alertmanager Dropwizard, Gitlab, Docker, etc. InfluxDB: read, write OpenTSDB: write Chronix: write Graphite: write PostgreSQL/TimescaleDB: read, write 17
18 Prometheus vs InfluxDB Feature Prometheus InfluxDB Metrics collection model Pull Push Storage Ephemeral Long-lived Data retention A single, global Multiple, per database Service discovery Built-in N/A Clustering Federation Commercial Downsampling Recording rules Continuous queries Query language PromQL InfluxSQL Backup and restore Another prom instance Binary and raw formats Integrations Components, 3rd-party TICK stack, 3rd-party 18
19 InfluxDB and push Telegraph pushes samples to InfluxDB There are 100+ plugins for Telegraphs "Push" on demand 19
20 InfluxDB storage and retention Compressed and encoded data are organized in shards with duration Shards are grouped into shard groups by time and duration Multiple databases Multiple retentions per database Each database has its own set of WAL and TSM files 20
21 InfluxDB downsampling Configurable retentions per database Continuous queries across retentions and databases Flexible time grouping, resampling intervals and offsets Commercial clustering ensures the data is copied to X replicas 21
22 InfluxQL SQL-like language Schema exploration Flexible grouping by time intervals No joins No functions over functions 22
23 InfluxDB backup and restore Built-in backup/restore tool Backup/restore a specific database/retention/shard Backup since a specific date Separate backup of datastore and metastore HTTP API allows for a plain-text backup/restore too 23
24 InfluxDB integrations Kapacitor Chronograf Grafana Remote read/write by Prometheus 24

25 Prometheus vs InfluxDB Feature Prometheus InfluxDB Metrics collection model Pull Push Storage Ephemeral Long-lived Data retention A single, global Multiple, per database Service discovery Built-in N/A Clustering Federation Commercial Downsampling Recording rules Continuous queries Query language PromQL InfluxSQL Backup and restore Another prom instance Binary and raw formats Integrations Components, 3rd-party TICK stack, 3rd-party 25

26 Prometheus + InfluxDB Feature Prometheus InfluxDB Metrics collection model Pull Push Storage Ephemeral Long-lived Data retention A single, global Multiple, per database Service discovery Built-in N/A Clustering Federation Commercial Downsampling Recording rules Continuous queries Query language PromQL SQL Backup and restore Another prom instance Binary and raw formats Integrations Components, 3rd-party TICK stack, 3rd-party 26
27 What is better? InfluxDB: For event logging. Commercial option offers clustering for InfluxDB, which is also better for long term data storage. Eventually consistent view of data between replicas. Prometheus: Primarily for metrics. More powerful query language, alerting, and notification functionality. Higher availability and uptime for graphing and alerting. 27

: https://www.influxdata.")
28 Prometheus and InfluxDB integration Currently, there are 2 options: 1. Using remote_storage_adapter: documentation/examples/remote_storage/remote_storage_adapter 2. Writing to InfluxDB directly (nightly builds of not yet released v1.4): (posted on Sep 14, 2017) 28
29 Prometheus and InfluxDB integration Prometheus Adapter InfluxDB 29
30 docker-compose.yml $ cat PL17-Dublin/docker-compose.yml version: '2' services: prom: image: prom/prometheus:v1.7.1 command: -storage.local.path="/promdata" ports: - "9090:9090" volumes: -./prometheus.yml:/prometheus/prometheus.yml:ro -./promdata:/promdata 30 influxdb: image: influxdb:1.3.5 command: -config /etc/influxdb/influxdb.conf ports: - "8086:8086" volumes: -./influxdata:/var/lib/influxdb
31 Running InfluxDB docker-compose up -d influxdb docker exec -ti pl17dublin_influxdb_1 influx > CREATE USER "admin" WITH PASSWORD 'admin' WITH ALL PRIVILEGES; docker exec -ti pl17dublin_influxdb_1 bash > influx >> auth >> CREATE DATABASE prometheus; >> CREATE USER "prom" with password 'prom'; >> GRANT ALL ON prometheus TO prom; >> ALTER RETENTION POLICY "autogen" ON "prometheus" DURATION 1d REPLICATION 1 SHARD DURATION 1d DEFAULT; >> SHOW RETENTION POLICIES ON prometheus; 31
32 Running remote_storage_adapter go get github.com/prometheus/prometheus/documentation/examples/ remote_storage/remote_storage_adapter INFLUXDB_PW=prom $GOPATH/bin/remote_storage_adapter -influxdb-url= -influxdb.username=prom -influxdb.database=prometheus -influxdb.retention-policy=autogen 32
33 Prometheus config file global: scrape_interval: 1s scrape_timeout: 1s scrape_configs: - job_name: prometheus static_configs: - targets: ['localhost:9090'] labels: instance: prom remote_write: - url: 33
34 Running Prometheus and verification docker-compose up -d prom docker logs pl17dublin_prom_1 docker logs -f --tail 10 pl17dublin_influxdb_1 docker exec -ti pl17dublin_influxdb_1 bash > influx >> auth >> USE prometheus; >> SHOW MEASUREMENTS; 34
35 Downsampling with InfluxDB CREATE DATABASE trending; CREATE RETENTION POLICY "1m" ON trending DURATION 0s REPLICATION 1 SHARD DURATION 1w DEFAULT; CREATE RETENTION POLICY "5m" ON trending DURATION 0s REPLICATION 1 SHARD DURATION 1w DEFAULT; SHOW RETENTION POLICIES ON trending; USE prometheus; CREATE CONTINUOUS QUERY scrape_samples_scraped_1m ON prometheus BEGIN SELECT LAST(value) as "value" INTO trending."1m".scrape_samples_scraped FROM scrape_samples_scraped GROUP BY time(1m) END; CREATE CONTINUOUS QUERY scrape_samples_scraped_5m ON prometheus BEGIN SELECT LAST(value) as "value" INTO trending."5m".scrape_samples_scraped FROM scrape_samples_scraped GROUP BY time(5m) END; SHOW CONTINUOUS QUERIES; USE trending; SHOW MEASUREMENTS; SHOW SHARDS; SELECT * FROM trending."1m".scrape_samples_scraped; 35
36 Prometheus remote read (proxy to InfluxDB) $ cat PL17-Dublin/docker-compose.yml version: '2' services: promread: image: prom/prometheus:v1.7.1 command: -storage.local.engine=none ports: - "9091:9090" volumes: -./promread.yml:/prometheus/prometheus.yml:ro 36
37 Prometheus remote read Prometheus configuration: remote_read: - url: Start Prometheus with the above config: docker-compose up -d prom read 37
38 Questions? Thank you! 38
@InfluxDB. David Norton 1 / 69
 @InfluxDB David Norton (@dgnorton) david@influxdb.com 1 / 69 Instrumenting a Data Center 2 / 69 3 / 69 4 / 69 The problem: Efficiently monitor hundreds or thousands of servers 5 / 69 The solution: Automate
The Art of Container Monitoring. Derek Chen
 The Art of Container Monitoring Derek Chen 2016.9.22 About me DevOps Engineer at Trend Micro Agile transformation Micro service and cloud service Docker integration Monitoring system development Automate
Hynek Schlawack. Get Instrumented. How Prometheus Can Unify Your Metrics
 Hynek Schlawack Get Instrumented How Prometheus Can Unify Your Metrics Goals Goals Goals Goals Goals Service Level Service Level Indicator Service Level Indicator Objective Service Level Indicator Objective
Monitoring MySQL Performance with Percona Monitoring and Management
 Monitoring MySQL Performance with Percona Monitoring and Management Santa Clara, California April 23th 25th, 2018 MIchael Coburn, Product Manager Your Presenter Product Manager for PMM (also Percona Toolkit
Prometheus as a (internal) service. Paul Traylor LINE Fukuoka
 service. Paul Traylor LINE Fukuoka") Prometheus as a (internal) service Paul Traylor LINE Fukuoka Self-Introduction Wanted to make games in high school Worked on several mods creating levels Decided games were hard, web development looked
Prometheus as a (internal) service Paul Traylor LINE Fukuoka Self-Introduction Wanted to make games in high school Worked on several mods creating levels Decided games were hard, web development looked
Open Source Database Performance Optimization and Monitoring with PMM. Fernando Laudares, Vinicius Grippa, Michael Coburn Percona
 Open Source Database Performance Optimization and Monitoring with PMM Fernando Laudares, Vinicius Grippa, Michael Coburn Percona Fernando Laudares 2 Vinicius Grippa 3 Michael Coburn Product Manager for
Search Engines and Time Series Databases
 Università degli Studi di Roma Tor Vergata Dipartimento di Ingegneria Civile e Ingegneria Informatica Search Engines and Time Series Databases Corso di Sistemi e Architetture per Big Data A.A. 2017/18
Search and Time Series Databases
 Università degli Studi di Roma Tor Vergata Dipartimento di Ingegneria Civile e Ingegneria Informatica Search and Time Series Databases Corso di Sistemi e Architetture per Big Data A.A. 2016/17 Valeria
Monitoring MySQL with Prometheus & Grafana
 Monitoring MySQL with Prometheus & Grafana Julien Pivotto (@roidelapluie) Percona University Belgium June 22nd, 2017 SELECT USER(); Julien "roidelapluie" Pivotto @roidelapluie Sysadmin at inuits Automation,
Prometheus For Big & Little People Simon Lyall
 Prometheus For Big & Little People Simon Lyall Sysadmin (it says DevOps Engineer in my job title) Large Company, Auckland, New Zealand Use Prometheus at home on workstations, home servers and hosted Vms
Monitoring MySQL Performance with Percona Monitoring and Management
 Monitoring MySQL Performance with Percona Monitoring and Management Your Presenters Michael Coburn - PMM Product Manager Working at Percona for almost 5 years Consultant, Manager, TAM, now Product Manager
Road to Auto Scaling
 Road to Auto Scaling Varun Thacker Lucidworks Apache Lucene/Solr Committer, and PMC member Agenda APIs Metrics Recipes Auto-Scale Triggers SolrCloud Overview ZooKee per Lots Shard 1 Leader Shard 3 Replica
Operating Within Normal Parameters: Monitoring Kubernetes
 Operating Within Normal Parameters: Monitoring Kubernetes Elana Hashman Two Sigma Investments, LP SREcon 2019 Americas Brooklyn, NY Disclaimer This document is being distributed for informational and educational
Chronix A fast and efficient time series storage based on Apache Solr. Caution: Contains technical content.
 Chronix A fast and efficient time series storage based on Apache Solr Caution: Contains technical content. 68.000.000.000* time correlated data objects. How to store such amount of data on your laptop
Rethinking monitoring with Prometheus
 Rethinking monitoring with Prometheus Martín Ferrari Štefan Šafár http://tincho.org @som_zlo Who is Prometheus? A dude who stole fire from Mt. Olympus and gave it to humanity http://prometheus.io/ What
Real-time monitoring Slurm jobs with InfluxDB September Carlos Fenoy García
 Real-time monitoring Slurm jobs with InfluxDB September 2016 Carlos Fenoy García Agenda Problem description Current Slurm profiling Our solution Conclusions Problem description Monitoring of jobs is becoming
Staleness and Isolation in Prometheus 2.0. Brian Brazil Founder
 Staleness and Isolation in Prometheus 2.0 Brian Brazil Founder Who am I? One of the core developers of Prometheus Founder of Robust Perception Primary author of Reliable Insights blog Contributor to many
Using PostgreSQL, Prometheus & Grafana for Storing, Analyzing and Visualizing Metrics
 Using PostgreSQL, Prometheus & Grafana for Storing, Analyzing and Visualizing Metrics Erik Nordström, PhD Core Database Engineer hello@timescale.com github.com/timescale Why PostgreSQL? Reliable and familiar
Time Series Live 2017
 1 Time Series Schemas @Percona Live 2017 Who Am I? Chris Larsen Maintainer and author for OpenTSDB since 2013 Software Engineer @ Yahoo Central Monitoring Team Who I m not: A marketer A sales person 2
Open-Falcon A Distributed and High-Performance Monitoring System. Yao-Wei Ou & Lai Wei 2017/05/22
 Open-Falcon A Distributed and High-Performance Monitoring System Yao-Wei Ou & Lai Wei 2017/05/22 Let us begin with a little story Grafana PR#3787 [feature] Add Open-Falcon datasource I'm sorry but we will
Chronix: Long Term Storage and Retrieval Technology for Anomaly Detection in Operational Data
 Chronix: Long Term Storage and Retrieval Technology for Anomaly Detection in Operational Data FAST 2017, Santa Clara Florian Lautenschlager, Michael Philippsen, Andreas Kumlehn, and Josef Adersberger Florian.Lautenschlager@qaware.de
PostgreSQL monitoring with pgwatch2. Kaarel Moppel / PostgresConf US 2018
 PostgreSQL monitoring with pgwatch2 Why to monitor Failure / Downtime detection Slowness / Performance analysis Proactive predictions Maybe wasting money? Different levels of Database monitoring Service
Relabeling Julien Pivotto PromConf Munich August 9, 2017
 Relabeling Julien Pivotto (@roidelapluie) PromConf Munich August 9, 2017 user{name="julien Pivotto"} Julien "roidelapluie" Pivotto @roidelapluie Sysadmin at inuits Automation, monitoring, HA Grafana and
Performance Monitoring and Management of Microservices on Docker Ecosystem
 Performance Monitoring and Management of Microservices on Docker Ecosystem Sushanta Mahapatra Sr.Software Specialist Performance Engineering SAS R&D India Pvt. Ltd. Pune Sushanta.Mahapatra@sas.com Richa
Visualize Your Data With Grafana Percona Live Daniel Lee - Software Engineer at Grafana Labs
 Visualize Your Data With Grafana Percona Live 2017 Daniel Lee - Software Engineer at Grafana Labs Daniel Lee Software Engineer at Grafana Labs Stockholm, Sweden @danlimerick on Twitter What is Grafana?
Prometheus. A Next Generation Monitoring System. Brian Brazil Founder
 Prometheus A Next Generation Monitoring System Brian Brazil Founder Who am I? Engineer passionate about running software reliably in production. Based in Ireland Core-Prometheus developer Contributor to
Inside the InfluxDB Storage Engine
 Inside the InfluxDB Storage Engine Gianluca Arbezzano gianluca@influxdb.com @gianarb 1 2 What is time series data? 3 Stock trades and quotes 4 Metrics 5 Analytics 6 Events 7 Sensor data 8 Traces Two kinds
Kubernetes. Introduction
 Kubernetes Introduction WOJCIECH BARCZYŃSKI (hiring) Senior Software Engineer Lead of Warsaw Team - SMACC System Engineer background Interests: working software Hobby: teaching software engineering BACKGROUND
Monitoring Docker Containers with Splunk
 Monitoring Docker Containers with Splunk Marc Chéné Product Manager Sept 27, 2017 Washington, DC Forward-Looking Statements During the course of this presentation, we may make forward-looking statements
Quo vadis, Prometheus?
 Monitoring. At scale. Richard Hartmann, RichiH@{freenode,OFTC,IRCnet}, richih@{fosdem,debian,richih}.org, richard.hartmann@space.net 2018-05-16 whoami Richard RichiH Hartmann Swiss army chainsaw at SpaceNet
README file for TICKpy (CogSys) Container v0.9.4
 Container v0.9.4") README file for TICKpy (CogSys) Container v0.9.4 Container: TICKpy (CogSys) Container-Version: 0.9.4 Interface-Version: 2.0.0 Build-date: Wed Jun 27 12:09:08 UTC 2018 Maintainer: Oliver Beyer Support:
README file for TICKpy (CogSys) Container v0.9.4 Container: TICKpy (CogSys) Container-Version: 0.9.4 Interface-Version: 2.0.0 Build-date: Wed Jun 27 12:09:08 UTC 2018 Maintainer: Oliver Beyer Support:
Monitoring for IT Services and WLCG. Alberto AIMAR CERN-IT for the MONIT Team
 Monitoring for IT Services and WLCG Alberto AIMAR CERN-IT for the MONIT Team 2 Outline Scope and Mandate Architecture and Data Flow Technologies and Usage WLCG Monitoring IT DC and Services Monitoring
Evolution of the Prometheus TSDB. Brian Brazil Founder
 Evolution of the Prometheus TSDB Brian Brazil Founder Who am I? Engineer passionate about running software reliably in production. Core developer of Prometheus Studied Computer Science in Trinity College
Monitoring MySQL with Prometheus Ben Kochie - Prometheus Lead - GitLab
 Monitoring MySQL with Ben Kochie - Lead - GitLab About Metrics collection Time-series database Graphing Alerting Performance Performance Millions of Timeseries 800k samples per second 1.3 bytes per sample
Cloud & container monitoring , Lars Michelsen Check_MK Conference #4
 Cloud & container monitoring 04.05.2018, Lars Michelsen Some cloud definitions Applications Data Runtime Middleware O/S Virtualization Servers Storage Networking Software-as-a-Service (SaaS) Applications
A practical guide to monitoring and alerting with time series at scale
 A practical guide to monitoring and alerting with time series at scale SREcon17 Americas Jamie Wilkinson Site Reliability Engineering, Google Why does #monitoringsuck? TL;DR: when the
Pursuit of stability. Growing AWS ECS in production. Alexander Köhler Frankfurt, September 2018
 Pursuit of stability Growing AWS ECS in production Alexander Köhler Frankfurt, September 2018 Alexander Köhler DevOps Engineer Systems Engineer Big Data Engineer Application Developer 2 @la3mmchen inovex
Evolving Prometheus for the Cloud Native World. Brian Brazil Founder
 Evolving Prometheus for the Cloud Native World Brian Brazil Founder Who am I? Engineer passionate about running software reliably in production. Core developer of Prometheus Studied Computer Science in
OnCommand Cloud Manager 3.2 Deploying and Managing ONTAP Cloud Systems
 OnCommand Cloud Manager 3.2 Deploying and Managing ONTAP Cloud Systems April 2017 215-12035_C0 doccomments@netapp.com Table of Contents 3 Contents Before you create ONTAP Cloud systems... 5 Logging in
Federated Prometheus Monitoring at Scale
 Federated Prometheus Monitoring at Scale LungChih Tung Oath Nandhakumar Venkatachalam Oath Team Core Platform Team powering all Yahoo Media Products Yahoo Media Products Homepage, News Finance Sports,
Monitoring Cloud Native applications with Prometheus. Aaron Weaveworks
 Monitoring Cloud Native applications with Prometheus Aaron Kirkbride @ Weaveworks Time Series Database time_series_1 => [(t0, 0), (t1, 100), (t2, 150), (t3, 170), (t4, 300),...] time_series_2 => [(t0,
Zero to Microservices in 5 minutes using Docker Containers. Mathew Lodge Weaveworks
 Zero to Microservices in 5 minutes using Docker Containers Mathew Lodge (@mathewlodge) Weaveworks (@weaveworks) https://www.weave.works/ 2 Going faster with software delivery is now a business issue Software
Administering Microsoft SQL Server 2012 Databases
 Administering Microsoft SQL Server 2012 Databases Course 10775A 5 Day Instructor-led, Hands on Course Information This five-day instructor-led course provides students with the knowledge and skills to
OnCommand Unified Manager
 OnCommand Unified Manager Operations Manager Administration Guide For Use with Core Package 5.2.1 NetApp, Inc. 495 East Java Drive Sunnyvale, CA 94089 U.S. Telephone: +1 (408) 822-6000 Fax: +1 (408) 822-4501
Administering Microsoft SQL Server 2012 Databases
 Course 10775A: Administering Microsoft SQL Server 2012 Databases Course Details Course Outline Module 1: Introduction to SQL Server 2012 and its Toolset This module introduces the entire SQL Server platform
COURSE 20462C: ADMINISTERING MICROSOFT SQL SERVER DATABASES
 Page 1 of 11 ABOUT THIS COURSE This five-day instructor-led course provides students with the knowledge and skills to maintain a Microsoft SQL Server 2014 database. The course focuses on teaching individuals
The InfluxDB-Grafana plugin for Fuel Documentation
 The InfluxDB-Grafana plugin for Fuel Documentation Release 0.8.0 Mirantis Inc. December 14, 2015 Contents 1 User documentation 1 1.1 Overview................................................. 1 1.2 Release
Professional PostgreSQL monitoring made easy. Kaarel Moppel - p2d2.cz 2019 Prague
 Professional PostgreSQL monitoring made easy Kaarel Moppel - p2d2.cz 2019 Prague Who? Kaarel Moppel Senior Database Consultant km@cybertec.at PostgreSQL Database Services Training Consulting High Availability
Basic knowledge of the Microsoft Windows operating system and its core functionality.
 Administering Microsoft SQL Server Databases Course Description: This five-day instructor-led course provides students with the knowledge and skills to maintain a Microsoft SQL Server 2014 database. The
OSM Hackfest Session 6 Performance & Fault Management Benjamín Díaz (Whitestack)
") OSM Hackfest Session 6 Performance & Fault Management Benjamín Díaz (Whitestack) Introduction Performance and Fault Management capabilities have made important progress in Release FIVE. At the time of
OSM Hackfest Session 6 Performance & Fault Management Benjamín Díaz (Whitestack) Introduction Performance and Fault Management capabilities have made important progress in Release FIVE. At the time of
Graph and Timeseries Databases
 Graph and Timeseries Databases Roman Kern ISDS, TU Graz 2017-10-23 Roman Kern (ISDS, TU Graz) Dbase2 2017-10-23 1 / 31 Graph Databases Graph Databases Motivation and Basics of Graph Databases? Roman Kern
Course Content MongoDB
 Course Content MongoDB 1. Course introduction and mongodb Essentials (basics) 2. Introduction to NoSQL databases What is NoSQL? Why NoSQL? Difference Between RDBMS and NoSQL Databases Benefits of NoSQL
MS-20462: Administering Microsoft SQL Server Databases
 MS-20462: Administering Microsoft SQL Server Databases Description This five-day instructor-led course provides students with the knowledge and skills to maintain a Microsoft SQL Server 2014 database.
Monasca. Monitoring/Logging-as-a-Service (at-scale)
") Monasca Monitoring/Logging-as-a-Service (at-scale) Speaker Roland Hochmuth Hewlett Packard Enterprise Fort Collins, Colorado, USA Agenda Describe how to build a highly scalable monitoring and logging as
Monasca Monitoring/Logging-as-a-Service (at-scale) Speaker Roland Hochmuth Hewlett Packard Enterprise Fort Collins, Colorado, USA Agenda Describe how to build a highly scalable monitoring and logging as
Package your Java Application using Docker and Kubernetes. Arun
 Package your Java Application using Docker and Kubernetes Arun Gupta, @arungupta Docker Captain Java Champion JavaOne Rock Star (4 years) NetBeans Dream Team Silicon Valley JUG Leader Author Runner Lifelong
Monitoring Testbed Experiments with MonEx
 Monitoring Testbed Experiments with MonEx Abdulqawi Saif 1,2 Alexandre Merlin 1 Lucas Nussbaum 1 Ye-Qiong Song 1 1 Université de Lorraine, CNRS, Inria, LORIA, F-54000 Nancy, France 2 Qwant Entreprise,
Persistent Storage with Docker in production - Which solution and why?
 Persistent Storage with Docker in production - Which solution and why? Cheryl Hung 2013-2017 StorageOS Ltd. All rights reserved. Cheryl 2013-2017 StorageOS Ltd. All rights reserved. 2 Why do I need storage?
Network Automation using modern tech. Egor Krivosheev 2degrees
 Network Automation using modern tech Egor Krivosheev 2degrees Key parts of network automation today Streaming Telemetry APIs SNMP and screen scraping are still around NETCONF RFC6241 XML encoding Most
Datacenter replication solution with quasardb
 Datacenter replication solution with quasardb Technical positioning paper April 2017 Release v1.3 www.quasardb.net Contact: sales@quasardb.net Quasardb A datacenter survival guide quasardb INTRODUCTION
Effecient monitoring with Open source tools. Osman Ungur, github.com/o
 Effecient monitoring with Open source tools Osman Ungur, github.com/o Who i am? software developer with system-administration background over 10 years mostly writes Java and PHP also working about infrastructure
ShardProxy Replication-Manager. DataOps - Juin 2018 Kentoku SHIBA - Stephane VAROQUI
 ShardProxy Replication-Manager DataOps - Juin 2018 Kentoku SHIBA - Stephane VAROQUI 1 Replication Manager MRM 2 Replication-Manager - Sharding About Sharding Frameworks They mostly don t do efficient joins
The SMACK Stack: Spark*, Mesos*, Akka, Cassandra*, Kafka* Elizabeth K. Dublin Apache Kafka Meetup, 30 August 2017.
 Dublin Apache Kafka Meetup, 30 August 2017 The SMACK Stack: Spark*, Mesos*, Akka, Cassandra*, Kafka* Elizabeth K. Joseph @pleia2 * ASF projects 1 Elizabeth K. Joseph, Developer Advocate Developer Advocate
Data pipelines with PostgreSQL & Kafka
 Data pipelines with PostgreSQL & Kafka Oskari Saarenmaa PostgresConf US 2018 - Jersey City Agenda 1. Introduction 2. Data pipelines, old and new 3. Apache Kafka 4. Sample data pipeline with Kafka & PostgreSQL
Using the Cisco Unified Analysis Manager Tools
 CHAPTER 17 The Unified Analysis Manager provides a set of tools that allow you to perform management tasks for specific devices and groups of devices. The following sections describe the tasks you can
MMS Backup Manual Release 1.4
 MMS Backup Manual Release 1.4 MongoDB, Inc. Jun 27, 2018 MongoDB, Inc. 2008-2016 2 Contents 1 Getting Started with MMS Backup 4 1.1 Backing up Clusters with Authentication.................................
Zadara Enterprise Storage in
 Zadara Enterprise Storage in Google Cloud Platform (GCP) Deployment Guide March 2017 Revision A 2011 2017 ZADARA Storage, Inc. All rights reserved. Zadara Storage / GCP - Deployment Guide Page 1 Contents
Maintaining a Microsoft SQL Server 2008 Database (Course 6231A)
") Duration Five days Introduction Elements of this syllabus are subject to change. This five-day instructor-led course provides students with the knowledge and skills to maintain a Microsoft SQL Server 2008
Duration Five days Introduction Elements of this syllabus are subject to change. This five-day instructor-led course provides students with the knowledge and skills to maintain a Microsoft SQL Server 2008
Administering a SQL Database Infrastructure (M20764)
") Administering a SQL Database Infrastructure (M20764) COURSE OVERVIEW: In this Microsoft online training course, you will learn the skills required to maintain a Microsoft SQL Server 2012 or 2014 database
Administering a SQL Database Infrastructure (M20764) COURSE OVERVIEW: In this Microsoft online training course, you will learn the skills required to maintain a Microsoft SQL Server 2012 or 2014 database
Microservices. Chaos Kontrolle mit Kubernetes. Robert Kubis - Developer Advocate,
 Microservices Chaos Kontrolle mit Kubernetes Robert Kubis - Developer Advocate, Google @hostirosti About me Robert Kubis Developer Advocate Google Cloud Platform London, UK hostirosti github.com/hostirosti
GoDocker. A batch scheduling system with Docker containers
 GoDocker A batch scheduling system with Docker containers Web - http://www.genouest.org/godocker/ Code - https://bitbucket.org/osallou/go-docker Twitter - #godocker Olivier Sallou IRISA - 2016 CC-BY-SA
CrateDB for Time Series. How CrateDB compares to specialized time series data stores
 CrateDB for Time Series How CrateDB compares to specialized time series data stores July 2017 The Time Series Data Workload IoT, digital business, cyber security, and other IT trends are increasing the
VMWARE VREALIZE OPERATIONS MANAGEMENT PACK FOR. MongoDB. User Guide
 VMWARE VREALIZE OPERATIONS MANAGEMENT PACK FOR MongoDB User Guide TABLE OF CONTENTS 1. Purpose... 3 2. Introduction to the Management Pack... 3 2.1 How the Management Pack Collects Data... 3 2.2 Data the
Survey and Comparison of Open Source Time Series Databases
 Survey and Comparison of Open Source Time Series Databases SCDM @ BTW 2017 Andreas Bader, Oliver Kopp, Michael Falkenthal What is a time series data? A row of data that consists of a timestamp, a value,
observability and product release: leveraging prometheus to build and test new products digitalocean.com
 @snehainguva observability and product release: leveraging prometheus to build and test new products about me software engineer @DigitalOcean currently network services
Setting up Kubernetes with Day 2 in Mind. Angela Chin, Senior Software Engineer, Pivotal Urvashi Reddy, Senior Software Engineer, Pivotal
 Setting up Kubernetes with Day 2 in Mind Angela Chin, Senior Software Engineer, Pivotal Urvashi Reddy, Senior Software Engineer, Pivotal About Us Angela Software Engineer @ Pivotal Based in Santa Monica,
Cloud Monitoring as a Service. Built On Machine Learning
 Cloud Monitoring as a Service Built On Machine Learning Table of Contents 1 2 3 4 5 6 7 8 9 10 Why Machine Learning Who Cares Four Dimensions to Cloud Monitoring Data Aggregation Anomaly Detection Algorithms
Course 6231A: Maintaining a Microsoft SQL Server 2008 Database
 Course 6231A: Maintaining a Microsoft SQL Server 2008 Database OVERVIEW About this Course Elements of this syllabus are subject to change. This five-day instructor-led course provides students with the
@joerg_schad Nightmares of a Container Orchestration System
 @joerg_schad Nightmares of a Container Orchestration System 2017 Mesosphere, Inc. All Rights Reserved. 1 Jörg Schad Distributed Systems Engineer @joerg_schad Jan Repnak Support Engineer/ Solution Architect
Using the SDACK Architecture to Build a Big Data Product. Yu-hsin Yeh (Evans Ye) Apache Big Data NA 2016 Vancouver
 Apache Big Data NA 2016 Vancouver") Using the SDACK Architecture to Build a Big Data Product Yu-hsin Yeh (Evans Ye) Apache Big Data NA 2016 Vancouver Outline A Threat Analytic Big Data product The SDACK Architecture Akka Streams and data
Using the SDACK Architecture to Build a Big Data Product Yu-hsin Yeh (Evans Ye) Apache Big Data NA 2016 Vancouver Outline A Threat Analytic Big Data product The SDACK Architecture Akka Streams and data
Voltha Architecture in a clustered HA configuration. Sergio Slobodrian, Ciena CORD Build Wed, November 7 th, 2017
 Voltha Architecture in a clustered HA configuration Sergio Slobodrian, Ciena CORD Build Wed, November 7 th, 2017 Abstract This talk will dive in on VOLTHA s clustered high availability architecture including
The Internet of Things:
 The Internet of Things: Sensor Data Management Course website: h8p://www.cs.unibo.it/projects/iot/ Prof. Luciano Bononi luciano.bononi@unibo.it Prof. Marco Di Felice marco.difelice3@unibo.it MASTER DEGREE
PCP: Ingest and Export
 PCP: Ingest and Export pcp-conf2018 Mark Goodwin mgoodwin@redhat.com @goodwinos PCP Ingest / Export Ingest Standard Agents Specialized agents: MMV BCC Trace Prometheus.. many others LOGIMPORT(3) Ingest
 https://bit.do/pgsessions-postgresqlkubernetes PostgreSQL and Kubernetes Database as a Service without a Vendor Lock-in Oleksii Kliukin PostgreSQL Sessions 10 Paris, France About me PostgreSQL Engineer
Maintaining a Microsoft SQL Server 2008 R2 Database
 Course 6231B - Maintaining a Microsoft SQL Server 2008 R2 Database Page 1 of 7 Maintaining a Microsoft SQL Server 2008 R2 Database Course 6231B: Four days; Instructor-Led About this Course This instructor-led
Regain control thanks to Prometheus. Guillaume Lefevre, DevOps Engineer, OCTO Technology Etienne Coutaud, DevOps Engineer, OCTO Technology
 Regain control thanks to Prometheus Guillaume Lefevre, DevOps Engineer, OCTO Technology Etienne Coutaud, DevOps Engineer, OCTO Technology About us Guillaume Lefevre DevOps Engineer, OCTO Technology @guillaumelfv
Course AZ-100T01-A: Manage Subscriptions and Resources
 Course AZ-100T01-A: Manage Subscriptions and Resources Module 1: Managing Azure Subscriptions In this module, you ll learn about the components that make up an Azure subscription and how management groups
Course 6231A: Maintaining a Microsoft SQL Server 2008 Database
 Course 6231A: Maintaining a Microsoft SQL Server 2008 Database About this Course This five-day instructor-led course provides students with the knowledge and skills to maintain a Microsoft SQL Server 2008
6231B - Version: 1. Maintaining a Microsoft SQL Server 2008 R2 Database
 6231B - Version: 1 Maintaining a Microsoft SQL Server 2008 R2 Database Maintaining a Microsoft SQL Server 2008 R2 Database 6231B - Version: 1 5 days Course Description: This five-day instructor-led course
MarkLogic Server. Monitoring MarkLogic Guide. MarkLogic 8 February, Copyright 2015 MarkLogic Corporation. All rights reserved.
 Monitoring MarkLogic Guide 1 MarkLogic 8 February, 2015 Last Revised: 8.0-1, February, 2015 Copyright 2015 MarkLogic Corporation. All rights reserved. Table of Contents Table of Contents Monitoring MarkLogic
Thales PunchPlatform Agenda
 Thales PunchPlatform Agenda What It Does Building Blocks PunchPlatform team Deployment & Operations Typical Setups Customers and Use Cases RoadMap 1 What It Does Compose Arbitrary Industrial Data Processing
Kubernetes 1.9 Features and Future
 OpenShift Commons Briefing: Kubernetes 1.9 Features and Future Derek Carr - Lead Engineer, Kubernetes What s new this time around? RELEASE STATS Shorter release (end of year) 6000+ pull requests merged
Deploying and Using ArcGIS Enterprise in the Cloud. Bill Major
 Deploying and Using ArcGIS Enterprise in the Cloud Bill Major Quick Survey Your role in your organization - Developer? - Cloud Admin? Already a cloud user Running Esri deployment on AWS Running Esri deployment
PUBLIC SAP Vora Sizing Guide
 SAP Vora 2.0 Document Version: 1.1 2017-11-14 PUBLIC Content 1 Introduction to SAP Vora....3 1.1 System Architecture....5 2 Factors That Influence Performance....6 3 Sizing Fundamentals and Terminology....7
Developing Microsoft Azure Solutions (70-532) Syllabus
 Syllabus") Developing Microsoft Azure Solutions (70-532) Syllabus Cloud Computing Introduction What is Cloud Computing Cloud Characteristics Cloud Computing Service Models Deployment Models in Cloud Computing Advantages
Developing Microsoft Azure Solutions (70-532) Syllabus Cloud Computing Introduction What is Cloud Computing Cloud Characteristics Cloud Computing Service Models Deployment Models in Cloud Computing Advantages
MySQL Database Administrator Training NIIT, Gurgaon India 31 August-10 September 2015
 MySQL Database Administrator Training Day 1: AGENDA Introduction to MySQL MySQL Overview MySQL Database Server Editions MySQL Products MySQL Services and Support MySQL Resources Example Databases MySQL
ArcGIS Enterprise: Advanced Topics in Administration. Thomas Edghill & Moginraj Mohandas
 ArcGIS Enterprise: Advanced Topics in Administration Thomas Edghill & Moginraj Mohandas Outline Overview: Base ArcGIS Enterprise Deployment - Key Components - Administrator Endpoints Advanced Workflows:
ESC in Maintenance Mode
 This chapter contains the following chapters: Setting ESC in a Maintenance Mode, page 1 Backup the Database from the ESC Standalone Instances, page 2 Backup the Database from the ESC HA Instances, page
Ingest. David Pilato, Developer Evangelist Paris, 31 Janvier 2017
 Ingest David Pilato, Developer Evangelist Paris, 31 Janvier 2017 Data Ingestion The process of collecting and importing data for immediate use in a datastore 2 ? Simple things should be simple. Shay Banon
ExtraHop 6.0 ExtraHop REST API Guide
 ExtraHop 6.0 ExtraHop REST API Guide 2018 ExtraHop Networks, Inc. All rights reserved. This manual in whole or in part, may not be reproduced, translated, or reduced to any machinereadable form without
VMWARE VREALIZE OPERATIONS MANAGEMENT PACK FOR. Nagios. User Guide
 VMWARE VREALIZE OPERATIONS MANAGEMENT PACK FOR Nagios User Guide TABLE OF CONTENTS 1. Purpose...3 2. Introduction to the Management Pack...3 2.1 How the Management Pack Collects Data...3 2.2 Data the Management