Data Manipulation with JMP
|
|
|
- Vivien George
- 5 years ago
- Views:
Transcription
1 Data Manipulation with JMP Introduction JMP was introduced in 1989 by its Principle developer, John Sall at SAS. It is a richly graphic environment and very useful for both preliminary data exploration and more advanced statistics. It is user friendly and provides both a series of menus and more advanced statistical techniques. For those wishing to go beyond the routine, a scripting language is available and many pre-scripted routines are available to ease the burden of coding. It is assumed that all students have at least a cursory knowledge of the menu offerings and have used JMP, however sparingly, in the past. We will be using ver 9 of JMP for this lecture, and all manipulations described here may be found in two JMP manuals: Introductory Guide and the User s Guide. Background: Getting the data into JMP There are two methods of doing this: simple cut-and-paste and importation via the Open Data Table menu of the JMP Starter box, or the File/Open command from the main menu bar. We will assume that your data comes from an EXCEL file to simplify the operations. When doing a simple cut-and-paste from EXCEL, two drawbacks are immediately apparent: 1) with large data sets this can be exceedingly tedious and 2) with previous versions of JMP,the headers didn t come in with the data (and did you really want to retype all that?!). The data can be readily imported from EXCEL as an.xls file merely by using the Open Data box in the JMP Starter dialog (note: if JMP Starter is not visible from your screen, just use the View/JMP Starter command from the toolbar). With this tool you can browse to the proper file and open it in JMP. Also, with the new Edit/ Paste with Column Names command, this is easily done in version 9. 1

2 JMP will easily import files as.xls,.txt,.csv,.dat, SAS and of course,.jmp. Version 7 & 8, unlike previous versions, will correctly place the column headers, even if they are not in the first row of an imported EXCEL spreadsheet. Use of the Data Table Window Now let s bring in a typical data table by selecting a file and hitting the Open button on the Open Data File dialog. 2

3 Before proceeding there are several items that need mention and emphasis. You will notice that some screenshots display far more items than others. You may add as many as you like depending upon your needs by using the View/Show Toolbars choice. Big Emphasis: Once data is imported into JMP, it should be examined for accuracy and completeness. Try checking the first, middle, and last rows to ensure that they match the original EXCEL dataset. Check the area to the left of the table to verify that the expected number of rows and columns has been transferred. Also, be aware that when you proceed to do a hypothesis test or certain manipulations, JMP will be very picky as to the Type of the variables that you have imported. For certain operations the data must be continuous, and for others categorical (i.e. nominal or ordinal). For example your instrument data is usually continuous, the instruments and lots may be nominal, and dates are ordinal. We will change these later in this presentation 3
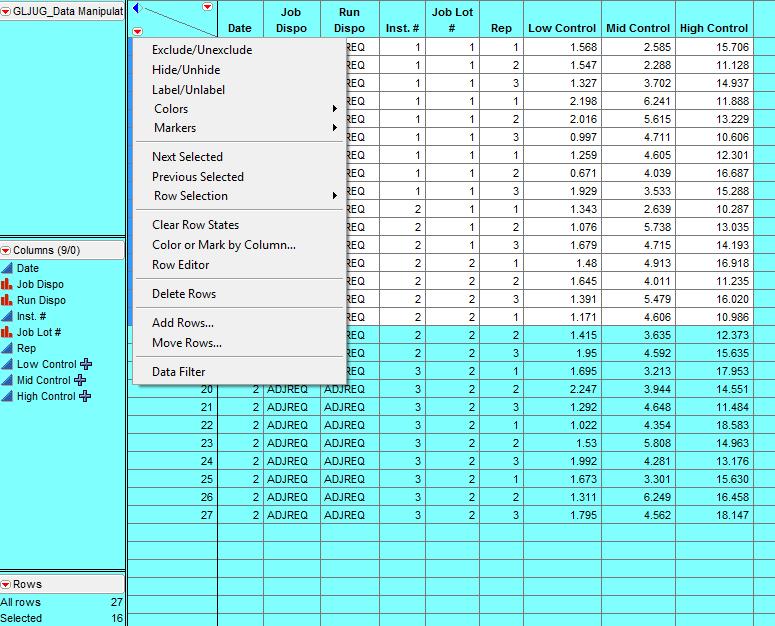
4 Another nice feature in JMP that allows data integrity checking is the Cols/Recode feature. Using this, the analyst gets a quick check of the number of items in each group and can quickly compare these with those in an original data sheet. As an aside, you will often see large dots in the worksheet cells, and these merely indicate missing data. When zeroes are mistakenly imported and dots are desired, the change may be implemented in the List Check feature of the Column Properties dropdown found under Column Info (and accessed by right-clicking any column header). Once the data is in JMP, and has been formatted to suit your needs, always remember to name and save the table with the <File/Save as> command. After the initial save, as you modify the data table, you may wish to use <File/Save> quite often. Opening a data table window will allow the user to: - change a column width - hide/delete columns - add/delete rows and rearrange their order - add columns and rearrange their order - select and subset rows for further analysis - sort and combine tables The red, downward pointing arrow menu icons are a great help, click on them in the row/column selection area as below: 4
5 5

6 You will quickly find that these are the most useful tools imaginable for selecting and tagging data. In this course we will try several of these operations, alone and in combination to demonstrate their utility. You will find that they will assist in not only tagging and subsetting data, but in visualizing trends, as points in various groups can be labeled with many colors and shapes to make apparent any trends or aberrancies that might exist in the data. Also for merging with other data files and a quick look at any given subset of the data, the tools are invaluable. As with any other tool the secret is practice, practice, and more practice! Use of the Tables Menu: Overview The Tables menu selection allows the user to modify or create new tables from one or more existing JMP tables. It has the following commands: 6

7 There are 11 choices on the menu and perhaps the best way of familiarizing ourselves with the use and functions are by using them all on a single problem. Our example comes from the diagnostics industry. The instrument development and QA scientists have a control dataset that they wish to do some preliminary analyses on, to examine the distribution for outliers, compare within and between run variability, and further explore for possible important relationships between subgroups of the data. We have data for three controls from 2 lots, done on 3 different instruments over 2 days with 3 repititions per run. By stepping through subsets of the data with various menu commands, we may gain greater insight into class differences. This strategy can be generalized to most data and we usually use subject matter of familiarity to the target audience. Please note that in the following narrative, anything in < > are the JMP menu items and choices. 7
![Step 1: The dataset consists of 27 readings (as rows) and data for 3 controls (as columns) plus six descriptor columns: [End of First Part of WebEx] Use of the Row Selection Commands As a first pass](/docs-images/87/97383786/images/8-0.jpg "at data exploration, the chemists want a summary of all of the data for each control level. (This is done under the Analyze/Distribution menu item).")
8 Step 1: The dataset consists of 27 readings (as rows) and data for 3 controls (as columns) plus six descriptor columns: [End of First Part of WebEx] Use of the Row Selection Commands As a first pass at data exploration, the chemists want a summary of all of the data for each control level. (This is done under the Analyze/Distribution menu item). Upon examining the results, they observe the data clustering in unexpected ways and wish to examine a specific control and lot, or several control/lots separately. We do this by the following commands: 8
, type a 2 in the box (without the ) and click on")
9 Left-click on the red arrow above the row numbers column OR Right-click anywhere in the blank space (containing the red arrow) above the row numbers column From the resultant menu select <Row Selection/Select Where > In the resultant dialog box: select Job Lot # by clicking on it, select equals from the drop down list (this is the default), type a 2 in the box (without the ) and click on <Add Condition>. Then select Rep, and type a 1 in the box (without the ) and click on <Add Condition>. Your dialog box should look like the one below. Now click <OK> You will see that the rows on the data table for Job Lot #2, rep 1 have all been highlighted, and therefore are selected. Multiple selection of rows was a new feature added in version 6. By using the Distribution button on the toolbar, it is seen that the rows of interest are highlighted both on the histogram and quantile plot. 9
 above the row numbers column From the resultant menu")
10 If the distribution of ONLY these data points were desired, they could be used by excluding all of the other points. This is done by: Left-click on the red arrow above the row numbers column OR Right-click anywhere in the blank space (containing the red arrow) above the row numbers column From the resultant menu select <Row Selection/Invert Row Selection> Now all of the other points are selected and may be excluded from subsequent analysis by: Left-click on the red arrow above the row numbers column OR Right-click anywhere in the blank space (containing the red arrow) above the row numbers column and select <Exclude/Unexclude> (an easier way to do this is with the Tables/Subset menu, and we will see its use shortly). Still another method of selection involves the Data Filter under the Rows menu. All of the other points now have been labeled with a and those data points will be excluded from any subsequent analysis. To remove the label, just go back to the same menu as before and select <Exclude/Unexclude>. The label is now removed and the data will be again included in subsequent calculations. Please note that if the intent was to merely observe a certain sub-group on any plot, while retaining all data for the statistical calculations, this could be done in the same manner, but using the <Hide/Unhide> choice from the Row menus. That symbol would appear as a mask. 10
 have been used and you want to remove them all at once, merely Left-click on the red arrow above the row numbers column OR Right-click anywhere in the blank space (containing the red arrow) above")
11 These are particularly powerful features as they allow you to selectively utilize portions of the data without actually deleting any data. If several labels (such as markers, colors, exclusions, etc.) have been used and you want to remove them all at once, merely Left-click on the red arrow above the row numbers column OR Right-click anywhere in the blank space (containing the red arrow) above the row numbers column and select <Clear Row States>. Please note that while we employ labels to characterize the various groups, this is not the same as the Label function in JMP, which allows you to actually label points with the values in the data table. For example, if we labeled certain rows with the Label option, we would see: Note that the above is done by Left-clicking on the red arrow above the row numbers column OR Right-clicking anywhere in the blank space (containing the red arrow) above the row numbers column and select <Label/Unlabel>. When we now do the <Analyze/Distribution> command we get: 11

12 Now the labeled points show up with the row numbers as labels. Alternatively we could use the more informative column labels so we could relate each point to a rep, run, or lot. Now to see how easily data groups can be distinguished by these markers, let s select different ones for each rep. Left-click on the red arrow above the row numbers column OR Right-click anywhere in the blank space (containing the red arrow) above the row numbers column From the resultant menu select <Row Selection/Select Where > And highlight Rep, select equals, and type in 1 then <OK> Notice that all of the Rep1 s have been selected. Now Again, Left-click on the red arrow above the row numbers column OR Right-click anywhere in the blank space (containing the red arrow) above the row numbers column Then click on Colors and select a dark red. Again, Left-click on the red arrow above the row numbers column OR Right-click anywhere in the blank space (containing the red arrow) above the row numbers column Then click on Markers and select the spider 12

13 The spreadsheet now appears as below: Notice that by left-clicking in the small region above the row numbers, you can remove the selection highlighting. 13

14 Now repeat the process above for all Rep 2 s and 3 s choosing new colors and markers. The table then appears as: 14

15 Now by merely selecting <Analyze/Distribution> on the menu bar or just the distribution button on the toolbar, 15

16 We can readily visualize/verify that our reps are evenly distributed throughout the range. Also note the following column feature: We can mark any column as a point label on the graphics by left-clicking on a column name to highlight it, then left-clicking the red arrow in the column area to the left of the column names and selecting Label/Unlabel. A small tag will appear next to the column name and on any graphic; the value of the point label (say rep or lot number) will appear by any point with a simple mouse-over. Please note that while we had originally saved the data table, we have NOT saved any analysis! To save the analysis use the Edit/Journal then File/Save as menu choices. [End of Second Part of WebEx] Use of the Tables Selections for Data Manipulation Suppose that we would like to quickly summarize the data by groups. This could be done by selecting only those rows in a given group and using the distribution platform. This would give much more output than we would like to see so a simple summary might suffice. To do a quick summary: <Tables/Summary> Highlight columns of interest (do NOT hit the group button during these operations) Choose the statistics of interest by left-clicking on the Statistics box AND WHILE HOLDING DOWN THE LEFT MOUSE BUTTON, select each statistic of interest (only one at a time) and releasing the button between selections. 16


17 This is rather inconvenient as the summary statistics are strung out to the right in a single row. Of course we could always transpose the data <Tables/Transpose>, select all of the columns and hit the <Transpose Columns> to get a better format: Notice what the Transpose does; we are now interchanging our columns and rows so our data or headers in the columns from left to right, are now in the rows from top to bottom. 17
.")
18 Now that we have had a little practice with Tables, let s try the very powerful sort command. Many times we wish to make group comparisons, and in JMP that means stacked data (one data column and one column for each group descriptor such as day, instrument, rep, run, etc.). We are used to having our data in separate columns so this mandates a rearrangement. In JMP we may implement multiple By statements automatically and sort by descriptor1, then 2 within 1, then 3 within 2, etc. In our data set we will invoke <Tables/sort> Select Date and hit <By> Select Rep and hit <By> Highlight the 3 controls Notice that I have changed the modeling type for Date to Ordinal and Job Dispo, Run Dispo, Inst #, Job Lot #, and Rep to Nominal. This is not so much for the data manipulation steps but for any successive analysis that is done. We will briefly touch on modeling types at the end of this session and in future presentations as we actually analyze the data. Now hit <OK> and observe the results: 18


19 Now we have the control data sorted by rep within date (reps 1, 2, and 3 within each date) and can easily utilize the Fit Y by X platform to compare reps within days, or any other grouping for which we have pre-sorted. At this point you may see several windows tiled on your screen. Some may be completely hidden behind others. We can rapidly toggle between windows with the Window main menu choice, or the dropdown Windows box. Note that another easy way of isolating data for further analysis is with the Subset key used in conjunction with row selection. 19
, type a 1 in the box (without the ) and")

20 Review: Left-click on the red arrow above the row numbers column OR Right-click anywhere in the blank space (containing the red arrow) above the row numbers column From the resultant menu select <Row Selection/Select Where > In the resultant dialog box: select Job Lot # by clicking on it, select equals from the drop down list (this is the default), type a 1 in the box (without the ) and click on <Add Condition, <OK>. There is also a more powerful feature to do row selections and that is the Data Filter (<Rows/Data Filter>). For non-continuous data this is very fast and easy: Now that we have selected only Lot 1 data, subset it: <Tables/Subset> Put a. In the Selected Rows radio button Hit <OK> We now have a table of only Lot 1 data that can be analyzed by any means that we choose. 20

21 Before we leave the simple manipulations, let s take a look at the fast and easy way to stack the data for Y by X analysis. Starting with our basic data table, and using commands that we have already learned, we will isolate our needed columns, and then stack them for subsequent analysis. Start by selecting the last 6 columns (instrument, lot, rep, and the 3 controls) <Tables/Subset> ( all rows and selected columns buttons should be filled) <OK> In the new table: <Tables/Stack> select the 3 controls <Stack Columns> remove the check mark from the Stack by row box <OK> The controls are now stacked into a single column, labeled as to instrument, Lot, and rep, and are ready for Y by X analyses. 21

22 Occasionally the analyst may have a need to deal with the data in its original format, and in JMP it s a relatively easy matter to split data columns into logical groups. <Tables/Split> 22


23 Select the column titled Label then hit <Split By> Select the Data column and hit <Split Columns> If these are the only columns of interest, put a. In the Drop All radio button <OK> The column have been split back to the original multiple columns: Occasionally we may wish to get around Excel s 64K row limitation. New data can easily be added to existing sets with the Concatenate feature. Assuming that the new set is in the same format (and now we know how to quickly reformat data in JMP!) this can be done by saving both data tables in JMP and merely using the Concatenate command. 23

")
24 Table 1 (the original data table) Table 2 (new data) <Tables/Concatenate> 24

25 Table 1 appears in the Data Tables to be Concatenated box. Select Table 2 and hit <ADD>, <OK> to get the concatenated table: 25

26 If we would ever want to add another type of data to the table, say a new column with data on a different control, where all of the other collection factors were the same, we can Join the new data to the old table. New Data: 26


27 Now use <Tables/Join> and select Table3 in the Join Table 1 with box. Be sure that By Row Number is selected as the Matching Specification. <OK> The resulting table now has a new column with the additional control: 27

28 The Update function will actually change the data in your tables by replacing the old data with new, updated data. This would be useful for replacing older data in a time series collection, but as we rarely discard our data, it would be best to save the original data table, change the file name, and then replace the data under a new file name. In practice, we would prefer to just add, rather than replace data, so we would find more utility in the Join and Concatenate functions. We do have some very useful additions that will quickly group and build compact data tables for immediate visualization of complex data structures. For example, if we wanted to show how the values of our High control varied with Rep, Lot, and Date, we could easily do so. <Tables/Tabulate> Now to construct the new table, we start by selecting the lowest factor, in this case the actual data, dragging it from the control panel are to the drop zone, and letting JMP know whether we want it used for grouping or analysis. We then select each higher order nest of the design and add it in sequence to the area of the table just over the last factor. A gray area appears to let us know where this factor name will be dropped. 28

.")
29 Repetitive series of these actions with higher order grouping terms will eventually Lead to the completed table. (Note: there is also a Dialog choice under the Build Table Using area and some people find this method easier than using the Interactive Table ). Other statistics may be added to the bottom row by the simple drag-and-drop technique. 29


30 New in JMP 9 is the Format button that allows truncation of the table by limiting the field width and number of decimals displayed, a very useful feature! The final table may be saved with the Edit/Journal menu item and the output pasted into other documents. JMP also has a new feature that will tally the amount of missing data, column by column. If we have a table that looks like this: but contains several thousand rows, we would like the software to quickly find and summarize the missing data and tell us in which columns this occurs. This is done with the <Tables/Missing Data Pattern> menu item. Now highlight the columns of interest in the Select Columns area and 30
31 Hit <Add Columns> <OK> The tally appears as: This tells us how many rows have 0, 1, or both chosen columns containing missing data. Note that this is not really a pattern in the broadest sense as we don t know where the missing data occurs, just in which columns. Finally please note JMP is not EXCEL but will offer nearly the complete menu of slice and dice techniques offered by the spreadsheet. However, users will quickly find the use of such functions as sort and subset to be extremely useful when analyzing data. The others assist in a variety of conditions. Choose wisely! 31
PIVOT TABLES IN MICROSOFT EXCEL 2016
 PIVOT TABLES IN MICROSOFT EXCEL 2016 A pivot table is a powerful tool that allows you to take a long list of data and transform it into a more compact and readable table. In the process, the tool allows
Getting Started with JMP at ISU
 Getting Started with JMP at ISU 1 Introduction JMP (pronounced like jump ) is the new campus-wide standard statistical package for introductory statistics courses at Iowa State University. JMP is produced
Excel Core Certification
 Microsoft Office Specialist 2010 Microsoft Excel Core Certification 2010 Lesson 6: Working with Charts Lesson Objectives This lesson introduces you to working with charts. You will look at how to create
Excel 2007/2010. Don t be afraid of PivotTables. Prepared by: Tina Purtee Information Technology (818)
") Information Technology MS Office 2007/10 Users Guide Excel 2007/2010 Don t be afraid of PivotTables Prepared by: Tina Purtee Information Technology (818) 677-2090 tpurtee@csun.edu [ DON T BE AFRAID OF
Information Technology MS Office 2007/10 Users Guide Excel 2007/2010 Don t be afraid of PivotTables Prepared by: Tina Purtee Information Technology (818) 677-2090 tpurtee@csun.edu [ DON T BE AFRAID OF
Data Should Not be a Four Letter Word Microsoft Excel QUICK TOUR
 Toolbar Tour AutoSum + more functions Chart Wizard Currency, Percent, Comma Style Increase-Decrease Decimal Name Box Chart Wizard QUICK TOUR Name Box AutoSum Numeric Style Chart Wizard Formula Bar Active
Creating a data file and entering data
 4 Creating a data file and entering data There are a number of stages in the process of setting up a data file and analysing the data. The flow chart shown on the next page outlines the main steps that
Intermediate Excel 2003
 Intermediate Excel 2003 Introduction The aim of this document is to introduce some techniques for manipulating data within Excel, including sorting, filtering and how to customise the charts you create.
DOING MORE WITH EXCEL: MICROSOFT OFFICE 2013
 DOING MORE WITH EXCEL: MICROSOFT OFFICE 2013 GETTING STARTED PAGE 02 Prerequisites What You Will Learn MORE TASKS IN MICROSOFT EXCEL PAGE 03 Cutting, Copying, and Pasting Data Basic Formulas Filling Data
Introduction to Microsoft Excel 2007
 Introduction to Microsoft Excel 2007 Microsoft Excel is a very powerful tool for you to use for numeric computations and analysis. Excel can also function as a simple database but that is another class.
AN OVERVIEW AND EXPLORATION OF JMP A DATA DISCOVERY SYSTEM IN DAIRY SCIENCE
 AN OVERVIEW AND EXPLORATION OF JMP A DATA DISCOVERY SYSTEM IN DAIRY SCIENCE A.P. Ruhil and Tara Chand National Dairy Research Institute, Karnal-132001 JMP commonly pronounced as Jump is a statistical software
Excel 2013 Intermediate
 Instructor s Excel 2013 Tutorial 2 - Charts Excel 2013 Intermediate 103-124 Unit 2 - Charts Quick Links Chart Concepts Page EX197 EX199 EX200 Selecting Source Data Pages EX198 EX234 EX237 Creating a Chart
Excel Intermediate
 Excel 2013 - Intermediate (103-124) Multiple Worksheets Quick Links Manipulating Sheets Pages EX16 EX17 Copying Worksheets Page EX337 Grouping Worksheets Pages EX330 EX332 Multi-Sheet Cell References Page
Biology 345: Biometry Fall 2005 SONOMA STATE UNIVERSITY Lab Exercise 2 Working with data in Excel and exporting to JMP Introduction
 Biology 345: Biometry Fall 2005 SONOMA STATE UNIVERSITY Lab Exercise 2 Working with data in Excel and exporting to JMP Introduction In this exercise, we will learn how to reorganize and reformat a data
Introduction to Excel
 Introduction to Excel Written by Jon Agnone Center for Social Science Computation & Research 145 Savery Hall University of Washington Seattle WA 98195 U.S.A. (206)543-8110 November 2004 http://julius.csscr.washington.edu/pdf/excel.pdf
Excel 2010: Getting Started with Excel
 Excel 2010: Getting Started with Excel Excel 2010 Getting Started with Excel Introduction Page 1 Excel is a spreadsheet program that allows you to store, organize, and analyze information. In this lesson,
Statistics 528: Minitab Handout 1
 Statistics 528: Minitab Handout 1 Throughout the STAT 528-530 sequence, you will be asked to perform numerous statistical calculations with the aid of the Minitab software package. This handout will get
MAKING TABLES WITH WORD BASIC INSTRUCTIONS. Setting the Page Orientation. Inserting the Basic Table. Daily Schedule
 MAKING TABLES WITH WORD BASIC INSTRUCTIONS Setting the Page Orientation Once in word, decide if you want your paper to print vertically (the normal way, called portrait) or horizontally (called landscape)
Single Menus No other menus will follow necessitating additional user choices
 57 UNIT-III STRUCTURES OF MENUS Single Menus No other menus will follow necessitating additional user choices Sequential Linear Menus Simultaneous Menus 58 Hierarchical Menus When many relationships exist
DOING MORE WITH EXCEL: MICROSOFT OFFICE 2010
 DOING MORE WITH EXCEL: MICROSOFT OFFICE 2010 GETTING STARTED PAGE 02 Prerequisites What You Will Learn MORE TASKS IN MICROSOFT EXCEL PAGE 03 Cutting, Copying, and Pasting Data Filling Data Across Columns
Book 5. Chapter 1: Slides with SmartArt & Pictures... 1 Working with SmartArt Formatting Pictures Adjust Group Buttons Picture Styles Group Buttons
 Chapter 1: Slides with SmartArt & Pictures... 1 Working with SmartArt Formatting Pictures Adjust Group Buttons Picture Styles Group Buttons Chapter 2: Slides with Charts & Shapes... 12 Working with Charts
COPYRIGHTED MATERIAL. Making Excel More Efficient
 Making Excel More Efficient If you find yourself spending a major part of your day working with Excel, you can make those chores go faster and so make your overall work life more productive by making Excel
Excel 2013 Intermediate
 Excel 2013 Intermediate Quick Access Toolbar... 1 Customizing Excel... 2 Keyboard Shortcuts... 2 Navigating the Spreadsheet... 2 Status Bar... 3 Worksheets... 3 Group Column/Row Adjusments... 4 Hiding
GIS LAB 1. Basic GIS Operations with ArcGIS. Calculating Stream Lengths and Watershed Areas.
 GIS LAB 1 Basic GIS Operations with ArcGIS. Calculating Stream Lengths and Watershed Areas. ArcGIS offers some advantages for novice users. The graphical user interface is similar to many Windows packages
Chapter 2 The SAS Environment
 Chapter 2 The SAS Environment Abstract In this chapter, we begin to become familiar with the basic SAS working environment. We introduce the basic 3-screen layout, how to navigate the SAS Explorer window,
Frequency tables Create a new Frequency Table
 Frequency tables Create a new Frequency Table Contents FREQUENCY TABLES CREATE A NEW FREQUENCY TABLE... 1 Results Table... 2 Calculate Descriptive Statistics for Frequency Tables... 6 Transfer Results
Excel 2007 New Features Table of Contents
 Table of Contents Excel 2007 New Interface... 1 Quick Access Toolbar... 1 Minimizing the Ribbon... 1 The Office Button... 2 Format as Table Filters and Sorting... 2 Table Tools... 4 Filtering Data... 4
1. Managing Information in Table
 1. Managing Information in Table Spreadsheets are great for making lists (such as phone lists, client lists). The researchers discovered that not only was list management the number one spreadsheet activity,
Unit 3 Fill Series, Functions, Sorting
 Unit 3 Fill Series, Functions, Sorting Fill enter repetitive values or formulas in an indicated direction Using the Fill command is much faster than using copy and paste you can do entire operation in
Importing in Offertory Donations from Spreadsheets into Connect Now
 Importing in Offertory Donations from Spreadsheets into Connect Now When you have an excel spreadsheet that has donations in it, if you have a key identifier, such as an envelope number, then the spreadsheet
Unit 3 Functions Review, Fill Series, Sorting, Merge & Center
 Unit 3 Functions Review, Fill Series, Sorting, Merge & Center Function built-in formula that performs simple or complex calculations automatically names a function instead of using operators (+, -, *,
Chapter 2. Basic Operations. you through the routine procedures that you will use nearly every time you work with SPSS.
 1 Chapter 2 Basic Operations Chapter 1 presented a very conceptual overview of SPSS. The present chapter will walk you through the routine procedures that you will use nearly every time you work with SPSS.
Handling Your Data in SPSS. Columns, and Labels, and Values... Oh My! The Structure of SPSS. You should think about SPSS as having three major parts.
 Handling Your Data in SPSS Columns, and Labels, and Values... Oh My! You might think that simple intuition will guide you to a useful organization of your data. If you follow that path, you might find
Working with Charts Stratum.Viewer 6
 Working with Charts Stratum.Viewer 6 Getting Started Tasks Additional Information Access to Charts Introduction to Charts Overview of Chart Types Quick Start - Adding a Chart to a View Create a Chart with
Getting Started With Excel
 Chapter 1 Getting Started With Excel This chapter will familiarize you with various basic features of Excel. Specific features which you need to solve a problem will be introduced as the need arises. When
Excel Tables and Pivot Tables
 A) Why use a table in the first place a. Easy to filter and sort if you only sort or filter by one item b. Automatically fills formulas down c. Can easily add a totals row d. Easy formatting with preformatted
M i c r o s o f t E x c e l A d v a n c e d P a r t 3-4. Microsoft Excel Advanced 3-4
 Microsoft Excel 2010 Advanced 3-4 0 Absolute references There may be times when you do not want a cell reference to change when copying or filling cells. You can use an absolute reference to keep a row
XLCubed Version 9 QuickStart
 XLCubed Version 9 QuickStart 1 P a g e Contents Welcome... 3 Connecting to your data... 3 XLCubed for Pivot Table users... 3 Adding a Grid, and the Report Designer... 5 Working with Grids... 7 Grid Components...
SUM - This says to add together cells F28 through F35. Notice that it will show your result is
 COUNTA - The COUNTA function will examine a set of cells and tell you how many cells are not empty. In this example, Excel analyzed 19 cells and found that only 18 were not empty. COUNTBLANK - The COUNTBLANK
Microsoft Excel 2007 Lesson 7: Charts and Comments
 Microsoft Excel 2007 Lesson 7: Charts and Comments Open Example.xlsx if it is not already open. Click on the Example 3 tab to see the worksheet for this lesson. This is essentially the same worksheet that
HOUR 12. Adding a Chart
 HOUR 12 Adding a Chart The highlights of this hour are as follows: Reasons for using a chart The chart elements The chart types How to create charts with the Chart Wizard How to work with charts How to
Excel Basics Rice Digital Media Commons Guide Written for Microsoft Excel 2010 Windows Edition by Eric Miller
 Excel Basics Rice Digital Media Commons Guide Written for Microsoft Excel 2010 Windows Edition by Eric Miller Table of Contents Introduction!... 1 Part 1: Entering Data!... 2 1.a: Typing!... 2 1.b: Editing
Open a new Excel workbook and look for the Standard Toolbar.
 This activity shows how to use a spreadsheet to draw line graphs. Open a new Excel workbook and look for the Standard Toolbar. If it is not there, left click on View then Toolbars, then Standard to make
Microsoft. Excel. Microsoft Office Specialist 2010 Series EXAM COURSEWARE Achieve more. For Evaluation Only
 Microsoft Excel 2010 Microsoft Office Specialist 2010 Series COURSEWARE 3243 1 EXAM 77 882 Achieve more Microsoft Office Specialist 2010 Microsoft Excel Core Certification 2010 Lesson 6: Working with
Microsoft Excel 2007
 Learning computers is Show ezy Microsoft Excel 2007 301 Excel screen, toolbars, views, sheets, and uses for Excel 2005-8 Steve Slisar 2005-8 COPYRIGHT: The copyright for this publication is owned by Steve
Lastly, in case you don t already know this, and don t have Excel on your computers, you can get it for free through IT s website under software.
 Welcome to Basic Excel, presented by STEM Gateway as part of the Essential Academic Skills Enhancement, or EASE, workshop series. Before we begin, I want to make sure we are clear that this is by no means
Microsoft Office 2010: Introductory Q&As Access Chapter 2
 Microsoft Office 2010: Introductory Q&As Access Chapter 2 Is it necessary to close the Navigation Pane? (AC 78) No. It gives you more room for the query, however, so it is usually a good practice to hide
INTRODUCTION... 1 UNDERSTANDING CELLS... 2 CELL CONTENT... 4
 Introduction to Microsoft Excel 2016 INTRODUCTION... 1 The Excel 2016 Environment... 1 Worksheet Views... 2 UNDERSTANDING CELLS... 2 Select a Cell Range... 3 CELL CONTENT... 4 Enter and Edit Data... 4
Excel Advanced
 Excel 2016 - Advanced LINDA MUCHOW Alexandria Technical & Community College 320-762-4539 lindac@alextech.edu Table of Contents Macros... 2 Adding the Developer Tab in Excel 2016... 2 Excel Macro Recorder...
How to Set up a Budget Advanced Excel Part B
 How to Set up a Budget Advanced Excel Part B A budget is probably the most important spreadsheet you can create. A good budget will keep you focused on your ultimate financial goal and help you avoid spending
THE EXCEL ENVIRONMENT... 1 EDITING...
 Excel Essentials TABLE OF CONTENTS THE EXCEL ENVIRONMENT... 1 EDITING... 1 INSERTING A COLUMN... 1 DELETING A COLUMN... 1 INSERTING A ROW... DELETING A ROW... MOUSE POINTER SHAPES... USING AUTO-FILL...
Using Large Data Sets Workbook Version A (MEI)
") Using Large Data Sets Workbook Version A (MEI) 1 Index Key Skills Page 3 Becoming familiar with the dataset Page 3 Sorting and filtering the dataset Page 4 Producing a table of summary statistics with
Using Large Data Sets Workbook Version A (MEI) 1 Index Key Skills Page 3 Becoming familiar with the dataset Page 3 Sorting and filtering the dataset Page 4 Producing a table of summary statistics with
Microsoft Excel 2010
 www.jadehorizon.com Microsoft Excel 2010 Sorting and Filtering Sorting and Filtering Microsoft Excel 2010 Table of Contents Table of Contents INTRODUCTION... 3 CONVENTIONS... 3 TABLE DESIGN RULES... 5
Excel Tables & PivotTables
 Excel Tables & PivotTables A PivotTable is a tool that is used to summarize and reorganize data from an Excel spreadsheet. PivotTables are very useful where there is a lot of data that to analyze. PivotTables
Chapter 4: Single Table Form Lab
 Chapter 4: Single Table Form Lab Learning Objectives This chapter provides practice with creating forms for individual tables in Access 2003. After this chapter, you should have acquired the knowledge
EXCEL BASICS: MICROSOFT OFFICE 2010
 EXCEL BASICS: MICROSOFT OFFICE 2010 GETTING STARTED PAGE 02 Prerequisites What You Will Learn USING MICROSOFT EXCEL PAGE 03 Opening Microsoft Excel Microsoft Excel Features Keyboard Review Pointer Shapes
Downloading General Ledger Transactions to Excel
 SAN MATEO COUNTY OFFICE OF EDUCATION CECC Financial System Procedures This document provides instructions on how to download the transactions listed on an HP 3000 GLD110 report into Excel using a GLD110
What s New in Spotfire DXP 1.1. Spotfire Product Management January 2007
 What s New in Spotfire DXP 1.1 Spotfire Product Management January 2007 Spotfire DXP Version 1.1 This document highlights the new capabilities planned for release in version 1.1 of Spotfire DXP. In this
Using Charts in a Presentation 6
 Using Charts in a Presentation 6 LESSON SKILL MATRIX Skill Exam Objective Objective Number Building Charts Create a chart. Import a chart. Modifying the Chart Type and Data Change the Chart Type. 3.2.3
Your Name: Section: INTRODUCTION TO STATISTICAL REASONING Computer Lab #4 Scatterplots and Regression
 Your Name: Section: 36-201 INTRODUCTION TO STATISTICAL REASONING Computer Lab #4 Scatterplots and Regression Objectives: 1. To learn how to interpret scatterplots. Specifically you will investigate, using
Spotlight Session Analysing answers to open-ended questions from surveys
 Spotlight Session Analysing answers to open-ended questions from surveys Excel format for data preparation: Column A controls the grouping of the texts in the Document System in MAXQDA. Enter the same
Excel Select a template category in the Office.com Templates section. 5. Click the Download button.
 Microsoft QUICK Excel 2010 Source Getting Started The Excel Window u v w z Creating a New Blank Workbook 2. Select New in the left pane. 3. Select the Blank workbook template in the Available Templates
Microsoft Word for Report-Writing (2016 Version)
") Microsoft Word for Report-Writing (2016 Version) Microsoft Word is a versatile, widely-used tool for producing presentation-quality documents. Most students are well-acquainted with the program for generating
Microsoft Word for Report-Writing (2016 Version) Microsoft Word is a versatile, widely-used tool for producing presentation-quality documents. Most students are well-acquainted with the program for generating
Using Microsoft Excel
 About Excel Using Microsoft Excel What is a Spreadsheet? Microsoft Excel is a program that s used for creating spreadsheets. So what is a spreadsheet? Before personal computers were common, spreadsheet
EXCEL BASICS: MICROSOFT OFFICE 2007
 EXCEL BASICS: MICROSOFT OFFICE 2007 GETTING STARTED PAGE 02 Prerequisites What You Will Learn USING MICROSOFT EXCEL PAGE 03 Opening Microsoft Excel Microsoft Excel Features Keyboard Review Pointer Shapes
Using Microsoft Word. Tables
 Using Microsoft Word are a useful way of arranging information on a page. In their simplest form, tables can be used to place information in lists. More complex tables can be used to arrange graphics on
Using Microsoft Excel
 Using Microsoft Excel Formatting a spreadsheet means changing the way it looks to make it neater and more attractive. Formatting changes can include modifying number styles, text size and colours. Many
Excel 2007 Fundamentals
 Excel 2007 Fundamentals Introduction The aim of this document is to introduce some basic techniques for using Excel to enter data, perform calculations and produce simple charts based on that information.
Excel Tips for Compensation Practitioners Weeks Text Formulae
 Excel Tips for Compensation Practitioners Weeks 70-73 Text Formulae Week 70 Using Left, Mid and Right Formulae When analysing compensation data, you generally extract data from the payroll, the HR system,
Gloucester County Library System EXCEL 2007
 Gloucester County Library System EXCEL 2007 Introduction What is Excel? Microsoft E x c e l is an electronic s preadsheet program. I t is capable o f performing many diff e r e n t t y p e s o f c a l
Opening a Data File in SPSS. Defining Variables in SPSS
 Opening a Data File in SPSS To open an existing SPSS file: 1. Click File Open Data. Go to the appropriate directory and find the name of the appropriate file. SPSS defaults to opening SPSS data files with
SHOW ME THE NUMBERS: DESIGNING YOUR OWN DATA VISUALIZATIONS PEPFAR Applied Learning Summit September 2017 A. Chafetz
 SHOW ME THE NUMBERS: DESIGNING YOUR OWN DATA VISUALIZATIONS PEPFAR Applied Learning Summit September 2017 A. Chafetz Overview In order to prepare for the upcoming POART, you need to look into testing as
Advanced Excel Skills
 Advanced Excel Skills Note : This tutorial is based upon MSExcel 2000. If you are using MSExcel 2002, there may be some operations which look slightly different (e.g. pivot tables), but the same principles
Excel Tips for Compensation Practitioners Weeks Pivot Tables
 Excel Tips for Compensation Practitioners Weeks 23-28 Pivot Tables Week 23 Creating a Pivot Table Pivot tables are one of the most amazing and powerful tools in Excel, but many users do not know how to
The first thing we ll need is some numbers. I m going to use the set of times and drug concentration levels in a patient s bloodstream given below.
 Graphing in Excel featuring Excel 2007 1 A spreadsheet can be a powerful tool for analyzing and graphing data, but it works completely differently from the graphing calculator that you re used to. If you
Chapter 4. Microsoft Excel
 Chapter 4 Microsoft Excel Topic Introduction Spreadsheet Basic Screen Layout Modifying a Worksheet Formatting Cells Formulas and Functions Sorting and Filling Borders and Shading Charts Introduction A
Microsoft Excel XP. Intermediate
 Microsoft Excel XP Intermediate Jonathan Thomas March 2006 Contents Lesson 1: Headers and Footers...1 Lesson 2: Inserting, Viewing and Deleting Cell Comments...2 Options...2 Lesson 3: Printing Comments...3
Practical 2: Using Minitab (not assessed, for practice only!)
") Practical 2: Using Minitab (not assessed, for practice only!) Instructions 1. Read through the instructions below for Accessing Minitab. 2. Work through all of the exercises on this handout. If you need
Practical 2: Using Minitab (not assessed, for practice only!) Instructions 1. Read through the instructions below for Accessing Minitab. 2. Work through all of the exercises on this handout. If you need
Tricking it Out: Tricks to personalize and customize your graphs.
 Tricking it Out: Tricks to personalize and customize your graphs. Graphing templates may be used online without downloading them onto your own computer. However, if you would like to use the templates
Introduction to Excel 2013
 Introduction to Excel 2013 Copyright 2014, Software Application Training, West Chester University. A member of the Pennsylvania State Systems of Higher Education. No portion of this document may be reproduced
Survey of Math: Excel Spreadsheet Guide (for Excel 2016) Page 1 of 9
 Page 1 of 9") Survey of Math: Excel Spreadsheet Guide (for Excel 2016) Page 1 of 9 Contents 1 Introduction to Using Excel Spreadsheets 2 1.1 A Serious Note About Data Security.................................... 2 1.2
Survey of Math: Excel Spreadsheet Guide (for Excel 2016) Page 1 of 9 Contents 1 Introduction to Using Excel Spreadsheets 2 1.1 A Serious Note About Data Security.................................... 2 1.2
EXCEL 2010 BASICS JOUR 772 & 472 / Ira Chinoy
 EXCEL 2010 BASICS JOUR 772 & 472 / Ira Chinoy Virus check and backups: Remember that if you are receiving a file from an external source a government agency or some other source, for example you will want
6. Essential Spreadsheet Operations
 6. Essential Spreadsheet Operations 6.1 Working with Worksheets When you open a new workbook in Excel, the workbook has a designated number of worksheets in it. You can specify how many sheets each new
Lastly, in case you don t already know this, and don t have Excel on your computers, you can get it for free through IT s website under software.
 Welcome to the EASE workshop series, part of the STEM Gateway program. Before we begin, I want to make sure we are clear that this is by no means meant to be an all inclusive class in Excel. At each step,
Navigating in SPSS. C h a p t e r 2 OBJECTIVES
 C h a p t e r 2 Navigating in SPSS 2.1 Introduction and Objectives As with any new software program you may use, it is important that you are able to move around the screen with the mouse and that you
TOF-Watch SX Monitor
 TOF-Watch SX Monitor User manual Version 1.2 Organon (Ireland) Ltd. Drynam Road Swords Co. Dublin Ireland Contents General information... 3 Getting started... 3 File Window... 7 File Menu... 10 File Open
Business Process Procedures
 Business Process Procedures 14.40 MICROSOFT EXCEL TIPS Overview These procedures document some helpful hints and tricks while using Microsoft Excel. Key Points This document will explore the following:
Managed Reporting Environment
 Managed Reporting Environment WebFOCUS MANAGED REPORTING What is MRE and what does it mean for FLAIR users? MRE extends services to agencies giving them secure, self-service Web access to information they
Introductory Excel Walpole Public Schools. Professional Development Day March 6, 2012
 Introductory Excel 2010 Walpole Public Schools Professional Development Day March 6, 2012 By: Jessica Midwood Agenda: What is Excel? How is Excel 2010 different from Excel 2007? Basic functions of Excel
MicroStrategy Desktop
 MicroStrategy Desktop Quick Start Guide MicroStrategy Desktop is designed to enable business professionals like you to explore data, simply and without needing direct support from IT. 1 Import data from
Introduction to Excel 2007
 Introduction to Excel 2007 These documents are based on and developed from information published in the LTS Online Help Collection (www.uwec.edu/help) developed by the University of Wisconsin Eau Claire
Data Visualization via Conditional Formatting
 Data Visualization Data visualization - the process of displaying data (often in large quantities) in a meaningful fashion to provide insights that will support better decisions. Data visualization improves
Designed by Jason Wagner, Course Web Programmer, Office of e-learning NOTE ABOUT CELL REFERENCES IN THIS DOCUMENT... 1
 Excel Essentials Designed by Jason Wagner, Course Web Programmer, Office of e-learning NOTE ABOUT CELL REFERENCES IN THIS DOCUMENT... 1 FREQUENTLY USED KEYBOARD SHORTCUTS... 1 FORMATTING CELLS WITH PRESET
Introduction to Microsoft Excel 2010
 Introduction to Microsoft Excel 2010 This class is designed to cover the following basics: What you can do with Excel Excel Ribbon Moving and selecting cells Formatting cells Adding Worksheets, Rows and
-Using Excel- *The columns are marked by letters, the rows by numbers. For example, A1 designates row A, column 1.
 -Using Excel- Note: The version of Excel that you are using might vary slightly from this handout. This is for Office 2004 (Mac). If you are using a different version, while things may look slightly different,
A cell is highlighted when a thick black border appears around it. Use TAB to move to the next cell to the LEFT. Use SHIFT-TAB to move to the RIGHT.
 Instructional Center for Educational Technologies EXCEL 2010 BASICS Things to Know Before You Start The cursor in Excel looks like a plus sign. When you click in a cell, the column and row headings will
Excel 2003 Tutorial II
 This tutorial was adapted from a tutorial by see its complete version at http://www.fgcu.edu/support/office2000/excel/index.html Excel 2003 Tutorial II Charts Chart Wizard Chart toolbar Resizing a chart
Lesson 4: Introduction to the Excel Spreadsheet 121
 Lesson 4: Introduction to the Excel Spreadsheet 121 In the Window options section, put a check mark in the box next to Formulas, and click OK This will display all the formulas in your spreadsheet. Excel
How to work a workbook
 CHAPTER 7 How to work a workbook Managing multiple workbooks...173 Opening multiple windows for the same workbook....178 Hiding and protecting workbooks...182 In early versions of Microsoft Excel, worksheets,
Microsoft Excel 2010 Training. Excel 2010 Basics
 Microsoft Excel 2010 Training Excel 2010 Basics Overview Excel is a spreadsheet, a grid made from columns and rows. It is a software program that can make number manipulation easy and somewhat painless.
Section 4 General Factorial Tutorials
 Section 4 General Factorial Tutorials General Factorial Part One: Categorical Introduction Design-Ease software version 6 offers a General Factorial option on the Factorial tab. If you completed the One