Golden Software, Inc.
|
|
|
- Camron Porter
- 6 years ago
- Views:
Transcription

1 Golden Software, Inc. Only $299!


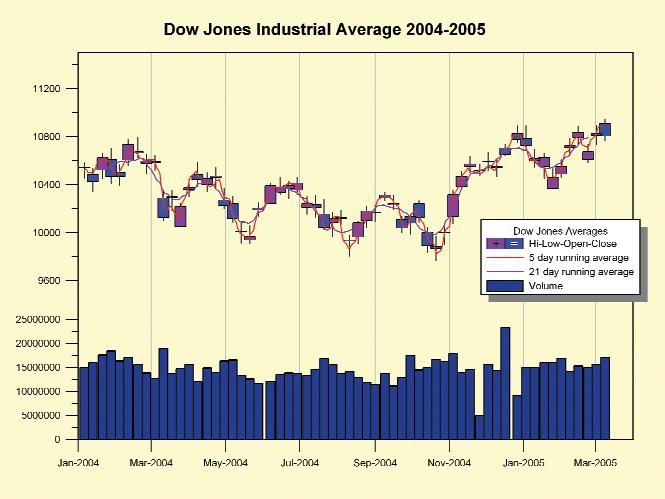
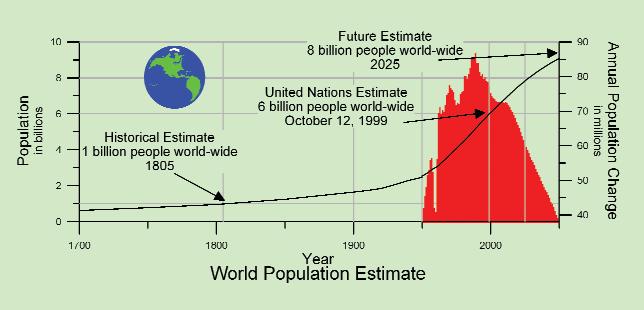
2 The most sophisticated graphing package available, providing the professional quality you need with the flexibility you want. Create one of the more than 30 different graph types! Customize any portion of any graph to display and highlight only the information you want to show. Discover the easy-to-use, powerful, and dynamic capabilities of Grapher 6! Use the most superior graphing package available to make your graphs. Every graph should be the highest quality, most professional graph possible. Using Grapher makes every graph impressive every time. Present your data accurately using one of the many graph types, such as this line/scatter graph! Easily graph your data with fit curves and confidence intervals to reveal additional details about your data! Grapher will help you present your graph in a clear and precise manner. Include text, drawn objects, custom colors and styles, and add additional supporting details such as company logos to present your graph to your target audience. Use the new vector plot, 3D XYZ floating bar chart, contour maps, and surface maps to present your data in never-before envisioned ways. GeoMEM Ltd.:


3 Simple Customizations Making changes to your graphs has never been easier! The new default properties allow you to save common settings for each graph type and each object that you make in Grapher. The tabbed property inspector allows you to make all changes to your graph immediately, without pressing an Apply button or even opening a dialog box in most situations. Some of the changes that can be made to your graph include: Use a 3D surface map to display your data! Use one of many predefined fill patterns or import your own bitmap images to enhance the appearance of your graph background. Faster and Easier Grapher makes it easier to access your data than ever before! With a click of a button, you can open your data file in the Grapher worksheet or create a graph directly from your data file. Grapher supports several popular data formats, including complete compatibility with Microsoft Excel, Microsoft SLK, and ASCII text. change all line properties, including width, color, and style change all fill properties, including style, foreground color, background color, and transparency change colors of any object by selecting a predefined color, a gradient fill color, or creating a custom color move plot labels with the mouse to avoid overlapping add error bars, fit curves, confidence intervals, titles, and legends change tick marks, tick spacing, or tick labels control the rows and columns used to create the curve separately from the rows and column used to create the labels eliminate unwanted data on a graph by using clipping limits created from worksheet numbers or text edit multiple graphs or multiple objects at once for easier across-the-board changes New to Grapher? Try the Graph Wizard to create your graphs. All you have to do is select the plot type and data file and let Grapher do the rest! Do you create the same type of graph on a regular basis? If so, using a template to store graph preferences will save you time, money, and energy. In addition, the same format will be used for every graph, every time - making comparing graphs effortless. Tired of continually updating your graphs manually? Automate it! Use Grapher's powerful scripting language to create or alter graphs. Grapher can be called from Golden Software's Scripter program, Visual Basic, Visual C++, or any other OLE Automation compliant language, including Excel and Access. Complete the creation of all of your repetitive tasks with a single click of your mouse. Display multiple bar charts with varying Z values using the new 3D XYZ bar chart! Add multiple charts to compare different data sets. Questions? info@geomem.co.uk


4 Free Unlimited Technical Support What do you do when you have a question? Take your pick! Consult the easy-to-read Getting Started Guide, check the dynamic online help, browse the Grapher Support Forum or Grapher FAQs on the Golden Software web site, or simply give us a call! Our knowledgeable and friendly Technical Support staff is standing by to answer your questions Monday through Friday, 8am - 5pm Mountain Standard Time. Technical Support is also available by fax or and is free to all users. Grapher lets you create bar charts with the ability to have control over each individual bar color! Organize Your Graph Organize the objects in your graph visually using the always available Object Manager. Drag and drop capabilities make rearranging the order of objects simple. Add multiple plots to the same graph and add multiple graphs to the same page. Grapher displays the outline of the page on the screen, so you can design the layout of your graphs on the page exactly the way you want it! In addition, Grapher allows you to import a variety of file formats from other programs. Import objects or maps from Golden Software's Surfer, Didger, Strater or MapViewer programs. Or, import objects from other programs. Use Grapher for your final page layout! Combine multiple graphs to visually compare trends in data! Grapher allows you to easily stack graphs vertically to show multiple variables on the same page! Order Grapher Today! Your complete Grapher 6 package includes the CD, Getting Started Guide, free technical support, and free Grapher 6 updates. Stay up-to-date with the Check for Update command! Place your order or download a free demo version online at: Create a 3D pie chart using different colors for each sector. This chart type is perfect for determining the proportion each separate variable has of all of the variables. Please contact GeoMEM if you have any questions or need more information. us at info@geomem.co.uk or call us at: or


5 Visualize the Grapher difference! Choose your graph type, make any of your choice of customizations, and present your graph the way you want to see it - in minutes!
6 Grapher Features What s new in Grapher 6? v v User Friendly Axes, Tick Marks, Tick Labels, and Legends Default Settings for all objects Use the Start and End Angle to display a portion of polar plot "No to all" option to dialog displayed when loading a plot Polar plot Radius Axis may be set to any angle with a missing worksheet Ability to split long axis labels into multiple lines "Use same worksheet" option to worksheet open dialog if Added default legend symbol size setting "Yes" is selected to picking new worksheet. Add a step count to grid lines Property Inspector Remove the "1x" from superscripted exponential labels Preview the graph when using File Open Choose one of five different axis scales (Linear, Log, etc.) Display multiple plot documents in a tabbed view Break an axis in one location Customize the toolbars and menus Use superscripted exponential labels (1E009 becomes 109) Store data internally or reference an external data file Add axis grid lines Save as previous Grapher version GRF Add a top-level legend Object Manager, Graph Wizard, and Worksheet Manager Set axis attributes (titles, tick marks, and tick labels) Print multiple graphs based on a single graph file Create date axis labels and choose the date format Create tick labels from worksheet columns 2D Plot Types Create multiple axes for one graph Vector Plot Polar Bar Chart, Candlestick Plot (specialty Hi-Low-Close) Worksheet Polar Function Plot, Wind Chart Reload worksheet files changed in other applications Bubble Plot, Box-Whisker Plot, Ternary Diagram, Step Plot, Open an Excel spreadsheet as a native Excel document Floating Bar Chart, Rose Diagram Use date/times for data in a worksheet Histogram, Pie Chart, Polar Plot Open XLS, DAT, SLK, W??, CSV, BLN, BNA, and TXT Line/Scatter Plot, Bar Chart, Function Plot, Hi-Low-Close Plot Save data in XLS, DAT, SLK, CSV, BLN, BNA, and TXT Calculate statistics and transform data using equations 3D XYY Plot Types Pie Chart ActiveX Automation Ribbon/Wall Plot, Step Plot, Bar Chart, Floating Bar Chart, Includes Scripter, a VB compatible scripting program Function Plot, Histogram Compatible with any ActiveX Automation language OLE compatible for easy object linking and embedding 3D XYZ Plot Types Contour Data Map, Contour Grid Map Data Analysis Tools Surface Data Map, Surface Grid Map, Surface Function Map NULL criteria excludes data by numbers or data ranges Floating Bar Chart Set a baseline value when calculating the area under a curve Bar Chart, Bubble Plot Column criteria selects data based on data in another column Line/Scatter Calculate and display the area under a line plot Export histogram bin count and cumulative frequency Graph Customization Export function plots and fit curves Edit multiple graph objects at once Assign coordinates to bitmaps and digitize from them Export contour or surface map gridding to a Surfer grid file Digitize anywhere on the graph Label bar charts at the top or bottom of the bar Add fit curves Create confidence intervals with fit plots Project the curve of the line onto graph walls for 3D line plots Drawing Tools Add a drop shadow behind the legend box Fill using gradient colors Specify different colors for individual bars and bubbles in bar Add file name, date, title, or file path into plot header/footer charts, bubble plots, and histograms Use predefined or create custom picture patterns Add fill for function plots Add background color to text blocks Add graph background fill and graph outline box Add headers and footers to graphs Use different outline and fill colors for symbols Create custom bitmap and vector fill patterns Display horizontal or vertical drop lines on 3D XYZ plots Text Editor supports advanced text editing techniques Restrict plot labels by rows Add text, polygons, polylines, symbols, rectangles, and ellipses Ternary plots can use labels from any column in the data file Rotate, move, reshape, align, and combine objects Display pie chart labels in the same color as the pie slice Scale bubble plot symbols by data values Import Formats Move plot labels using the mouse E00, GSI Lock an object's position EMF, DDF Rotate 3D graphs interactively GSB, BNA, DLG, LGO, LGS, DXF, PLT, BLN, CLP, WMF, TIF, Use any symbol as the scaled symbol in bubble plots BMP, TGA, PCX, WPG, DCX, EPS, JPG, PCT, SHP, MIF, PNG, Fill under curves and between two curves GIF Easily convert one plot type to another Fill direction can be right/left, up/down, and to a value Export Formats Display bar and floating bar charts vertically or horizontally PDF, EPS Add a graph title GSI Add multiple plots to one graph, plot labels, and error bars EMF, SHP, BNA, BLN, MIF Clip plots to control the display of out-of-range data WMF, CLP, DXF, CGM, TIF, BMP, TGA, PCX, WPG, JPG, PCT, Choose continuous or discontinuous plot settings DCX, PNG, GIF System Requirements Windows 98, ME, 2000, XP or higher 128 MB RAM minimum 55 MB free hard disk space 800x600x256 colors min. resolution GeoMEM Ltd. 1 High Street, Blairgowrie, Perthshire PH10 6ET, United Kingdom FAX
Enhance data presentation with summation plots to add additional information to your graph.
 Only $349! Exciting New Features... Display your data as a colorful and informative new stiff diagram! Create the graph you want! Add colors and widths for bar charts directly from the worksheet! Enhance
Quick. Efficient. Versatile. Graphing Software for Scientists and Engineers.
 Quick. GrapherTM 3 Efficient. Versatile. Graphing Discover the easy-to-use and powerful capabilities of Grapher 3! Your graphs are too important not to use the most superior graphing program available.
The Industry Standard in Mapping Solutions. Contouring and 3D Surface Mapping for Scientists and Engineers
 The Industry Standard in Mapping Solutions Only $599! Contouring and 3D Surface Mapping for Scientists and Engineers w w w. g o l d e n s o f t w a r e. c o m The software of choice for creating contour
GRAPHER. Grapher Overview
 GRAPHER Grapher Overview Grapher is the ultimate technical graphing package available. This easy-to-use, powerful, dynamic program will help you create superior publication-quality professional graphs
Discover the Depths of Your Data!
 www.goldensoftware.cz Discover the Depths of Your Data! Golden Software Presents Powerful and Innovative Well Log and Borehole Plotting for Geoscientists Golden Software, Inc. From the developers of Surfer
Heights. Heights. d i.
 Take Take Your Your Data Data to to New New Heights Heights Quick St Gold In www.goldensoftware.com c. e d i u G art ft o S en e, w ar Grapher TM Registration Information Your Grapher serial number is
Grapher, User's Guide
 Grapher, User's Guide Grapher TM Registration Information Your Grapher product key is located in the email download instructions and in your account at MyAccount.GoldenSoftware.com. Register your Grapher
Surfer 8 Overview. Which Surfer Features Would You Like to Learn About? Contour Maps
 Surfer 8 Overview Surfer is a contouring and 3D surface mapping program that runs under Microsoft Windows. It quickly and easily converts your data into outstanding contour, surface, wireframe, vector,
Grapher, Quick Start Guide
 Grapher, Quick Start Guide Grapher TM Registration Information Your Grapher product key is located in the email download instructions and in your account at MyAccount.GoldenSoftware.com. Register your
Creating a Basic Chart in Excel 2007
 Creating a Basic Chart in Excel 2007 A chart is a pictorial representation of the data you enter in a worksheet. Often, a chart can be a more descriptive way of representing your data. As a result, those
DesignCAD 25.1 Release Notes
 DesignCAD 25.1 Release Notes October 2015. DesignCAD 25.1 contains the following enhancements and improvements: File Save improvements: Historically, some users have been having problems when saving directly
Choosing the Right BarTender Edition
 LABEL & RFID SOFTWARE White Paper Choosing the Right BarTender Edition Edition Summary and Feature Comparison Chart Choosing the Right BarTender Edition Edition Summary and Feature Comparison Chart BarTender
BarTender Editions Summary
 BarTender Editions Summary Enterprise Print Server EP RFID Enterprise RE Enterprise E Professional P Basic B EDITIONS: EP RE E P B GENERAL Licensed based on the number of printers used Licensed based on
Microsoft Excel 2016 / 2013 Basic & Intermediate
 Microsoft Excel 2016 / 2013 Basic & Intermediate Duration: 2 Days Introduction Basic Level This course covers the very basics of the Excel spreadsheet. It is suitable for complete beginners without prior
Chapter 2 Surfer Tutorial
 Chapter 2 Surfer Tutorial Overview This tutorial introduces you to some of Surfer s features and shows you the steps to take to produce maps. In addition, the tutorial will help previous Surfer users learn
Creating and Modifying Charts
 Creating and Modifying Charts Introduction When you re ready to share data with others, a worksheet might not be the most effective way to present the information. A page full of numbers, even if formatted
This section provides an overview of the features available within the Standard, Align, and Text Toolbars.
 Using Toolbars Overview This section provides an overview of the features available within the Standard, Align, and Text Toolbars. Using toolbar icons is a convenient way to add and adjust label objects.
Content provided in partnership with Que, from the book Show Me Microsoft Office Access 2003 by Steve JohnsonÃÃ
 ,PSURYLQJWKH$SSHDUDQFHRI )RUPVDQGHSRUWV Content provided in partnership with Que, from the book Show Me Microsoft Office Access 00 by Steve JohnsonÃÃ Introduction The objects in a database most on display
Choosing the Right BarTender Edition
 LABEL PRINTING SOFTWARE White Paper Choosing the Right BarTender Edition Edition Summary and Feature Comparison Chart Choosing the Right BarTender Edition Edition Summary and Feature Comparison Chart BarTender
Index COPYRIGHTED MATERIAL. Symbols and Numerics
 Symbols and Numerics ( ) (parentheses), in functions, 173... (double quotes), enclosing character strings, 183 #...# (pound signs), enclosing datetime literals, 184... (single quotes), enclosing character
Surfer 10 Self-Paced Training Guide
 Surfer 10 Self-Paced Training Guide I. Introduction to Surfer 1 What Surfer can do Types of files that can be imported Types of files that can be exported Setting options II. Preparing a Base and Post
Microsoft Office Excel 2010: Basic. Course Overview. Course Length: 1 Day. Course Overview
 Microsoft Office Excel 2010: Basic Course Length: 1 Day Course Overview This course teaches the basic functions and features of Excel 2010. After an introduction to spreadsheet terminology and Excel's
BusinessObjects Frequently Asked Questions
 BusinessObjects Frequently Asked Questions Contents Is there a quick way of printing together several reports from the same document?... 2 Is there a way of controlling the text wrap of a cell?... 2 How
Elixir Ad-hoc Report. Release Elixir Technology Pte Ltd
 Elixir Ad-hoc Report Release 4.0.0 Elixir Technology Pte Ltd Elixir Ad-hoc Report: Release 4.0.0 Elixir Technology Pte Ltd Published 2015 Copyright 2015 Elixir Technology Pte Ltd All rights reserved. Java
Converting Your PDFs to Excel
 Converting Your PDFs to Excel Easy 3-Step Guide STEP 1: OPEN YOUR PDF Select the Open... command from the File menu. STEP 3: CONVERTING TO EXCEL After selecting, you are ready for conversion. For conversions
Office Excel. Charts
 Office 2007 Excel Charts October 2007 CONTENTS INTRODUCTION... 1 Bold text... 2 CHART TYPES... 3 CHOOSING A CHART... 4 CREATING A COLUMN CHART... 5 FORMATTING A COLUMN CHART... 8 Changing the chart style...
Working with Charts Stratum.Viewer 6
 Working with Charts Stratum.Viewer 6 Getting Started Tasks Additional Information Access to Charts Introduction to Charts Overview of Chart Types Quick Start - Adding a Chart to a View Create a Chart with
Solo 4.6 Release Notes
 June9, 2017 (Updated to include Solo 4.6.4 changes) Solo 4.6 Release Notes This release contains a number of new features, as well as enhancements to the user interface and overall performance. Together
Desktop Studio: Charts. Version: 7.3
 Desktop Studio: Charts Version: 7.3 Copyright 2015 Intellicus Technologies This document and its content is copyrighted material of Intellicus Technologies. The content may not be copied or derived from,
City of La Crosse Online Mapping Website Help Document
 City of La Crosse Online Mapping Website Help Document This document was created to assist in using the new City of La Crosse online mapping sites. When the website is first opened, a map showing the City
FactoryLink 7. Version 7.0. Client Builder Reference Manual
 FactoryLink 7 Version 7.0 Client Builder Reference Manual Copyright 2000 United States Data Corporation. All rights reserved. NOTICE: The information contained in this document (and other media provided
HOUR 12. Adding a Chart
 HOUR 12 Adding a Chart The highlights of this hour are as follows: Reasons for using a chart The chart elements The chart types How to create charts with the Chart Wizard How to work with charts How to
-Table of Contents- 1. Overview Installation and removal Operation Main menu Trend graph... 13
 Thank you for buying Data Analysis Software. In order to use this software correctly and safely and to prevent trouble, please read this manual carefully. Notice 1. No part of this manual can be reproduced
Creating and Displaying Multi-Layered Cross Sections in Surfer 11
 Creating and Displaying Multi-Layered Cross Sections in Surfer 11 The ability to create a profile in Surfer has always been a powerful tool that many users take advantage of. The ability to combine profiles
Gloucester County Library System EXCEL 2007
 Gloucester County Library System EXCEL 2007 Introduction What is Excel? Microsoft E x c e l is an electronic s preadsheet program. I t is capable o f performing many diff e r e n t t y p e s o f c a l
What's New in Surfer 14?
 What's New in Surfer 14? There are many very exciting new features in Surfer v14! We focused on increasing usability, improving workflows to increase time savings, and including the most popular new features
Desktop Studio: Charts
 Desktop Studio: Charts Intellicus Enterprise Reporting and BI Platform Intellicus Technologies info@intellicus.com www.intellicus.com Working with Charts i Copyright 2011 Intellicus Technologies This document
The Chart Title can be formatted to change color, pattern, typeface, size and alignment using the Format Chart Title dialog box.
 Excel 2003 Formatting a Chart Introduction Page 1 By the end of this lesson, learners should be able to: Format the chart title Format the chart legend Format the axis Formatting the Chart Title Page 2
MicroStrategy Desktop
 MicroStrategy Desktop Quick Start Guide MicroStrategy Desktop is designed to enable business professionals like you to explore data, simply and without needing direct support from IT. 1 Import data from
Information Technology and Media Services. Office Excel. Charts
 Information Technology and Media Services Office 2010 Excel Charts August 2014 Information Technology and Media Services CONTENTS INTRODUCTION... 1 CHART TYPES... 3 CHOOSING A CHART... 4 CREATING A COLUMN
Technology Assignment: Scatter Plots
 The goal of this assignment is to create a scatter plot of a set of data. You could do this with any two columns of data, but for demonstration purposes we ll work with the data in the table below. You
Following a tour is the easiest way to learn Prism.
 Page 1 of 25 A tour of Prism Following a tour is the easiest way to learn Prism. View a movie Watch and listen to a ten minute introductory movie from Prism's Welcome dialog. Or view it on the web. Read
Converting Your PDFs to Excel
 Converting Your PDFs to Excel Easy 3-Step Guide STEP 1: OPEN YOUR PDF Select the Open... command from the File menu. STEP 3: CONVERTING TO EXCEL After selecting, you are ready for conversion. For conversions
Microsoft Office PowerPoint 2013 Courses 24 Hours
 Microsoft Office PowerPoint 2013 Courses 24 Hours COURSE OUTLINES FOUNDATION LEVEL COURSE OUTLINE Using PowerPoint 2013 Opening PowerPoint 2013 Opening a Presentation Navigating between Slides Using the
DeltaGraph 5. User s Guide. for Windows
 DeltaGraph 5 User s Guide for Windows Red Rock Software, Inc. 10 West Broadway, Suite 475 Salt Lake City, Utah 84101 801.322.4322 http://www.redrocksw.com DeltaGraph 5 User s Guide for Windows Copyright
Getting Started with. PowerPoint 2010
 Getting Started with 13 PowerPoint 2010 You can use PowerPoint to create presentations for almost any occasion, such as a business meeting, government forum, school project or lecture, church function,
Chapter 10 Working with Graphs and Charts
 Chapter 10: Working with Graphs and Charts 163 Chapter 10 Working with Graphs and Charts Most people understand information better when presented as a graph or chart than when they look at the raw data.
Code Finix Label Designer V 1.0 User Guide
 Code Finix Label Designer V 1.0 User Guide Introduction Welcome, Code Finix Label Designer is a family of professional labeling software products that brings a complete barcode printing solution for desktop
5Using Drawings, Pictures. and Graphs. Drawing in ReportSmith. Chapter
 5Chapter 5Using Drawings, Pictures Chapter and Graphs Besides system and custom report styles, ReportSmith offers you several means of achieving variety and impact in your reports, by: Drawing objects
Separate Text Across Cells The Convert Text to Columns Wizard can help you to divide the text into columns separated with specific symbols.
 Chapter 7 Highlights 7.1 The Use of Formulas and Functions 7.2 Creating Charts 7.3 Using Chart Toolbar 7.4 Changing Source Data of a Chart Separate Text Across Cells The Convert Text to Columns Wizard
For Microsoft Office XP or Student Workbook. TECHNOeBooks Project-based Computer Curriculum ebooks.
 TECHNOConsultant For Microsoft Office XP or 2003 Student Workbook TECHNOeBooks Project-based Computer Curriculum ebooks www.bepublishing.com Copyright 1993 2010. TechnoKids Inc. in partnership with B.E.
Elixir Ad-hoc Report. Release Elixir Technology Pte Ltd
 Elixir Ad-hoc Report Release 3.5.0 Elixir Technology Pte Ltd Elixir Ad-hoc Report: Release 3.5.0 Elixir Technology Pte Ltd Published 2014 Copyright 2014 Elixir Technology Pte Ltd All rights reserved. Java
PEERNET File Conversion Center 6.0
 Thank you for choosing PEERNET File Conversion Center. The PEERNET File Conversion Center integrates seamlessly with your desktop and Windows Explorer to allow you to quickly and easily convert office
WORD Creating Objects: Tables, Charts and More
 WORD 2007 Creating Objects: Tables, Charts and More Microsoft Office 2007 TABLE OF CONTENTS TABLES... 1 TABLE LAYOUT... 1 TABLE DESIGN... 2 CHARTS... 4 PICTURES AND DRAWINGS... 8 USING DRAWINGS... 8 Drawing
Excel Manual X Axis Labels Below Chart 2010 Scatter
 Excel Manual X Axis Labels Below Chart 2010 Scatter Of course, I want the chart itself to remain the same, so, the x values of dots are in row "b(o/c)", their y values are in "a(h/c)" row, and their respective
SAS Visual Analytics 8.2: Working with Report Content
 SAS Visual Analytics 8.2: Working with Report Content About Objects After selecting your data source and data items, add one or more objects to display the results. SAS Visual Analytics provides objects
Version 7. Origin Help. OriginLab Corporation
 Version 7 Origin Help OriginLab Corporation Copyright OriginLab, Origin, and LabTalk are either registered trademarks or trademarks of OriginLab Corporation. Microsoft, Windows, and Windows NT are registered
Creating a Spreadsheet by Using Excel
 The Excel window...40 Viewing worksheets...41 Entering data...41 Change the cell data format...42 Select cells...42 Move or copy cells...43 Delete or clear cells...43 Enter a series...44 Find or replace
Evaluation of Graphics Packages for PCs
 Evaluation of Graphics Packages for PCs AGOCG Report by Mary Thorp and Steve Morgan Computing Services, University of Liverpool March 1998 Abstract This report is a modification of an internal report produced
Recreating Hand Drawn Contour Maps using Didger and Surfer
 Recreating Hand Drawn Contour Maps using Didger and Surfer Have you ever had a scanned contour map that you wanted to convert into a digital version? You might want to do this to easily change contour
Open. Select the database and click. Print. Set printing options using the dropdown menus, then click the
 The Original Quick Reference Guides Microsoft Access 2010 Access is a tool for creating and managing databases collections of related records structured in an easily accessible format such as a table,
Project Guide - Time location with PLANER ET PROFESSIONAL 2011
 Project Guide - Time location with PLANER ET PROFESSIONAL 2011 Description This Guide summarizes operational way, the steps and most important functions to carry out a complete cycle of management of programming
Tricking it Out: Tricks to personalize and customize your graphs.
 Tricking it Out: Tricks to personalize and customize your graphs. Graphing templates may be used online without downloading them onto your own computer. However, if you would like to use the templates
Book 5. Chapter 1: Slides with SmartArt & Pictures... 1 Working with SmartArt Formatting Pictures Adjust Group Buttons Picture Styles Group Buttons
 Chapter 1: Slides with SmartArt & Pictures... 1 Working with SmartArt Formatting Pictures Adjust Group Buttons Picture Styles Group Buttons Chapter 2: Slides with Charts & Shapes... 12 Working with Charts
CPM-200 User Guide For Lighthouse for MAX
 CPM-200 User Guide For Lighthouse for MAX Contents Page Number Opening the software 2 Altering the page size & Orientation 3-4 Inserting Text 5 Editing Text 6 Inserting Graphics 7-8 Changing the Colour
Excel 2013 Intermediate
 Instructor s Excel 2013 Tutorial 2 - Charts Excel 2013 Intermediate 103-124 Unit 2 - Charts Quick Links Chart Concepts Page EX197 EX199 EX200 Selecting Source Data Pages EX198 EX234 EX237 Creating a Chart
CSSCR Excel Intermediate 4/13/06 GH Page 1 of 23 INTERMEDIATE EXCEL
 CSSCR Excel Intermediate 4/13/06 GH Page 1 of 23 INTERMEDIATE EXCEL This document is for those who already know the basics of spreadsheets and have worked with either Excel for Windows or Excel for Macintosh.
QDA Miner. Addendum v2.0
 QDA Miner Addendum v2.0 QDA Miner is an easy-to-use qualitative analysis software for coding, annotating, retrieving and reviewing coded data and documents such as open-ended responses, customer comments,
Microsoft Word
 OBJECTS: Shapes (part 1) Shapes and the Drawing Tools Basic shapes can be used to graphically represent information or categories. The NOTE: Please read the Objects (add-on) document before continuing.
Illustrator Charts. Advanced options
 Illustrator Charts Advanced options Setting up labels Labels are words or numbers that describe two things: the sets of data you want to compare, and the categories across which you want to compare them.
Microsoft Excel 2002 M O D U L E 2
 THE COMPLETE Excel 2002 M O D U L E 2 CompleteVISUAL TM Step-by-step Series Computer Training Manual www.computertrainingmanual.com Copyright Notice Copyright 2002 EBook Publishing. All rights reserved.
Section 33: Advanced Charts
 Section 33 Advanced Charts By the end of this Section you should be able to: Use Chart Options Add Moving Averages to Charts Change a 3D Chart View Use Data Labels and Markers Create Stacked Bar Charts
Rich Text Editor Quick Reference
 Rich Text Editor Quick Reference Introduction Using the rich text editor is similar to using a word processing application such as Microsoft Word. After data is typed into the editing area it can be formatted
SyncFirst Standard. Quick Start Guide User Guide Step-By-Step Guide
 SyncFirst Standard Quick Start Guide Step-By-Step Guide How to Use This Manual This manual contains the complete documentation set for the SyncFirst system. The SyncFirst documentation set consists of
Open and arrange windows This section covers items like: Opening another window on to a workbook Arranging workbook windows Hiding and show windows
 Level 2 Excel Viewing workbooks Open and arrange windows Opening another window on to a workbook Arranging workbook windows Hiding and show windows Split panes Split panes Freeze panes Freeze panes Change
Creating Charts in Office 2007 Table of Contents
 Table of Contents Microsoft Charts... 1 Inserting a Chart in Excel... 1 Tip Shortcut Key to Create a Default Chart in Excel... 2 Activating Your Chart... 2 Resizing an Embedded Chart... 2 Moving a Chart...
Numbers Basics Website:
 Website: http://etc.usf.edu/te/ Numbers is Apple's new spreadsheet application. It is installed as part of the iwork suite, which also includes the word processing program Pages and the presentation program
COMPUTER TECHNOLOGY SPREADSHEETS BASIC TERMINOLOGY. A workbook is the file Excel creates to store your data.
 SPREADSHEETS BASIC TERMINOLOGY A Spreadsheet is a grid of rows and columns containing numbers, text, and formulas. A workbook is the file Excel creates to store your data. A worksheet is an individual
Multi-sheet Workbooks for Scientists and Engineers
 Origin 8 includes a suite of features that cater to the needs of scientists and engineers alike. Multi-sheet workbooks, publication-quality graphics, and standardized analysis tools provide a tightly integrated
Microsoft Excel 2000 Charts
 You see graphs everywhere, in textbooks, in newspapers, magazines, and on television. The ability to create, read, and analyze graphs are essential parts of a student s education. Creating graphs by hand
Lesson 19 Organizing and Enhancing Worksheets
 Organizing and Enhancing Worksheets Computer Literacy BASICS: A Comprehensive Guide to IC 3, 5 th Edition 1 Objectives Hide, show, and freeze columns and rows. Create, rename, and delete worksheets. Change
Copyright combit GmbH ; Rev All rights reserved.
 No responsibility is taken for the correctness of the information contained in this manual. The information is subject to alteration without previous notice. combit GmbH accepts no liabilities in connection
Transient Stability Analysis with PowerWorld Simulator
 Transient Stability Analysis with PowerWorld Simulator T8: Viewing Transient Stability Results 2001 South First Street Champaign, Illinois 61820 +1 (217) 384.6330 support@powerworld.com http://www.powerworld.com
Intellicus Enterprise Reporting and BI Platform
 Designing Adhoc Reports Intellicus Enterprise Reporting and BI Platform Intellicus Technologies info@intellicus.com www.intellicus.com Designing Adhoc Reports i Copyright 2012 Intellicus Technologies This
Microsoft Excel. Charts
 Microsoft Excel Charts Chart Wizard To create a chart in Microsoft Excel, select the data you wish to graph or place yourself with in the conjoining data set and choose Chart from the Insert menu, or click
Gloucester County Library System. Excel 2010
 Gloucester County Library System Excel 2010 Introduction What is Excel? Microsoft Excel is an electronic spreadsheet program. It is capable of performing many different types of calculations and can organize
KODAK Software User s Guide
 KODAK Create@Home Software User s Guide Table of Contents 1 Welcome to KODAK Create@Home Software Features... 1-1 Supported File Formats... 1-1 System Requirements... 1-1 Software Updates...1-2 Automatic
Spreadsheets Microsoft Office Button Ribbon
 Getting started with Excel 2007 you will notice that there are many similar features to previous versions. You will also notice that there are many new features that you ll be able to utilize. There are
Introduction to CS graphs and plots in Excel Jacek Wiślicki, Laurent Babout,
 MS Excel 2010 offers a large set of graphs and plots for data visualization. For those who are familiar with older version of Excel, the layout is completely different. The following exercises demonstrate
Activant Solutions Inc. MORE Microsoft Excel Tips and Tricks
 Activant Solutions Inc. MORE Microsoft Excel Tips and Tricks Objectives Work more efficiently with Excel worksheets Utilize formatting and charts to get your message across effectively Use Conditional
A Step-by-step guide to creating a Professional PowerPoint Presentation
 Quick introduction to Microsoft PowerPoint A Step-by-step guide to creating a Professional PowerPoint Presentation Created by Cruse Control creative services Tel +44 (0) 1923 842 295 training@crusecontrol.com
OX Documents Release v Feature Overview
 OX Documents Release v7.8.4 Feature Overview 1 Objective of this Document... 3 1.1 The Purpose of this Document... 3 2 General Improvements... 4 2.1 Security First: Working with Encrypted Files (OX Guard)...
TABLE OF CONTENTS. i Excel 2016 Basic
 i TABLE OF CONTENTS TABLE OF CONTENTS I PREFACE VII 1 INTRODUCING EXCEL 1 1.1 Starting Excel 1 Starting Excel using the Start button in Windows 1 1.2 Screen components 2 Tooltips 3 Title bar 4 Window buttons
Spreadsheet definition: Starting a New Excel Worksheet: Navigating Through an Excel Worksheet
 Copyright 1 99 Spreadsheet definition: A spreadsheet stores and manipulates data that lends itself to being stored in a table type format (e.g. Accounts, Science Experiments, Mathematical Trends, Statistics,
MICROSOFT EXCEL Working with Charts
 MICROSOFT EXCEL 2010 Working with Charts Introduction to charts WORKING WITH CHARTS Charts basically represent your data graphically. The data here refers to numbers. In Excel, you have various types of
Display Layers in Geosoft 3D View
 Use the New 2D/3D Workflow features in Target for ArcGIS In Target for ArcGIS version 3.5, there are three new interconnected features that make integrating 2D and 3D data in plan and section maps easier.
IGCSE ICT Section 16 Presentation Authoring
 IGCSE ICT Section 16 Presentation Authoring Mr Nicholls Cairo English School P a g e 1 Contents Importing text to create slides Page 4 Manually creating slides.. Page 5 Removing blank slides. Page 5 Changing
Years after US Student to Teacher Ratio
 The goal of this assignment is to create a scatter plot of a set of data. You could do this with any two columns of data, but for demonstration purposes we ll work with the data in the table below. The
Microsoft Office Excel
 Microsoft Office 2007 - Excel Help Click on the Microsoft Office Excel Help button in the top right corner. Type the desired word in the search box and then press the Enter key. Choose the desired topic
PASS Sample Size Software
 Chapter 941 Introduction In PASS, it is easy to study power and sample size calculations for a range of possible parameter values. When at least 2 input parameters vary, you can create stunning 3D power