intouch Historical Reports Reference Manual
|
|
|
- Jack Booker
- 6 years ago
- Views:
Transcription

1 intouch Historical Reports Reference Manual
2 intouch Historical Reports Reference Manual Title intouch Historical Reports Reference Manual Revision Copyright 2009 incontact, Inc. Product Code 3683 About incontact incontact, Inc. provides the market leading on-demand contact center platform, incontact, to over 500 contact centers across the globe. With its roots in telecommunications and network infrastructure, incontact is unique in its offering because it combines a powerful connectivity backbone with a world-class software platform. The incontact platform has grown from a powerful ACD with skills-based routing, CTI, and IVR with speech recognition, to include an innovative online hiring solution, an elearning and communications application, workforce management functionality, and a customer feedback and survey solution. Because the incontact platform is delivered through a Software-as-a-Service (SaaS) model, incontact customers can realize significant cost savings and flexibility compared to premises-based alternatives. To learn more about incontact, visit Contributors incontact would like to acknowledge the many individuals who helped complete this intouch Historical Reports Reference Manual. We would also like to thank our customers who inspire our commitment to extreme customer satisfaction. 2
3 Table of Contents Using intouch Historical Reports Agent Performance Agent Performance: Report Menu Agent Performance: Report Properties Agent Performance: Show Graph Agent Performance: Show Report Data Agent Performance by Hour Agent Performance by Hour: Report Menu Agent Performance by Hour: Report Properties Agent Performance by Hour: Show Graph Agent Performance by Hour: Show Report Data Agent Summary by Day Agent Summary by Day: Report Menu Agent Summary by Day: Report Properties Agent Summary by Day: Show Graph Agent Summary by Day: Show Report Data Agent Summary by Day: Left & Right Arrows Contacts Durations (min) Total Time vs. % Total Ave Durations (sec) Refused/Held Abandon Contacts and Durations Campaign/Skill Summary Campaign/Skill Summary: Report Properties Contact Statistics Contact Statistics: Report Menu Contact Statistics: Report Properties Contact Statistics: Show Graph Contact Statistics: Show Report Data Media Comparison Media Comparison: Report Menu
4 Media Comparison: Report Properties Media Comparison: Show Graph Media Comparison: View Data Other State Statistics Other State Statistics: Report Menu Other State Statistics: Report Properties Other State Statistics: Show Graph Other State Statistics: View Data Skill Dispositions Chart Skill Dispositions Chart: Report Menu Skill Dispositions Chart: Report Properties Skill Dispositions Pie Skill Dispositions Pie: Report Menu Skill Dispositions Pie: Report Properties Skill Disposition Pie: Show Graph Skill Disposition Pie: Show Report Data Unavailable Stats Unavailable Stats: Report Menu Unavailable Stats: Report Properties Unavailable Statistics: Show Graph Unavailable Statistics: Show Report Data Chart Properties
. 2. Click Software Update. 3. The Software Update page opens: 4. From the list of available files, click InTouch.exe and save the file to your PC.")

5 Using intouch intouch is downloaded from the Software Update page in webmanager. It can be installed on any PC connected to the Internet. To Download intouch: 1. Log in to webmanager ( 2. Click Software Update. 3. The Software Update page opens: 4. From the list of available files, click InTouch.exe and save the file to your PC. It s easier to access when there is a shortcut on your desktop. Note! When there is an update to intouch, the intouch program will either prompt you to update your current intouch software, or the intouch software will be updated automatically. To Login and Run intouch: 1. Double-click the intouch icon ( ) on your desktop. 2. The Please Login screen opens: 3. Enter your LOGIN ID and PASSWORD. 4. Click Login. 5
6 Upon successful login, the intouch icon ( ) appears in the systems tray. Note! While intouch is connecting to the Internet, there will be a red X over the icon. The following menus are available from the intouch icon in the systems tray: The table below describes the options in the right-click menu: Option Description This icon opens the Real-Time reports. This icon opens the Historical reports. This icon opens the Custom reports. This option is only available for Real-Time reports. This option refreshes the data so that you do not have to log out and then log back in. Click this icon when you are ready to log out. 6
 for hour, day, week, and month.")

7 Historical Reports Historical reports display data about agents, campaigns, skills, and unavailable states in your contact center. Data can be generated for any date range or duration of time (in minutes or seconds) for hour, day, week, and month. Using the buttons in the lower left corner of each report, you can view historical reports as either a graph or a grid of data. Historical reports do not refresh automatically; however, for the current day, you can refresh them at any time by clicking the Report Menu > Refresh Static Data. After a refresh, the information in an historical report is no older than 120 seconds. To Access intouch Historical Reports: 1. Right-click on the intouch icon in the systems tray and click Historical Reports. 2. The list of Historical reports opens: 3. Select the report you want to generate. The descriptions for each of these reports are in this manual. 7
8 Agent Performance The Agent Performance report generates historical data to show the durations of time organized by the percentage of total time agents have been in a specific state (i.e., Available, Unavailable ). To Generate the Agent Performance Report: 1. Right-click the icon in the systems tray. 2. Click Historical Reports > Agent Performance 3. The Agent Performance report opens for the current day: Note! The colors can represent different information each time the report is opened. Using the three buttons in the lower left corner, different views of the Agent Performance report can be generated according to your business needs: Report Menu Show Graph Show Report Data 8

9 Agent Performance: Report Menu When you right-click on the report or click in the lower left corner, the report menu opens: The Report Menu includes the following options: 9

10 Agent Performance: Report Properties The report properties are used to select filters for specific data to be generated. Note! Agents cannot be selected when generating a report for teams. Teams cannot be selected when generating a report for agents. To Access Report Properties: 1. Click Report Properties. 2. The Date Range screen opens: 3. Select the Start date. 4. Select the End date. 5. Click Next. 6. The Teams tab opens: 10

11 7. Click to move the selected team(s) from the Available teams box to the Teams in this report box. Click to move all teams. Note! Click to move the selected teams from the Teams in this report box to the Available teams box. Click to move all teams. 8. Click Next. 9. The Agents tab opens: 10. Click to move the selected agent(s) from the Available agents box to the Agents in this report box. Click to move all agents. Note! Click to move the selected agents from the Agents in this report box to the Available agents box. Click to move all agents. 11. Click the Hide Inactive Agents check box to display the names of active agents only. 12. Click Finish. 13. The data for the report is displayed: 11
12 Agent Performance: Show Graph This graph shows the available/unavailable time for agents. When agents are logged in to myagent, they can select their time as Available, Unavailable, ACD (Inbound), Outbound, or Other (Other represents the Unavailable Codes that can be created in webmanager). Note! The colors will not always represent the same information in each report. To View the Agent Performance Report: 1 Click 2 The Agent Performance report opens: The Agent Performance report has the following data: Name Available% Unavailable% Other% Refused ACD Outbound Description The percentage of total time the agents/teams were available to receive contacts while logged in to myagent. The percentage of total time the agents/teams were in an unavailable state and could not receive contacts while logged in to myagent. The percentage of total time the agents/teams were in an Other state. Other represents the unavailable codes that can be created in webmanager. The unavailable codes will be displayed with the name that was used to create them in webmanager. The percentage of contacts that the agents/teams refused to answer/handle. The percentage of time the agents/teams were in an ACD (inbound) state (i.e., handling inbound contacts). The percentage of time the agents/teams were in an Outbound state. Note! If the pie chart does not meet your business needs, go to the Report Menu > Chart Properties to select a graph that better meets your needs (for a session). For more information on changing the chart type, see page
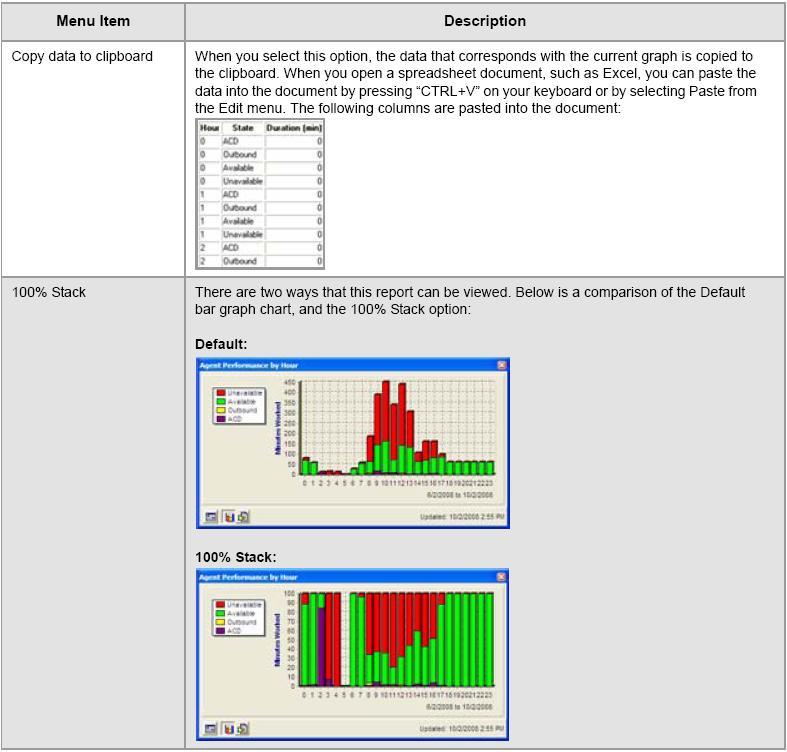
13 Agent Performance: Show Report Data When you click Show Report Data, the Agent Performance data is displayed in a chart. To View Show Report Data: 1. Click 2. The Agent Performance (chart) opens: The Agent Performance report (chart) has the following columns of data: Column Agent State Duration (min) Count Average Totals Description The state (for this example, Available, Unavailable, or Other) the agent was in. Other represents the unavailable codes that are created in webmanager. The names of the Unavailable codes will be displayed in the Agent State. The duration of time (in minutes) the agent was in the Agent State. The number of times the agent went to the agent state. The average duration of time an agent was in the agent state. The totals for each column. Note! When you select Copy data to clipboard from the Report Menu, this data will be copied to the clipboard. You can then open a spreadsheet program such as Excel and press CTRL + V to paste the data in to the file, or select Paste from the Edit menu. 13

14 Agent Performance by Hour The Agent Performance by Hour report generates data to show the number of state changes per hour for each agent. You can view the number of times an agent was Available, Unavailable, etc. For example, you could view what happens from 10:00 A.M. - 1:00 P.M. every day. You could also view whether or not the contact volume increases or decreases and then make an informed decision for scheduling agents based on the patterns you see in this report. Note! Agents cannot be selected when generating a report for teams. Teams cannot be selected when generating a report for agents. To Generate the Agent Performance by Hour Report: 1. Right-click the icon in the systems tray. 2. Click Historical Reports > Agent Performance by Hour 3. The Agent Performance by Hour report opens: Each hour of the day is represented at the bottom of the report (0 represents midnight). The number of minutes worked is displayed on the left. This example shows the agents who logged in between 7:00 A.M. and 12:30 P.M., the states they were in during that time, and the number of minutes they were in the different agent states. Using the three buttons in the lower left corner, different views of the Agent Performance by Hour report can be generated according to your business needs: Report Menu Show Chart Show Report Data 14


15 Agent Performance by Hour: Report Menu To View the Agent Performance by Hour Report Menu: 1. Click 2. The Report Menu opens: The Report Menu has the following options: 15
16 16

17 Agent Performance by Hour: Report Properties The report properties are used to select filters for specific data to be generated. To Access Report Properties: 1. Click Report Properties. 2. The Date Range screen opens: 3. Select the Start date. 4. Select the End date. 5. Click Next. 6. The View Data tab opens: 7. Click the specific data you want generated for the report, or if you want to view all data, click the View all data check box. 17
18 8. Click Next. 9. The Teams tab opens: 10. Click to move the selected team(s) from the Available teams box to the Teams in this report box. Click to move all teams. Note! Click to move the selected team(s) from the Teams in this report box to the Available teams box. Click to move all teams. 11. Click Next. 12. The Agents tab opens: 13. Click to move the selected agent(s) from the Available agents box to the Agents in this report box. Click to move all agents. Note! Click to move the selected agent(s) from the Agents in this report box to the Available agents box. Click to move all agents. 18

19 14. Click the Hide Inactive Agents check box to display the names of active agents only. 15. Click Next. 16. The Other tab opens: 17. Select one of three options for the report: Duration Instances of the state Average time per instance Duration When you select Duration, the following report opens: This report shows the number of minutes that agents worked (shown on the left side of the report) while in different agent states between the hours (shown on the bottom of the report) of 12:00 A.M. and 11:00 P.M. for the selected date range. 19

20 This report shows the count of occurrences i.e., the number of times (shown on the left side of the report) that agents were in an agent state between the hours (shown on the bottom of the report) of 12:00 A.M. and 11:00 P.M. for the selected date range. Average time per instance When you select Average time per instance, the following report opens: This report shows the average duration of time in seconds (shown on the left side of the report) that agents were in specific states between the hours (shown on the bottom of the report) of 12:00 A.M. and 11:00 P.M. for the selected date range. Agent Performance by Hour: Show Graph To View the Report Graph: 1. Click 2. The graph is displayed. Note! The graph data is generated according to the options selected in the Report Properties > Other tab. 20

21 Agent Performance by Hour: Show Report Data To View the Report Data: 1. Click 2. The report data chart is displayed: Note! The data for this report is generated according to what you select in the Report Properties > Other tab. When you select Copy data to clipboard, from the Report Menu, this data will be copied to the clipboard. You can then open a spreadsheet program, such as Excel, and from your keyboard, press CTRL+V to paste the data to the file, or from the Edit menu, click Paste. The Report Data has the following columns of data: Column Hour State Duration (min) Description This column shows the hours in a day (0-23). Note! Zero (0) symbolizes midnight or 12:00 A.M. This column displays the agent state(s) i.e., Unavailable, Available, Outbound, or ACD (Inbound), that agents were in during a specified hour. This column displays the duration of time (in minutes) the agent was in the specified state. The first two columns, Hour and State will always be the same, but the last column will be 1) Duration, 2) Instances of the state, or 3) Average time per instance (seconds) according to what you select in the Report Properties > Other tab. 21
22 Agent Summary by Day The Agent Summary by Day report summarizes agent activity by day. Note! There are several variations available for these reports that are summarized in this section. To Generate the Agent Summary by Day Report: 1. Right-click the icon in the systems tray. 2. Click Historical Reports > Agent Summary by Day 3. The Agent Summary by Day report opens with data for the current day and for 7-14 days prior: There are several variations of this report that intouch can generate. Using the buttons in the lower left corner, these reports can be generated according to your business needs: Report Menu Show Graph Show Report Data Left and Right Arrows 22


23 Agent Summary by Day: Report Menu To View the Report Menu: 1. Click. 2. The Report Menu opens: This report menu includes the following options: 23
24 24

25 Agent Summary by Day: Report Properties The report properties are used to select filters for specific data to be generated. Note! Agents cannot be selected when generating a report for teams. Teams cannot be selected when generating a report for agents. To Access Report Properties: 1. Click Report Properties. 2. The Date Range screen opens: 3. Select the Start date. 4. Select the End date. 5. Click Next. 6. The View Data tab opens: 25
26 7. Click the specific data you want generated for the report, or if you want to view all data, click the View all data check box. The View Data tab has the following options: Option Date Inbnd ACD time (minutes) Ave ACD (seconds) Outbnd Outbnd time (minutes) Ave Outbnd (seconds) Unavail (minutes) Avail (minutes) Total time (minutes) Refused Held Abandon InContact% ACD Outbnd Avail % Description The time for which the data is being reported. This column can be the Day, Week, Month, or Weekday, according to what is selected in the Report Properties > Other tab. The number of inbound calls that agents handled. The total duration of time (in minutes) for ACD (inbound) contacts. The average duration of time (in seconds) that the ACD (inbound) contact was connected. The number of outbound contacts each agent handled for the selected date range. The total duration of time (in minutes) of outbound contacts. The average duration of time (in seconds) for outbound contacts. The total duration of time (in minutes) the agent was in an unavailable state. The total duration of time (in minutes) an agent was available to accept contacts. The total duration of time (in minutes) the agent was logged in to myagent. The number of contacts the agent refused to handle (i.e., answer). To see the refusal reason, go to webmanager > Contact History report. The number of contacts that hung up when the agent had the contacts on hold. The percentage of talk time (ACD - inbound state, outbound). The percentage of talk time and available time. 8. Click Next. 9. The Teams tab opens: 10. Click to move the selected team(s) from the Available teams box to the Teams in this report box. Click to move all teams. 26
 from the Available agents box to the Agents in this report box. Click to move all agents. Note!")
27 Note! Click Click to move the selected team(s) from the Teams in this report box to the Available teams box. to move all teams. 11. Click Next. 12. The Agents tab opens: 13. Click to move the selected agent(s) from the Available agents box to the Agents in this report box. Click to move all agents. Note! Click to move the selected agents from the Agents in this report box to the Available agents box. Click to move all agents. 14. Click the Hide Inactive Agents check box to display the names of active agents only. 15. Click Next. 16. The Other tab opens: 17. Select the data you want to view. 27

28 18. Click Finish. 19. The Agent Summary by Day report is generated. Agent Summary by Day: Show Graph The Agent Summary by Day report is a visual representation of contacts. The legend shows what the different lines in the chart represent. By default, this report will be generated in a line plotter chart. However, this report can be changed to another chart type for a session. See page 55 for more information. To View the Report Graph: 1. Click. 2. The chart for this report is displayed: 28

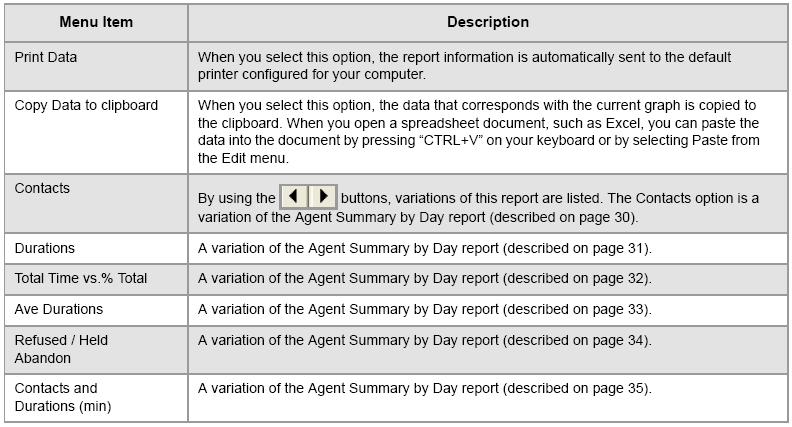
29 Agent Summary by Day: Show Graph To View Report Data: 1. Click. 2. The data for this report is displayed: Note! When you select Copy data to clipboard, from the Report Menu, this data will be copied to the clipboard. You can then open a spreadsheet program, such as Excel, and press CTRL+V on your keyboard to paste the data into a file, or select Paste from the Edit menu. The columns that are displayed depend on the selections in the View Data tab. Agent Summary by Day: Left & Right Arrows There are six variations of the Agent Summary by Day report that are generated by clicking the left and right arrows at the bottom of the screen described on the following pages: Contacts Durations Total Time vs. % Total Ave Durations Refused/Held Abandoned Contacts and Durations 29

30 Contacts This report shows the duration of the contacts that are in incontact. The number of contacts is on the left, and the percentage is on the right: The following data correspond with the legend: Legend ACD Outbound Avail percent ACD Outbound percent Outbound Contacts Initiated ACD Contacts Handled Description The percentage of agents who were in an available state. The percentage of outbound contacts that were initiated by the agents for a specified day. The number of outbound contacts that agents initiated on the specified day. The number of ACD (Inbound) contacts that were handled by agents. 30

31 Durations (min) This report shows the duration of time (in minutes) that agents were in Available, Unavailable, Outbound, or ACD states. The minutes are shown on the left side of the report and the days are shown at the bottom of the report. The following data correspond with the legend: Legend Available Duration Unavailable Duration Outbound duration ACD duration Description The total duration of time (in minutes) that agents were in an Available state. The total duration of time (in minutes) that agents were in an Unavailable state. The total duration of time (in minutes) that agents were handling outbound contacts. The total duration of time (in minutes) that agents were handling inbound contacts. Note! The report format can be changed by selecting the Chart Properties option in the Report Menu, and then selecting the chart type you want applied for a session. 31

32 Total Time vs. % Total This report is a comparison of the total time an agent has been logged into myagent, and the Total % of time they were in an Available state and handling contacts: The following data correspond with the legend: Legend ACD Outbound Avail Percent ACD Outbound Percent Total duration (minutes) Description This is the percentage of time that agents were handling ACD (inbound)/outbound contacts or the agents that were in an available state to handle contacts. The percentage of time the agents were handling ACD (inbound)/outbound contacts. The total duration of time (in minutes) the agents were logged in to myagent. Note! The report format can be changed by selecting the Chart Properties option from the Report Menu, and then selecting the chart type you want applied for a session. 32

33 Ave Durations (sec) This report shows the average durations of time (in seconds) of contacts for a specific day. The number of seconds are shown on the left side of the report, and the days are shown at the bottom of the report: The following data correspond with the legend: Legend Ave Outbound Duration (seconds) Description The average duration of time (in seconds) that agents were handling outbound contacts. Ave ACD duration (seconds) The average duration of time (in seconds) that agents were handling ACD (inbound) contacts. Note! The report format of a plotter chart can be changed by selecting the Chart Properties option from the Report Menu, and then selecting the chart type you want applied for this report for a session. 33


34 Refused / Held Abandon This report shows the contacts that were abandoned and/or refused while an agent had them on hold. The number of instances a contact was abandoned/refused is shown on the left side of the report. The days are shown at the bottom of the report: The following data correspond with the legend: Note! The default report is in a plotter chart. If you would like to change the default report chart type for a session, click the Chart Properties option in the Report Menu. 34
 are shown on the right side of the report, and the days are shown at the bottom of the report.")
35 Contacts and Durations This report shows the number of contacts handled by agents and the total duration of time (in minutes) for the contacts. The number of contacts are shown on the left side of the report, the duration of time (in minutes) are shown on the right side of the report, and the days are shown at the bottom of the report. The following data correspond with the legend: Legend Outbound duration (minutes) Outbound Contacts Initiated ACD duration (minutes) ACD Contacts Handled Description The total duration of time (in minutes) for outbound contacts. The number of outbound contacts that were initiated by the agents. The total duration of time (in minutes) for ACD (inbound) contacts. The number of ACD (inbound) contacts that agents handled. Note! The default report is in a plotter chart. If you would like to change the Chart Type for a session, click the Chart Properties option in the Report Menu. 35
36 Campaign / Skill Summary The Campaign/Summary report is generated for Campaigns or Skills. Any time an inbound or outbound communication channel is opened from any source -either by a customer or an agent, that event is considered a contact. In order to handle a contact, an agent must be assigned a skill. Skills are grouped under a Campaign and are assigned to agents who use the myagent interface. There is no limit to the number of skills that can be assigned to an agent. Skill incontact is a skills-based routing system. The skill of a contact can change based on the type of contact it is. The contact will be delivered to an agent who has the same skill set, i.e., phone call, , chat, or fax. Each skill that is created must be assigned one of four media types: Phone Call skill - to handle phone call contacts skill - to handle contacts Chat skill - to handle chat contacts Fax skill - to handle fax contacts Each skill must also be assigned either an inbound or outbound state (phone call and skills are the skills that can be outbound). Possible skills that can be created are: Inbound Phone Call skill - to handle incoming phone call contacts Outbound Phone Call skill - to make outbound phone call contacts Inbound skill - to handle incoming contacts Outbound skill - to send outbound contacts Inbound Chat skill - to handle incoming chat contacts Inbound Fax skill - to handle fax contacts Depending on the information you need, this report generates data for: Campaigns Skills Campaign A campaign is a group of skills. Each skill is organized under a campaign for reporting purposes. Skills are assigned to agents (and agents are assigned to exactly one team) in webmanager. Create as many campaigns as you need to organize skills for reporting purposes. 36

37 Campaign / Skill Summary Report The Campaign/Skill Summary Report summarizes the data for selected campaigns and skills. Note! Skills cannot be selected when you are generating a Campaign Summary report. Campaigns cannot be selected when you are generating a Skill Summary report. To Generate a Campaign/Skill Summary Report: 1. Right-click the icon in the systems tray. 2. Click Historical Reports > Campaign/Skill Summary 3. The screen (the name shows the selected skill or campaign) below opens. The Campaign/Skill Summary report has the following features: Campaign/Skill Name Data Fields Report Chart Arrows Report Menu 37

. When this report is generated for the current day, you can select this option to update the report.")
38 The Campaign/Skill Summary report has the following Data Fields: To Generate Different Views of the Campaign/Summary Report: 1. Click in the lower left corner of the report to select different data to be generated for each report. 2. The Report Menu opens: The Report Menu includes the following options: Menu Item Report Properties Update Report Chart Properties Description The selection criteria for this report is opened (described below). When this report is generated for the current day, you can select this option to update the report. When you select this option, the data in the report will be no older than 120 seconds. If the bar chart does not assist you in gathering data, you can change the chart type for a session. For more information, see page
39 39

 from the Available campaigns box to the Campaigns in this report box.")
40 Campaign / Skill Summary: Reports Properties The report properties are used to select filters for specific data to be generated. To Access Report Properties: 1. Click Report Properties. 2. The Date Range screen opens: 3. Select the Start date. 4. Select the End date. 5. Click Next. 6. The Campaign tab opens: 7. Click to move the selected campaign(s) from the Available campaigns box to the Campaigns in this report box. Click to move all campaigns. 40
 from the Available skills box to the Skills in this report box. Click to move all skills. Note!")
41 Note! Click to move the selected campaign(s) from the Campaigns in this report box to the Available campaigns box. Click to move all campaigns. 8. Click Next. 9. The Skills tab opens: 10. Click to move the selected skill(s) from the Available skills box to the Skills in this report box. Click to move all skills. Note! Click to move the selected skill(s) from the Skills in this report box to the Available skills box. Click to move all skills. 11. Click Next. 12. The Media tab opens: 13. Click to move the selected media from the Available media box to the Media in this report box. Click to move all media. 41

42 Note! Click to move the selected media from the Skills in this report box to the Available skills box. Click to move all skills. 14. Click Next. 15. The Inbound/Outbound tab opens: 16. Select Inbound, Outbound, or Inbound & Outbound. 17. Click Finish. 18. The Campaign/Skill Summary Report data is displayed. 42

43 Contact Statistics Contacts enter incontact and are handled by agents or scripts. A contact can be a phone call, an , a chat, or a FAX. This report generates the statistics of what happened with the contacts during a specified time period; e.g., Day, Week, Month, Hour, and Half Hour. To Generate the Contact Statistics Report: 1. Right-click the icon in the systems tray. 2. Click Historical Reports > Contact Statistics 3. The Contact Statistics report opens: 4. There are different views of this report that intouch can generate. Using the three buttons in the lower left corner, different reports can be generated according to your business needs: Report Menu Show Graph Show Report Data 43

44 Contact Statistics: Report Menu To Open the Report Menu: 1. Click. 2. The Report Menu opens: This report menu includes the following options: 44

45 Contact Statistics: Report Properties The report properties are used to select filters for specific data to be generated. To Access Report Properties: 1. Click Report Properties. 2. The Date Range screen opens: 3. Select the Start date. 4. Select the End date. 5. Click Next. 45

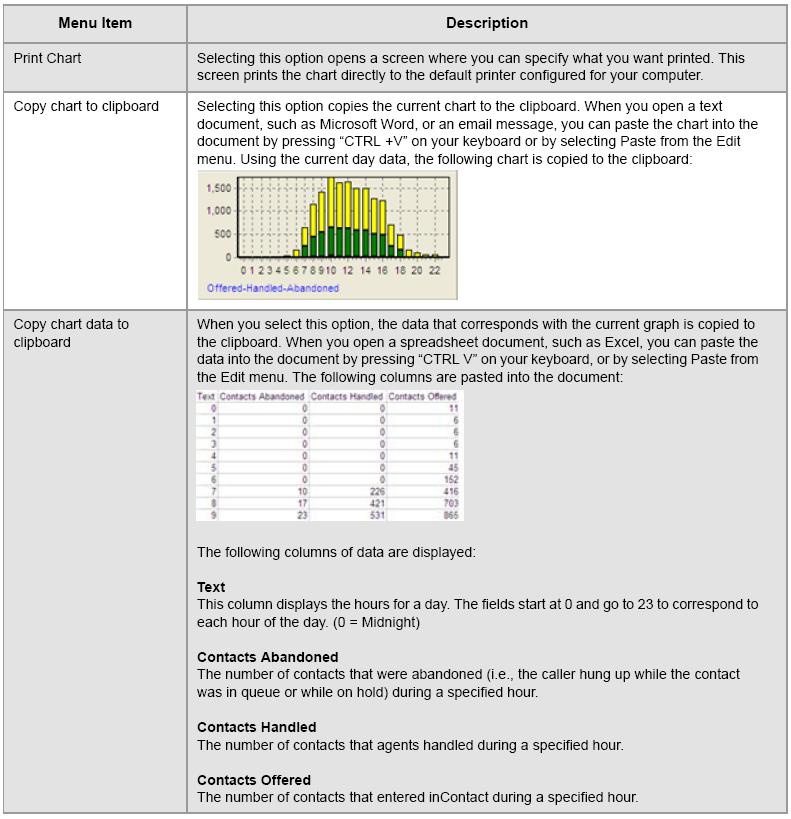
46 6. The View Data tab opens: 7. Click the specific data you want generated for the report, or if you want to view all data, click the View all data check box. The following table lists all the available data fields in the View Data tab: Field Total Contacts Offered Total Time Average total contact time Contacts delivered to Agents Contact with agent time Average time with agent Abandoned contacts Abandon time Average abandon time Contacts that entered the queue Queue Time Average Queue Time Post-agent (transferred) contact Post-agent time Average post-agent time Total time in IVR (PreQueue) Description The total number of contacts that entered the incontact network. The total time of all contacts. The average total time per contact. The number of contacts that were delivered to agents. The total duration of time (in seconds) the agent handled the contact. The average duration of time (in seconds) the agent handled the contact. The number of contacts that hung up while they were in queue or on hold. The total duration of time (in seconds) that calls were in queue before they were abandoned. The average duration of time for each abandoned contact. The number of contacts that entered the queue. The total duration of time (in seconds) that contacts were in queue. The average duration of time (in seconds) that each contact was in queue. The number of contacts that were transferred to an outside number. The total duration of time (in seconds) that contacts were active in a post-agent state. The average duration of time (in seconds) that an agent was handling a contact. The total duration of time (in seconds) that the contacts were in an IVR before going to queue. 46

 from the Campaigns in this report box to the Available campaigns box.")
47 Field Average IVR time Service Level Description The average duration of time (in seconds) that a contact was using the IVR. The Service Level percentage based on the service level threshold configured in web-manager. 8. After you have made selections, click Next. 9. The Campaign tab opens: 10. Click to move the selected campaign(s) from the Available campaigns box to the Campaigns in this report box. Click to move all campaigns. Note! Click to move the selected campaign(s) from the Campaigns in this report box to the Available campaigns box. Click to move all campaigns. 11. Click Next. 12. The Skills tab opens: 47
 from the Skills in this report box to the Available skills box. Click to move all skills. 14. Click Next. 15.")

48 13. Click to move the selected skill(s) from the Available skills box to the Skills in this report box. Click to move all campaigns. Note! Click to move the selected skill(s) from the Skills in this report box to the Available skills box. Click to move all skills. 14. Click Next. 15. The Media tab opens: 16. Click to move selected media from the Available media box to the Media in this report box. Click to move all media. Note! Click to move the selected media from the Media in this report box to the Available media box. Click to move all media. 17. Click Next. 18. The Other tab opens: 19. Select the data you want to view. 48


49 20. Click Next. 21. The Inbound/Outbound tab opens: 22. Select Inbound, Outbound, or Inbound & Outbound. 23. Click Next. 24. The Point of Contact tab opens: 25. Click to move selected points of contact from the Points of contact available box to the Points of Contact in this report box. Click to move all points of contact. Note! Click to move the selected points of contact from the Points of contact in this report box to the Points of contact box. Click to move all media. 26. Click Finish. 49

 in the Report Properties > View Data tab and the Report Properties > Other tab, the report will appear differently, as shown in the comparison of the following two")
50 Contact Statistics: Show Graph The Contact Statistics report can be viewed as a graph depending on the Report Properties you select. Note! You cannot generate Campaigns, Skills, Media and Points of Contact all at the same time. They must be generated individually. To View the Contact Statistics Report as a Graph: 1. Click 2. This view displays the options selected in the Report Properties > View Data tab. Depending on the selection(s) in the Report Properties > View Data tab and the Report Properties > Other tab, the report will appear differently, as shown in the comparison of the following two graphs: If you click the View All Data checkbox in the View Data tab, the following report opens: Note! The legend is on the right side of the report and the colors correspond with the bar graph. The dates at the bottom of the report correspond with the options selected in the Report Properties > Other tab. If you select just a few items in the View Data tab, the report will be generated according to your selections: Note! The legend is on the right side of the report and the colors correspond with the bar graph. The dates at the bottom of the report correspond with the options selected in the Report Properties > Other tab. 50

51 Contact Statistics: Show Report Data The Show Report Data option displays the data generated from the selected options in the Report Properties > Other tab and View Data tab. The report data can be copied and pasted into an Excel spreadsheet. When you select Copy data to clipboard, from the Report Menu, this data will be copied to the clipboard. You can then open a spreadsheet program, such as Excel, and press CTRL+V on your keyboard or select Paste from the Edit menu to paste the data to the spreadsheet file. To View the Report Data: 1. Click 2. The report data is displayed: Report Properties > Other tab: For this example, Day was selected in the Report Properties > Other tab. The numbers for the weeks are listed in the column titled, Day. Report Properties > View Data tab: Each of the selections in the View Data tab become the column headings for this report. For this example, the following selections were made in the Report Properties > View Data tab: Total contacts offered Total time Average total contact time Contacts delivered to Agents Average time with agent Abandon time Average abandon time 51
52 Media Comparison incontact is designed to handle four different types of media for customers to contact your business: phone call, , chat, and fax. This report compares the duration of time for each media type. Note! Skills cannot be selected for this report when you want to view campaigns. Campaigns cannot be selected for this report when you want to view skills. To Generate the Media Comparison Report: 1. Right-click the icon in the systems tray. 2. Click Historical Reports > Media Comparison 3. The Media Comparison report opens: 4. There are different views available for this report. Using the three buttons in the lower left corner, different reports can be generated according to your business needs: Report Menu Show Graph Show Report Data 52

53 Media Comparison: Report Menu When you click in the lower left corner, the report menu opens: The Report Menu includes the following options: 53
54 Media Comparison: Report Properties The report properties are used to select filters for specific data to be generated. To Access Report Properties: 1. Click Report Properties. 2. The Date Range screen opens: 3. Select the Start date. 4. Select the End date. 5. Click Next. 54
 from the Campaigns in this report box to the Available campaigns box. Click to move all campaigns. 8. Click Next. 9. The Skills tab opens: 10.")
55 6. The Campaigns tab opens: 7. Click to move the selected campaign(s) from the Available campaigns box to the Campaigns in this report box. Click to move all campaigns. Note! Click to move the selected campaign(s) from the Campaigns in this report box to the Available campaigns box. Click to move all campaigns. 8. Click Next. 9. The Skills tab opens: 10. Click to move the selected skill(s) from the Available skills box to the Skills in this report box. Click to move all skills. Note! Click to move all skills. to move the selected skill(s) from the Skills in this report box to the Available skills box. Click 11. Click Next. 55


56 12. The Other tab opens: 13. The report data will correspond with the selection made in this tab. There are two options: Duration Count 14. Click Next. 15. The Inbound/Outbound tab opens: 16. Click Inbound, Outbound, or Inbound & Outbound. 17. Click Finish. 18. The Media Comparison report is generated. 56
57 Media Comparison: Show Graph To view the report as a graph, click in the lower left corner of the screen. This report shows the duration of time for each of the media types; chat, phone call, fax, and . For this example, Count was selected in the Report Properties > Other tab: Note! The pie chart is the default chart type for this report. If the pie chart does not display the data in a way that meets your business needs, go to the Chart Properties to select another chart type for a session that better meets your business needs. Media Comparison: View Data To view report data, click. The data for this report is displayed. For this example, Duration was selected in the Report Properties > Other tab: This report data displays the following: Column Description Media Duration (minutes) This column lists the media types; i.e., chat, fax, , and phone call. The total duration of time (in minutes) for each media type. 57
58 Column Count Average Description The number of contacts for each media type. The average duration of time (in minutes) for each contact for the specific media type. Note! When you select Copy data to clipboard, from the Report Menu, this data will be copied to the clipboard. You can then open a spreadsheet file, such as Excel, and press CTRL+V on your keyboard to paste the data to a spreadsheet file, or from the Edit menu, select Paste. 58

59 Other State Statistics Most of the intouch Historical reports generate data for Agents, Agent Stats, Unavailable Stats, Contact Stats, etc. The Other State Statistics report generates data for other types of information: Total Contacts Placed on Hold instances Total hold time Average Hold time Placed on Conference instances Total Conference time Average Conference time Outbound Contacts Contact Interrupted instances Outbound busy signal instances Time spent routing to an agent Callback requests Spawned contacts To Generate the Other State Statistics Report: 1. Right-click the icon in the systems tray. 2. Click Historical Reports > Other State Statistics 3. The Other State Statistics report opens: There are different views available for this report. Using the three buttons in the lower left corner, different reports can be generated according to your business needs: Report Menu Show Graph Show Report Data 59

60 Other State Statistics: Report Menu When you click in the lower left corner, the report menu opens: The Report Menu includes the following options: 60


61 Other State Statistics: Report Properties The report properties are used to select filters for specific data to be generated. To Access Report Properties: 1. Click Report Properties. 2. The Date Range screen opens: 3. Select the Start date. 4. Select the End date. 5. Click Next. 61


62 6. The View Data tab opens: 7. Select the data you want generated for this report, or click the View all data check box to generate all data for the report. The table below describes the options in the View Data tab: 8. Click Next. 62
 from the Campaigns in this report box to the Available campaigns box. Click to move all campaigns. 11. Click Next. 12. The Skills tab opens: 13.")
63 9. The Campaign tab opens: 10. Click to move the selected campaign(s) from the Available campaigns box to the Campaigns in this report box. Click to move all campaigns. Note! Click to move the selected campaign(s) from the Campaigns in this report box to the Available campaigns box. Click to move all campaigns. 11. Click Next. 12. The Skills tab opens: 13. Click to move the selected Skill(s) from the Available skills box to the Skills in this report box. Click to move all skills. Note! Click to move the selected skill(s) from the Skills in this report box to the Available skills box. Click to move all skills. 14. Click Next. 63

64 15. The Media tab opens: 16. Click to move the selected media from the Available media box to the Media in this report box. Click to move all media. Note! Click to move the selected media from the Media in this report box to the Available media box. Click to move all media. 17. Click Next. 18. The Other tab opens: 19. Select the data you want to view. Click the View Time in Minutes (instead of seconds) check box if you want to view time in seconds. 20. Click Next. 64

65 21. The Inbound/Outbound tab opens: 22. Click Inbound, Outbound, or Inbound & Outbound. 23. Click Finish. 24. The Other State Statistics report is generated. 65


66 Other State Statistics: Show Graph To view the data as a graph, click in the lower left corner of the screen. The Other State Statistics report generates data according to the options you select in the View Data tab. For this example, the View All data checkbox was selected. The legend is on the right: Note! If the bar chart type does not display the data in a way that meets your business needs, go to the Report Menu > Chart Properties to select another chart type for a session that better meets your business needs or requirements. Other State Statistics: View Data To view report data, click. The data for this report is displayed: Report Properties > Other tab: For this example, Day was selected in the Report Properties > Other tab. The dates for the selected date range are displayed in the Day column, and the Selections in the View Data tab are the column headings for the report. Each of the selections in the View Data tab become the column headings for this report. When you select Copy data to clipboard, from the Report Menu, this data will be copied to the clipboard. You can then open a spreadsheet file, such as Excel, and press CTRL+V on your keyboard to paste the data to the spreadsheet file. 66
67 Skill Disposition Chart Dispositions are descriptions of why a contact entered the network, or why a contact ends. Dispositions are created and selected in webmanager (webmanager > Dispositions). Dispositions are displayed in the myagent interface in the Dispositions screen, when a contact has completed. This report generates data according to the number of dispositions that are associated with selected skills. To Generate the Skill Dispositions Chart Report: 1. Right-click the icon in the systems tray. 2. Click Historical Reports > Other State Statistics 3. The Skill Dispositions Chart opens: Skill Dispositions Chart: Report Menu When you click in the lower left corner, the menu for this report opens: This list includes the following options: Menu Item Report Properties Update Report Print Data Description The selection criteria for this report opens (described on the following page). Selecting this option updates the report. When you select this option, the data in the report will be no older than 120 seconds. When you select this option, the report information is automatically sent to the default printer configured for your computer. 67

68 Skill Dispositions Chart: Report Properties The report properties are used to select filters for specific data to be generated. To Access Report Properties: 1. Click Report Properties. 2. The Date Range screen opens: 3. Select the Start date. 4. Select the End date. 5. Click Next. 68
 from the Skills in this report box to the Available skills box. Click to move all skills. 8. Click Next. 9. Click Finish. 10.")
69 6. The Skills tab opens: 7. Click to move the selected Skill(s) from the Available skills box to the Skills in this report box. Click to move all skills. Note! Click to move the selected skill(s) from the Skills in this report box to the Available skills box. Click to move all skills. 8. Click Next. 9. Click Finish. 10. The Skill Dispositions Chart report opens: 69
 and are displayed in the myagent interface in the Dispositions screen, when a contact has completed.")
70 Skill Dispositions Pie Dispositions are descriptions of why a contact entered the network, or why a contact ends. Dispositions are created and selected in webmanager (webmanager > Dispositions) and are displayed in the myagent interface in the Dispositions screen, when a contact has completed. The Skill Dispositions Pie report generates data according to the number of dispositions that are associated with skills. To Generate the Skill Dispositions Pie Report: 1. Right-click the icon in the systems tray. 2. Click Historical Reports > Skill Dispositions Pie 3. The Skill Dispositions Pie report opens: 4. There are different views of this report that intouch can generate. Using the three buttons in the lower left corner, different reports can be generated according to your business needs: Report Menu Show Graph Show Report Data 70

71 Skill Dispositions Pie: Report Menu When you click in the lower left corner, the menu for this report opens: This report menu includes the following options: 71

72 Skill Dispositions Pie: Report Properties The report properties are used to select filters for specific data to be generated. To Access Report Properties: 1. Click Report Properties. 2. The Date Range screen opens: 3. Select the Start date. 4. Select the End date. 5. Click Next. 72
73 6. The Skills tab opens: 7. Click to move the selected skill(s) from the Available skills box to the Skills in this report box. Click to move all skills. Note! Click to move the selected skill(s) from the Skills in this report box to the Available skills box. Click to move all skills. 8. Click Next. 9. Click Finish. 10. The Skills Dispositions Pie report opens: 73

74 Skill Disposition Pie: Show Graph To view the report as a graph, click in the lower left corner of the screen. This report shows the disposition and the percentage of time the dispositions were selected: Note! The pie chart is the default chart type for this report. If the pie chart does not display the data in a way that meets your business needs, you can go to the Chart Properties to select another chart type for a session. Skill Disposition Pie: Show Report Data To view report data, click. The data for this report is displayed: This report data displays the following: Column Disposition Count Description The disposition(s) that were included in the report. The number of times the specified disposition was selected. Note! When you select Copy data to clipboard, from the Report Menu, this data will be copied to the clipboard. You can then open a spreadsheet program, such as Excel, and press CTRL+V on your keyboard or select Paste from the Edit menu in the spreadsheet file. 74
75 Unavailable Stats The data for the Unavailable Stats report are generated based on the unavailable codes that are created in webmanager (webmanager > Unavailable Codes). Unavailable codes are optional, customized reasons that agents can select in myagent for going to an unavailable state. If you configure unavailable codes for a team, an agent assigned to that team will have to select an unavailable code before they can go to an unavailable state. When an agent selects an unavailable code, incontact records the unavailable codes that agents select. This report shows the percentage of agents who selected the different unavailable codes. To Generate the Unavailable Stats Report: 1. Right-click the icon in the systems tray. 2. Click Historical Reports > Unavailable Stats 3. The Unavailable Stats report opens: 4. There are different views of this report that intouch can generate. Using the three buttons in the lower left corner, different reports can be generated according to your business needs: Report Menu Show Graph Show Report Data 75

76 Unavailable Stats: Report Menu When you click in the lower left corner, the report menu opens: The Report Menu includes the following options: 76
77 Unavailable Stats: Report Properties The report properties are used to select filters for specific data to be generated. To Access Report Properties: 1. Click Report Properties. 2. The Date Range screen opens: 3. Select the Start date. 4. Select the End date. 5. Click Next. 77
78 6. The Teams tab opens: 7. Click to move the selected team(s) from the Available teams box to the Teams in this report box. Click to move the selected team(s) from the Teams in this report box to the Available teams box. Note! Click to move the selected teams(s) from the Teams in this report box to the Available teams box. Click to move all teams. 8. Click Next. 9. The Agents tab opens: 10. Click to move the selected agent(s) from the Available agents box to the Agents in this report box. Click to move all agents. Note! Click to move the selected agent(s) from the Agents in this report box to the Available agents box. Click to move all agents. 11. Click Next. 78
79 12. The Media tab opens: 13. Click to move the selected media from the Available media box to the Media in this report box. Click to move all media. Note! Click to move the selected media from the Media in this report box to the Available media box. Click to move all media. 14. Click Finish. 15. The Unavailable Stats report opens: 79
 for your teams and agents: Note! The pie chart is the default chart type for this report.")
80 Unavailable Statistics: Show Graph To view the report as a graph, click in the lower left corner of the screen. This report displays the data according to the unavailable codes (created in webmanager) for your teams and agents: Note! The pie chart is the default chart type for this report. If the pie chart does not display the data in a way that meets your business needs, go to the Report Properties > Chart Properties to select another chart type for a session that better meets your needs. Unavailable Statistics: Show Report Data To view report data, click. The data for this report is displayed: This report shows the unavailable codes (created in webmanager) selected by agents logged in to myagent. This report shows the unavailable codes according to the date range selected in the Date Range tab. The unavailable codes listed will be different for each customer based on the unavailable codes that are created. Note! When you select Copy data to clipboard, from the Report Menu, this data will be copied to the clipboard. You can then open a spreadsheet file, such as Excel, and press CTRL+V from your keyboard or select Paste from the Edit menu to paste the data to the file. 80


81 Chart Properties There are several tabs available on the Print Chart. However, this screen allows you to change the chart type for a session. This document reviews only a few of the tabs that are in the Print Chart Properties. When you click Chart Properties in the Report Menu: The following tabs opens: This screen will be different for each report, depending on which report is opened. The default chart type for each report will be displayed; however, if you want to change it, you can click Change on the lower right side of this screen. 81


82 When you click Change, the following tabs open: Standard Extended 3D 82


83 Financial Stats Other These report options are available only if you want to change them. You do not need to change them -only if it meets what your business needs. The rest of the tabs can be used to change other things, such as the outlines of charts, the size, the type etc. You can change the fonts, etc. 83
incontact Pro intouch Reference Manual
 incontact Pro intouch Reference Manual Error! No text of specified style in document. incontact PRO intouch Reference Manual Title incontact PRO intouch Reference Manual Revision 02112010 Copyright About
incloud Third Party Monitoring
 incloud Third Party Monitoring Title incontact Third Party Monitoring Revision 08.5.2011 Copyright 2011 incontact, Inc About incontact incontact, Inc. provides the market leading on-demand contact center
Echo Surveys for incontact Pro. Reference Manual
 Echo Surveys for incontact Pro Reference Manual Echo Surveys for incontact Pro Reference Manual Title Echo Surveys for incontact Pro Reference Manual Revision 03162010 Copyright About incontact 2010 incontact,
incontact Auto Attendant Admin Reference Manual
 incontact Auto Attendant Admin Reference Manual incontact Auto Attendant Admin Reference Manual Title incontact Auto Attendant Admin Reference Manual Revision 04052011 Copyright About incontact 2011 incontact,
incontact DB Connector Reference Manual
 incontact DB Connector Reference Manual incontact DB Connector Reference Manual Title incontact DB Connector Reference Manual Revision 062413 Copyright 2013 incontact, Inc. Product Code About incontact
CUIC Historical Reporting - End User Guide
 Document Number: 00250 Page 1 of 28 Authors: Jeff Lee Nadine Terrell Document Title: CUIC Historical Reporting User Guide Current Version: 1.0 Date: 03/10/15 CUIC Historical Reporting - End User Guide
Interaction Supervisor Printed Help. PureConnect powered by Customer Interaction Center (CIC) 2018 R2. Abstract
 2018 R2. Abstract") Interaction Supervisor Printed Help PureConnect powered by Customer Interaction Center (CIC) 2018 R2 Last updated February 26, 2018 Abstract This document describes how to configure CIC's real-time performance
Interaction Supervisor Printed Help PureConnect powered by Customer Interaction Center (CIC) 2018 R2 Last updated February 26, 2018 Abstract This document describes how to configure CIC's real-time performance
incontact v12.2 Release Notes
 incontact v12.2 Release Notes Title incontact v12.2 Release Notes Revision 7.31.2012 Contributors About incontact Copyright Disclaimer Philip van Dijk, Sean Bangerter, Sarah Williams, William Closs, Nick
3. Reports are typically displayed in columns with the ability to sort the data using the up/down arrows on that particular column.
 Reports Guide 1. Any of the reports generated below can be exported as one of the following file types: CSV: Comma Separated Value; this is the most common spreadsheet file type and can be opened in almost
Information for Business Group Administrators
 Information for Business Group Administrators Integrated ACD for Business Group Administrators Integrated ACD allows Business Group Administrators to see detailed statistical information on the activity
Five9 Virtual Contact Center
 Cloud Contact Center Software Five9 Virtual Contact Center Dashboards and Reports Catalog November 2016 Five9 dashboards and reports enable you to compile and display detailed performance information about
incontact Workforce Management v2 Planner Web Site User Manual
 incontact Workforce Management v2 Planner Web Site User Manual www.incontact.com incontact WFM v2 Planner Web Site User Manual Version 16.1 Revision March 2016 About incontact incontact (NASDAQ: SAAS)
Cisco Unified Contact Center Express Historical Reporting Guide, Release 10.6(1)
") Cisco Unified Contact Center Express Historical Reporting Guide, Release 10.6(1) First Published: December 15, 2014 Americas Headquarters Cisco Systems, Inc. 170 West Tasman Drive San Jose, CA 95134-1706
Cisco Unified Contact Center Express Historical Reporting Guide, Release 10.6(1) First Published: December 15, 2014 Americas Headquarters Cisco Systems, Inc. 170 West Tasman Drive San Jose, CA 95134-1706
MANUAL 2 - CREATING YOUR CAMPAIGN PART 1
 MANAGE TRAINING MANUAL MANUAL 2 - CREATING YOUR CAMPAIGN PART 1 Last Update 7/23/2018 Contents MANUAL 2 - CREATING YOUR CAMPAIGN Training Videos... 2 Campaigns... 3 New Campaign Checklist... 4 Campaigns
Cisco Unified Contact Center Express Historical Reporting Guide, Release 10.5(1)
") Cisco Unified Contact Center Express Historical Reporting Guide, Release 10.5(1) First Published: June 11, 2014 Americas Headquarters Cisco Systems, Inc. 170 West Tasman Drive San Jose, CA 95134-1706 USA
Cisco Unified Contact Center Express Historical Reporting Guide, Release 10.5(1) First Published: June 11, 2014 Americas Headquarters Cisco Systems, Inc. 170 West Tasman Drive San Jose, CA 95134-1706 USA
Virtual Office. Virtual Office Analytics An Overview. Version 1.0. Revision 1.0
 Virtual Office Virtual Office Analytics An Overview Version 1.0 Revision 1.0 Copyright 2015, 8x8, Inc. All rights reserved. This document is provided for information purposes only and the contents hereof
RCN BUSINESS INTEGRATED ACD. Administrator s Guide
 RCN BUSINESS INTEGRATED ACD Administrator s Guide 2 Table of Contents 3-6 Integrated ACD for Business Group Administrators How Integrated ACD Works MLHGs Integrated ACD 39-42 Creating a Report Before You
FAQs. Overview. Cisco Unified Contact Center Express Report User Guide, Release 11.5(1) 1
 1") Overview, page 1 General, page 2 Availability of Reporting Data, page 4 Data Reconciliation Among Reports, page 7 Abandoned Call Detail Activity Report, page 10 Agent Call Summary Report, page 11 Agent
Overview, page 1 General, page 2 Availability of Reporting Data, page 4 Data Reconciliation Among Reports, page 7 Abandoned Call Detail Activity Report, page 10 Agent Call Summary Report, page 11 Agent
Contact Center Anywhere Reports Guide. Version September 2007
 Contact Center Anywhere Reports Guide Version 8.1.1 September 2007 Copyright 2005, 2006, 2007, Oracle. All rights reserved. The Programs (which include both the software and documentation) contain proprietary
Cisco Supervisor Desktop User Guide
 Cisco Supervisor Desktop User Guide CAD 7.6 for Cisco Unified Contact Center Enterprise Release 7.5 First Published: May 2010 Last Modified: March 25, 2013 Americas Headquarters Cisco Systems, Inc. 170
1 P age NEXTIVA CALL CENTER. Supervisor User Guide. nextiva.com/support 2015 NEXTIVA, ALL RIGHTS RESERVED
 1 P age NEXTIVA CALL CENTER Supervisor User Guide nextiva.com/support 2015 NEXTIVA, ALL RIGHTS RESERVED 2 P age Creating Employees... 3 Creating an Employee... 3 Assigning Licenses to Employees... 7 Schedules...
Salesforce Extension Customization Guide
 Salesforce Extension Customization Guide Title Salesforce Extension Customization Guide Revision 04.11.2013 Contributors Purpose About incontact Copyright Disclaimer Namitha Nayak; Sean A. Bangerter This
Contact Center Anywhere Reports User s Guide. Version 8.1 March 2007
 Contact Center Anywhere Reports User s Guide Version 8.1 March 2007 Copyright 2005, 2006, 2007, Oracle. All rights reserved. The Programs (which include both the software and documentation) contain proprietary
Interaction Center Business Manager Supervisor Functions
 Interaction Center Business Manager Supervisor Functions CIC 2016 RX 1 Contents Interaction Supervisor... 10 Introduction... 10 Views... 10 Access to Views is controlled by License Assignment... 11 Alerts...
Virtual Communications Express Admin Guide: Configure Call Center
 Overview Hunt Groups allow a defined group of users to handle incoming calls received by an assigned Hunt Group s phone number. Call Centers add another dimension by providing an automated answer for all
Call Center v3.0 for IPBRICK Guide
 Call Center v3.0 for IPBRICK Guide IPBRICK SA February 10, 2015 1 1 Introduction Organizations use call centers as a way to interact and build relationships with their customers. Being aware of the importance
Cisco Supervisor Desktop User Guide
 Cisco Supervisor Desktop User Guide CAD 9.0 for Cisco Unified Contact Center Express Release 9.0 First Published: July 2012 Last Modified: January 30, 2014 Americas Headquarters Cisco Systems, Inc. 170
UPTIVITY DISCOVER USER MANUAL, V5.6. April
 UPTIVITY DISCOVER USER MANUAL, V5.6 April 2015 www.incontact.com UPTIVITY DISCOVER USER MANUAL, V5.6 Version: 5.6 Revision: April 2015 About incontact: incontact (NASDAQ: SAAS) is the cloud contact center
Customer Journey Platform Customer Engagement Analyzer User Guide
 Customer Journey Platform Customer Engagement Analyzer User Guide Notification Copyright Notice The Broadsoft CC-One solution has been renamed the Cisco Customer Journey Platform. Beginning in August 2018,
Five9 Virtual Contact Center
 Cloud Contact Center Software Five9 Virtual Contact Center Supervisor s Guide January 2018 The Five9 Supervisor application enables you to monitor and control activities of the VCC, view statistics, generate
VCC Chat Feature Highlights
 VCC 2.5.9 Chat Feature Highlights Agenda VCC Chat Channel Overview VCC Dashboard Chat Features Overview VCC Agent Desktop Chat Features Overview Managing the Channel Status Agent Status Monitoring for
Lightpath Hosted Voice
 Lightpath Hosted Voice CONTENTS 1 Call Queuing User Guide for Business Group Administrators...1 1.1 How Call Queuing works...1 1.1.1 Multi Line Hunt Group... 1 1.1.2 Call Queuing... 2 1.1.3 Getting Started
NEXTIVA ANALYTICS USER GUIDE. nextiva.com/support
 NEXTIVA ANALYTICS USER GUIDE nextiva.com/support Contents Logging In... 2 Landing Page... 2 Reporting... 3 Total Count Chart... 4 Count by Day Chart... 4 Hourly Average Chart... 4 Counts by State Chart...
Inbound Reports. Cisco Unified Contact Center Express Report Description Guide, Release 11.0(1) 1
 1") Abandoned Call Detail Activity Report, page 2 Aborted Rejected Call Detail Report, page 3 Agent All s Report, page 6 Agent Call Summary Report, page 9 Agent Detail Report, page 12 Agent Login Logout Activity
Abandoned Call Detail Activity Report, page 2 Aborted Rejected Call Detail Report, page 3 Agent All s Report, page 6 Agent Call Summary Report, page 9 Agent Detail Report, page 12 Agent Login Logout Activity
Uptivity WFO User Manual, v5.7
 Uptivity WFO User Manual, v5.7 www.incontact.com Uptivity WFO User Manual, v5.7 Version 5.7 Revision September 2015 About incontact incontact (NASDAQ: SAAS) is the leader in cloud contact center software,
Interaction Feedback Help Printed help. PureConnect powered by Customer Interaction Center (CIC) 2018 R1. Abstract
 2018 R1. Abstract") Interaction Feedback Help Printed help PureConnect powered by Customer Interaction Center (CIC) 2018 R1 Last updated October 31, 2017 Abstract This document is a printable version of the Interaction Feedback
Interaction Feedback Help Printed help PureConnect powered by Customer Interaction Center (CIC) 2018 R1 Last updated October 31, 2017 Abstract This document is a printable version of the Interaction Feedback
MaxReports. User Manual. MaxACD 7.0
 MaxReports User Manual MaxACD 7.0 September 2017 WARNING! Toll fraud is committed when individuals unlawfully gain access to customer telecommunication systems. This is a criminal offense. Currently, we
Telax Administrator Portal
 Telax Administrator Portal Table of Contents A. Getting Started... 2 B. Home... 2 C. Executive Dashboard... 3 E. Configuration... 5 1. General Page... 5 2. Working Hours... 5 3. Contact List:... 6 4. Queues:...
Arc Call Connect. Supervisor. User Guide. Version 5.0
 Arc Call Connect Supervisor User Guide Version 5.0 2003-2008 Arc Solutions (International) Ltd. All rights reserved No part of this documentation may be reproduced in any form or by any means or used to
Contact Center Advisor and Workforce Advisor. Genesys Performance Management Advisors TM. Administration User Manual Release 3.3
 Genesys Performance Management Advisors TM Administration User Manual Release 3.3 Genesys Advisor, Contact Center Advisor, Workforce Advisor, Alert Management, Resource Management, and Genesys Performance
incontact Workforce Optimization Reporting Manual, 16.1
 incontact Workforce Optimization Reporting Manual, 16.1 www.incontact.com incontact Workforce Optimization Reporting Manual, 16.1 Version 16.1 Revision March 2016 About incontact incontact (NASDAQ: SAAS)
Five9 Adapter for Oracle
 Cloud Contact Center Software Five9 Adapter for Oracle Agent s Guide November 2017 This guide describes how to use the integration between Five9 and the Oracle Service Cloud to process calls, voicemail,
Integrated ACD User Guide
 Technology Solutions, Delivered with Care Integrated ACD User Guide Integrated Act Solution Guide Table of Contents Integrated ACD User Guide for 2 1.1 How Integrated ACD Works 2 1.1.1 Multi Line Hunt
Unified ICM/Unified CCE Reporting Concepts
 Abandoned Calls, page 2 Agent States, page 2 Average Speed of Answer, page 3 Bucket Intervals, page 3 Call Detail Data, page 4 Call Types, page 5 Call Type Intervals, page 5 Error Count, page 5 FTE, page
Cisco Supervisor Desktop User Guide
 Cisco Supervisor Desktop User Guide CAD 10.6 for Cisco Unified Contact Center Express Release 10.6 First Published: First Published: December 17, 2014 Last Updated: Last Updated: April 1, 2015 Cisco Systems,
Start your greeting once the Incoming Call window appears. Make sure you are in Ready state to receive incoming calls
 Agent Desktop Plus Working With Voice Calls Receiving & Initiating Calls Receiving an Outbound Campaign Call Make sure you are in Ready state to receive incoming calls Always enable Auto-Answer for Outbound
UPTIVITY DISCOVER WEB PLAYER MANUAL, V February
 UPTIVITY DISCOVER WEB PLAYER MANUAL, V5.5.1 February 2015 www.incontact.com UPTIVITY DISCOVER WEB PLAYER MANUAL, V5.5.1 Version: 5.5.1 Revision: February 2015 About incontact: incontact (NASDAQ: SAAS)
Instructions for SAP CCtr. How to use SAP Contact Center phone system
 Instructions for SAP CCtr How to use SAP Contact Center phone system How to start the program 1. Open Internet Explorer browser. Type http://[sap Contact Center Website].ipcallcenters.eu into the address
UNITY DASHBOARD LATEST RELEASE NOTES
 UNITY DASHBOARD LATEST RELEASE NOTES CONTENTS Release 1.1.7.3... 2 Release 1.1.6.5... 3 Release 1.1.5.4... 4 Release 1.1.4.5... 5 Release 1.1.3.2... 7 Release 1.1.2.2... 8 Release 1.1.1.1... 9 Release
Cisco Finesse Desktop Interface
 When you sign in to Cisco Finesse, the appearance of the desktop depends on whether your role is that of an agent or a supervisor. Supervisors have additional features that appear on their desktops. This
Clearspan Hosted Thick Call Center Quick Reference Guide
 Clearspan Hosted Thick Call Center Quick Reference Guide Agent Tasks Call Center Interface The following elements are available from the Call Center interface: Menu bar Located at the top, it allows you
Hosted VoIP Phone System. Blue Platform. Hosted Call Center. Agent User Guide
 Hosted VoIP Phone System Blue Platform Hosted Call Center Agent User Guide Contents 1 About This Document... 5 1.1 Audience... 5 1.2 How This Guide is Organized... 5 1.3 Software Requirements... 6 2 Introduction
Load Watch SM Distributed Resources System Operations Center
 DTE Energy Generator and Energy Monitoring Services Load Watch SM Distributed Resources System Operations Center Users Guide V.8 March 00 For Technical Support or Questions Call --5-5590 Log-in Screen
Harvard Phone. Introduction to Contact Center CONTACT CENTER CLIENT QUICK REFERENCE QUIDE
 Introduction to Contact Center Interaction Desktop is an interaction and communications manager for desktop or laptop PCs, and offers more functionality than your office telephone. Use it to manage all
incontact Workforce Management v2 Scheduler Web Site User Manual
 incontact Workforce Management v2 Scheduler Web Site User Manual www.incontact.com incontact WFM v2 Scheduler Web Site User Manual Version 16.1 Revision March 2016 About incontact incontact (NASDAQ: SAAS)
OpenScape Contact Center Multimedia. First Contact Resolution in a Multi-Channel World <insert date here>
 OpenScape Contact Center Multimedia First Contact Resolution in a Multi-Channel World Agenda OpenScape Contact Center Agile vs. Enterprise What is OpenScape Contact Center Multimedia
Cisco Unified Contact Center Express Reporting Guide, Release 11.6(1)
") First Published: 2017-08-24 Americas Headquarters Cisco Systems, Inc. 170 West Tasman Drive San Jose, CA 95134-1706 USA http://www.cisco.com Tel: 408 526-4000 800 553-NETS (6387) Fax: 408 527-0883 THE
First Published: 2017-08-24 Americas Headquarters Cisco Systems, Inc. 170 West Tasman Drive San Jose, CA 95134-1706 USA http://www.cisco.com Tel: 408 526-4000 800 553-NETS (6387) Fax: 408 527-0883 THE
Five9 Adapter for Oracle
 Cloud Contact Center Software Five9 Adapter for Oracle Administrator s Guide July 2017 This guide describes how to configure the integration between Five9 and the Oracle Service Cloud, previously know
Hosted IP Phone System Hosted Call Center (HCC) Reports Manual for Business Group Administrators
 Reports Manual for Business Group Administrators") Before you begin You must be able to access the Administrator Portal interface: https://portal.popp.com/bg The Administrator Portal is supported on the latest versions of all major browsers and operating
Before you begin You must be able to access the Administrator Portal interface: https://portal.popp.com/bg The Administrator Portal is supported on the latest versions of all major browsers and operating
Litchfield School District SAU #27. Staff Facility Requests Quick Step Guide for Registered Requesters
 Staff Facility Requests Quick Step Guide for Registered Requesters Go to the Litchfield School District website and click on the Staff Facility Requests button under Important Resources. It will take you
HOSTED CONTACT CENTRE
 ---------------------------------------------------------------------------- ------- --------- HOSTED CONTACT CENTRE AGENT CONSOLE GUIDE Version 9.4 Revision 1.0 Confidentiality and Proprietary Statement
UPTIVITY DISCOVER QUALITY MANAGEMENT MANUAL, V5.6. April
 UPTIVITY DISCOVER QUALITY MANAGEMENT MANUAL, V5.6 April 2015 www.incontact.com UPTIVITY DISCOVER QUALITY MANAGEMENT MANUAL, V5.6 Version: 5.6 Revision: April 2015 About incontact: incontact (NASDAQ: SAAS)
Interaction Desktop Agent Overview
 Interaction Desktop Agent Overview Overview Logging in Changing password Setting Status Receiving Calls Making Calls Directories Transferring Calls Wrap Up Codes Handling Queued Voicemails, Emails, and
Virtual Communications Express User Guide: Call Center Agent
 Feature Overview The Call Center is designed to support the needs of Call Center agents in any environment. It supports the full set of call handling functions, ACD state management, integration of multiple
Five9 Virtual Contact Center
 Cloud Contact Center Software Five9 Virtual Contact Center Campaign Administrator s Guide September 2017 This guide describes how to create, configure, and manage outbound, inbound, and autodial campaigns.
Agent Administration
 This chapter explains the tasks you must be familiar with when setting up agents for your Unified CCE contact center. Administering Agents, page 1 Configure Not Ready Reason Codes, page 4 Agent Feature
votacall unity supervisor
 votacall unity supervisor quick user guide contents 1 Ini al Setup... 3 1.1 Call Center Login Details... 4 2 Unity Supervisor Interface Overview...5 2.1 ACD State Bu ons... 5 2.2 Call Control... 6 2.3
Uptivity WFO Customer Guide to Avaya PC Dialer Integrations
 Uptivity WFO Customer Guide to Avaya PC Dialer Integrations www.incontact.com Uptivity WFO Customer Guide to Avaya PC Dialer Integrations Version This guide should be used with Uptivity WFO v5.6 or later.
TABLE OF CONTENTS SECTION 1: INTRODUCTION TO PRIMAVERA PROJECT MANAGEMENT 3 PROJECT MANAGEMENT MODULE 3
 Miami-Dade County Public Schools Project Manager Training Conducted by Evans Technology Primavera Project Management (P3eC) for Engineering and Construction v.4.1 June 2005 TABLE OF CONTENTS SECTION 1:
CTMS. Quick Reference Card. Using the CTMS Dashboard. Accessing the CTMS Dashboard. Viewing All Metrics
 Overview The Dashboard reports key metrics about DCRI protocols. This Quick Reference Card (QRC) summarizes Dashboard operations for Project Leaders. All protocol names and data in this QRC are fictitious.
Unified CCX Outbound Dialer Configuration
 Outbound Feature for Unified CCX, on page 1 Supported Dialers and Dialing Modes for Outbound, on page 5 Configure Outbound Subsystem in Unified CCX, on page 7 Configure General Outbound Properties, on
Net2Phone Office Administrator s Guide
 Net2Phone Office Administrator s Guide May 2015 All Rights Reserved The use, disclosure, modification, transfer or transmittal of this work for any purpose, in any form, or by any means, without the written
MANUAL 4 BUILDING A SCRIPT
 MANAGE TRAINING MANUAL MANUAL 4 BUILDING A SCRIPT Updated 3/26/2018 Contents Scripting... 2 Script Screen... 3 Assignment Icons... 3 Show Inactive Scripts... 3 Add Script... 3 Add Script Screen... 4 External
IP Talk Hosted VoIP Solutions Call Detail Record Reporting User Guide
 IP Talk Hosted VoIP Solutions Call Detail Record Reporting User Guide 10.6.09 1 Table of Contents Overview... 3 Logging In... 4 Running a Report (Individual)... 5 Running a Report (Administrative)... 6
PRODUCT DOCUMENTATION. Contact Center Supervisor User Guide
 PRODUCT DOCUMENTATION Contact Center Supervisor User Guide R E L E A S E 5 Document and Software Copyrights Copyright 1998 2009 by ShoreTel, Inc., Sunnyvale, California, U.S.A. All rights reserved. Printed
GTB Enterprise Contact Center Powered by Telax Included In Package Not Included in Package
 GTB Enterprise Contact Center Powered by Telax Max Calls In Queue Unlimited Unlimited Data Center Features 24x7x365 Data Center Monitoring Yes Yes Geographical Survivability Yes Yes Automatic Software
Five9 Supervisor App for ipad
 Cloud Contact Center Software Five9 Supervisor App for ipad Last updated June 25, 2014 What's New in the Five9 Supervisor App for ipad? New Agent Overview screen gives supervisors a graphical view of agent
Five9 Virtual Contact Center
 Cloud Contact Center Software Five9 Virtual Contact Center Agent s Guide November 2017 This guide describes how to receive and process calls and textual interactions and use tools, such as scripts, worksheets,
votacall unity supervisor
 votacall unity supervisor help guide contents 1 About Unity Supervisor...7 1.1 Standard vs Enterprise Features... 7 1.2 Naming Conven ons for this Help... 8 1.3 System Requirements... 8 1.3.1 Windows PC
UPTIVITY DISCOVER REPORTING MANUAL, V5.6. April
 UPTIVITY DISCOVER REPORTING MANUAL, V5.6 April 2015 www.incontact.com UPTIVITY DISCOVER REPORTING MANUAL, V5.6 Version: 5.6 Revision: April 2015 About incontact: incontact (NASDAQ: SAAS) is the cloud contact
ACD (Automatic Call Distributor) Operation Manual
 Operation Manual") ACD (Automatic Call Distributor) Operation Manual Ver1.1.0 2018/11/13 1 Table of Contents Preface ACD (Automatic Call Distributor) is a Cloud PBX feature used in handling large volume of incoming calls.
ACD (Automatic Call Distributor) Operation Manual Ver1.1.0 2018/11/13 1 Table of Contents Preface ACD (Automatic Call Distributor) is a Cloud PBX feature used in handling large volume of incoming calls.
Uptivity WFO Reporting Manual, v5.7
 Uptivity WFO Reporting Manual, v5.7 www.incontact.com Uptivity WFO Reporting Manual, v5.7 Version 5.7 Revision September 2015 About incontact incontact (NASDAQ: SAAS) is the cloud contact center software
CC Supervisor. User's Guide Manual. Version 3.0
 CC Supervisor User's Guide Manual Version 3.0 Poltys, Inc. 3300 N. Main Street, Suite D #160, Anderson, SC 29621-4128 +1 (864) 642-6103 www.poltys.com 2011 Poltys, Inc. All rights reserved. The information
UPTIVITY DISCOVER REPORTING MANUAL, V February
 UPTIVITY DISCOVER REPORTING MANUAL, V5.5.1 February 2015 www.incontact.com UPTIVITY DISCOVER REPORTING MANUAL, V5.5.1 Version: 5.5.1 Revision: February 2015 About incontact: incontact (NASDAQ: SAAS) is
Unified CCX Reporting
 Reporting Administration on Unified CCX, on page 1 Reporting Administration on Unified Intelligence Center, on page 44 Reporting Administration on Unified CCX Import of Stock Reports To apply a patch if
Vendor Comply. Quick Start Guide
 Vendor Comply Quick Start Guide v1.0 March 2016 Vendor Comply Quick Start Guide 1 Contents How to Access Vendor Comply... 2 How to Log into Vendor Comply... 3 Initial Login... 3 Forgotten Password... 3
3Com exchange Call Center Administration Guide
 3Com exchange Call Center Administration Guide Version 4.33 http://www.3com.com Part Number 900-0146-01 Rev AA Published May 2004 3Com Corporation, 350 Campus Drive, Marlborough, MA 01752-3064 Copyright
Astra Schedule User Guide Scheduler
 Astra Schedule User Guide 7.5.12 Scheduler 1 P a g e ASTRA SCHEDULE USER GUIDE 7.5.12... 1 LOGGING INTO ASTRA SCHEDULE... 3 LOGIN CREDENTIALS... 3 WORKING WITH CALENDARS... 4 CHOOSING A CALENDAR AND FILTER...
SYNTHESYS MANAGEMENT
 SYNTHESYS MANAGEMENT Teams User Management Synthesys.Net Management Basics 1 SYNTHESYS.NET MANAGEMENT Introduction... 3 Synthesys Management Features... 4 User Login... 5 Synthesys Management Main Screen...
exchange Call Center Agent Guide
 exchange Call Center Agent Guide Version 4.6 NBX System Release 6.5 http://www.3com.com Part Number: 900-0419-01 Published April 2009 3Com Corporation, 350 Campus Drive, Marlborough MA 01752-3064 Copyright
HOSTED CONTACT CENTRE
 ---------------------------------------------------------------------------- ------ HOSTED CONTACT CENTRE ANALYTICS GUIDE Version 9.4 Revision 1.0 Confidentiality and Proprietary Statement This document
Portal User Guide. Portal Release 3.13
 Portal User Guide Portal Release 3.13 https://portal.3starsnet.com Page 1 01-08-2018 Contents 1 Introduction 4 2 Accessing Messages on the Web Interface 4 2.1 Searching for Messages 4 2.2 Sorting Messages
incontact Workforce Management v2 Agent Workstation Administrator Web Site User Manual
 incontact Workforce Management v2 Agent Workstation Administrator Web Site User Manual www.incontact.com incontact WFM v2 Agent Workstation Administrator Web Site User Manual Version 16.1 Revision March
MANUAL 1 SETTING UP YOUR ACCOUNT
 MANAGE TRAINING MANUAL MANUAL 1 SETTING UP YOUR ACCOUNT Last Update 2/14//2018 Contents About CallShaper... 1 Training Videos... 2 Support... 3 Help Center Library... 3 Submitting A Support Ticket... 4
Scheduling Module Client Booking Quick Guide Online-Scheduling
 Scheduling Module Last Updated: November 26, 2009 System Administration Contact: Colin Bryant Phone: 604-822-7374 E-mail: PsychIT@exchange.ubc.ca Logon to Book King Enter the following URL into your address
Hosted VoIP Phone System. Hosted Call Center. Supervisor User Guide
 Hosted VoIP Phone System Hosted Call Center Supervisor User Guide Contents 1 About This Document... 6 1.1 Audience... 6 1.2 How This Guide is Organized... 6 1.3 Software Requirements... 7 2 Introduction
12/ Update1. AltiReport. Manual
 12/2009 4510-0001-6.5 Update1 AltiReport Manual WARNING! Toll fraud is committed when individuals unlawfully gain access to customer telecommunication systems. This is a criminal offense. Currently, we
Requesting Time Off: Employee Navigation Salaried Non-Exempt
 Requesting Time Off: Employee Navigation Salaried Non-Exempt Logging on Log in using your Clemson Primary* Username and Password. URL: https://clemson.kronos.net (*To determine your Primary Username, go
Five9 Adapter for Velocify
 Cloud Contact Center Software Five9 Adapter for Velocify Agent s Guide November 2017 The Five9 Adapter for Velocify enables you to integrate the Five9 Cloud Contact Center with the Velocify desktop. This
Unified CCX Outbound Dialer Configuration
 Outbound Feature for Unified CCX, page 1 Supported Dialers and Dialing Modes for Outbound, page 5 Configure Outbound Subsystem in Unified CCX, page 6 Configure General Outbound Properties, page 6 Configure