AGENT-BASED MODELING BOOTCAMP FOR HEALTH RESEARCHERS AUGUST 2012 A SIMPLE NETWORK-BASED INFECTION SPREAD AGENT-BASED MODEL
|
|
|
- Barbara Richards
- 6 years ago
- Views:
Transcription
1 Rating: Basic Prerequisites: Building a Minimalist Network-Based Model Framework Estimated Time Required: 1 hour This exercise rehearses basic steps that can be used to create a model of infection spread.. For simplicity, we focus on models where the network is static i.e. does not change over time. 1. Open the model you built for the exercise Building a Minimalist Network-Based Model Framework, or the pre-provided model MinimalistNetworkABMModel 2. Save the model to a new model, entitled MinimalistSIRNetworkABM. In the Java package field, use the lower case version of this name ( minimalistsirnetworkabmmodel ) 3. Double click on Person in the Project window. This should open the canvas for the Person class, showing the visual specification of a Person in this model. Currently, this contains only the visual representation of a person (consisting of an oval and a line). 4. Open the Model tab of the Palette window 5. Add an Entry Point to the Person canvas. Note that the procedure for adding this differs by version of AnyLogic. In our version of AnyLogic, this is accomplished by dragging the Entry Point from the palette to the canvas From now on, we ll assume that you are familiar with the appropriate procedure to add things from the palette. 6. After you add the Entry Point to the model, you will see that it has a default name of statechart. Type in infectionstatechart instead; if you a window appears to ask if you wish to perform refactoring, indicate no this is something only of concern if we ve already made elements of the model depend on the original name. Please note that this can be changed in the Palette window as well as in the Canvas. 7. Add a State from the Palette window to the model (the canvas for Person). This process involves dragging on the canvas. When you add the State, try to position it so that it overlaps with the very end of the Entry Point, or at least some of the end segment of the Entry Point. Positioning the State in this way will let you automatically connect the State to the Entry Point. As you are dragging the shape across the Entry Point in this way, you will know that it will be connected if you see the end of the Entry Point turn green (or aqua). See the image below.
2 8. Click on the entry point, and make sure that the circle at the lower ( pointy ) end of it is coloured green or aqua. If it is not coloured green, drag the circle so that it overlaps with the state, and turns green (aqua). When it is green (aqua), you can release it AnyLogic may adjust the details of the spacing. Click on the state that you had added. Note that Properties window specifies the properties for this state. For Name, please enter Susceptible (no quotes should be included) 9. Proceeding vertically downward, add two more states from the palette, entitled Infective and Recovered, respectively. The result of adding these states should look something like the following. 10. From the Palette window, add a new Transition by first clicking on Transition and then clicking and dragging from the Susceptible state to the Infective state; this
3 will connect the two. When you add this transition, its properties will appear in the Properties menu. Set its properties as follows: a. In the Name field, call this transition infection. b. In the Triggered by dropdown, indicate a Rate. This indicates that the transition will occur according to a Poisson process, a memoryless process associated with a mean residence time of the reciprocal of the rate. c. In the rate field, we will specify a constant rate of 0.1 (implying a residence time of 1/0.1 = 10 time units). Note that while the rate is constant in this case, we can in general have a time-varying rate, although some care is taken to make AnyLogic know when the rate has changed. d. In the Action field, for the time being, we ll have the Person report when they ve been infected by printing out a message to the Console window. For the Action, enter ` traceln(this + " has been infected!") [Note that the double quotes should be included within this fragment of Java]. This reporting message prints the name of the agent ( this ) and then follows that by the suffix has been infected!. In drawing this transition, be sure to again check to confirm that the small circles at the end of the arrow are green (aqua) indicating that both ends of the transition are connected to the appropriate states. 11. From the Palette window, add a new Transition connecting the Infective and Recovered state. When you add this transition, its properties will appear in the Properties menu. Set its properties as follows. a. In the Name field, call this transition recovery.
4 b. In the Triggered by dropdown, indicate a Timeout. This indicates that the transition will occur exactly a specified residence of time after entering the state. c. In the rate field, we will specify a timeout of 20. d. In the Action field, for the time being, we ll have the Person report when they ve recovered by printing out a message to the Console window. For the Action, enter ` traceln(this + "has recovered!") [Note that the double quotes should be included within this fragment of Java]. This message prints the name of the agent ( this ) and then follows that by the suffix has recovered!. In drawing this transition, be sure to again check to confirm that the small circles at the end of the arrow are green (aqua) indicating that both ends of the transition are connected to the appropriate states. Specifically, beware connections that look like this. Instead, they should look as follows :. Try running the model. When you get to the initial model open screen, just press the large button to start the model. Click on the model exploration menu, that currently includes the text root:main. Pull this down. Your screen should look something like the following: Click on the item highlighted above (which reads population[0..99] ). Leaving the view of the model as a whole, you have now drilled down to the level of individuals, see a screen that shows the characteristics for a particular person including their location within the network (shown by a their node and connections), the values associated with their properties (here, the two parameters you have created above). By clicking on the up-and-down arrows to adjust the numbers shown in the upper left corner (just to the upper right the yellow tool tip shown below), you can change the view to show different members of the population. The number itself shows the count of that person in the population. Note that as you proceed to view multiple agents, different

5 agents will be in different states. This reflects the fact that agents get infected only stochastically only according to a rate that yields different time in the Susceptible state prior to infection. Note also that the Console window below contains the infection and recovery status reports of the agents. 12. The above model offers virtues to recommend it, but in this case, the textual status reports from agents are somewhat tedious to read. We can make the visual representation encode the state of individuals in many ways. Here, we explore the use of color to encode the state. One way to pursue this task is through a variable that encodes the appropriate color. This approach is pursued in slides from lectures. Here, we will pursue a different approach to help the reader understand some of the many options that afford themselves for implementing this task. Yet another approach would be to use a data structure, such as an array or a Hashmap. It is arguable as to which of these approaches is simpler, more extensible or easier to understand. a. From the Palette window, add a Function to the model. We can define a function whose job it is to tell us the appropriate color for whatever state is active. b. Set the properties of the function as follows in the Properties window: i. The name of the function should be colorforinfectionstate. ii. Scroll down to row that starts with the text Return Type. Click on the radio button in this row that says Other and in the text field that follows it type Color (without quotation marks) This indicates that the function can return only identities of Colors.
6 iii. Click on the Code tab of the Properties window. The code for the function translates from the identity of the active state in the state chart and turns it into a Color. One way of implementing this code is as follows: switch (infectionstatechart.getactivesimplestate()) { case Susceptible: return GREEN; case Infective: return RED; default: // Recovered return GRAY; } The Switch statement looks at the value given to it (in parentheses), and then tries to match it to one of a set of values (the values given by the case ) statements. If the value given to switch matches one of those cases, the appropriate code below the case statement is executed here, this just returns the appropriate values. If no case statement is matched, the statement executes the code in any default statement. Note: In typing the above, you may wish to use a shortcut to get the Java code editor to fill in suggestions for you. You can do this by pressing Control- Space on a PC (Command-Space on a Mac) after typing the first few characters of a word. The Java editor will then try to propose ways to complete the words being typed. (Note that that it is possible that you will encounter a bug where the editor keeps on suggesting package or public, we would suggest closing and
7 reopening the model.) 13. Having created a way of mapping the current infection state to a color, we can now put the final component in place creation of simple code to make sure that the appropriate color is displayed on the visualization. To accomplish this, click on the oval in the Person canvas. The Properties window will then display the properties for this over. Click on the Dynamic tab in the Properties window. Scroll down (as necessary) to the entry for Fill Color. For this entry, we just need to request that the function we just created give us the appropriate color, based on the Person s current infection state in other words, we just need to call the function. Please insert the following code (without quotes) to call the function to accomplish this: colorforinfectionstate() 14. Run the model. You should see something similar to the following. As we had hoped, the colors characterize the infection state of individuals in the network. 15. To better understand the difference between transition types, we now re-examine the type of the infection transition. Click to select the infection transition within the Person canvas. As is shown in the Properties window, the transition is currently triggered according to a rate of 0.1 yielding a mean time infected of 10 time units, but variability in the particular lengths of time spent in the Susceptible state prior to infection for different individuals. We will now examine the effect of changing this transition so that it is triggered not by a rate, but by a timeout. a. For the Triggered by dropdown, please choose Timeout.
8 b. For the Timeout field, enter a value of 10 (without the quotes). Note that by choosing this value, we are preserve the mean length of time spent in the Susceptible state. However, the degree of variability associated with the two triggering mechanisms are very different. While the Rate is associated with significant variability around the mean (the standard deviation is in fact equal to the mean), the timeout exhibits no variability at all in every case, the duration of time in the Susceptible state will be identical. What do you expect to see if we are to run this model? 16. Run the model. You should see a progression among states through the model. Given the understanding expressed above, does this make sense to you? 17. The model we have created here has some interesting features, but it s not yet a model in which infection spreads between people. Right now, each individual in the model may be connected to others via the network, but there is no interaction between individuals. To simulation infection spread, we need to incorporate such interaction. While there are a number of ways that agents (e.g. Persons) in AnyLogic can interact, our way of realizing this interaction is through exchanging messages. Incorporating messages into the model requires several steps. These are explored below. 18. Click to select the infection transition within the Person canvas. As is shown in the Properties window, the transition is currently a Timeout used for the most recent exploration. We will now change it again so that infection depends on receiving a message. We will establish the logic such that this message is only be sent by an infectious individual. Specifically, in the Triggered by dropdown in the Properties window for the infection transition, select Message. All other settings can retain their current or default values. We note that for simplicity, we have chosen here to represent infection messages as if they inevitably lead to infection. 19. There is one final step required to handle this message properly. The need for this step reflects the fact that while a Person here has just a single statechart ( infectionstatechart ) a given agent (here, Person) may in general have more than one statechart. For example, we could imagine elaborating our model of a Person here with a statechart representing the progression of some other infection or strain of the same infection, of a chronic condition, whether the individual is Pregnant or not, or to represent a behavioural risk factor (e.g. smoking). Just as progression within this statechart is contingent upon reception of a message, we can imagine that progression along the other statecharts could also depend on reception of a different message. There is currently no mechanism for AnyLogic to automagically know by what statechart or what statecharts a given message needs to be handled. In order to complete the handling of an incoming message, we therefore need to route it to the appropriate statechart for the person. This routing needs to be accomplish not at the level of the particular statechart, but for the person as a whole. AnyLogic provides a place for this handling associated with each Agent class. Please click on the Person class within the Project window, so that the properties for the Person class are shown in the Properties window. Click on the Agent tab of the Properties window. This tab shows a set of properties specific to Agents (as opposed to other Active Objects, for example, of which an Agent is just one type). Scroll down as necessary within this tab to find the field entitled On Message
 to itself receive and handle that message.")
9 Received. This is where you will place the code to route message to the appropriate statechart. What code needs to be placed here? In this particular case, when we receive a given message, we need to simply tell the only statechart present ( infectionstatechart ) to itself receive and handle that message. Fortunately, AnyLogic makes this very easy to do. Firstly, notice a lightbulb next to the field. Hovering the mouse over this lightbulb will reveal a tool tip (see below), indicating that the message received by the person at this point (when this handler is triggered) is called msg. We just have to pass this message called msg to the infectionstatechart. We do so with the following code (note the trailing semicolon): infectionstatechart.receivemessage(msg); The resulting properties looks as follows (note also below the tool tip giving the hint about the availability of a variable name for the message and for the sender of the message). Incorporating this code completes what is necessary to handle the message. Please note that in our version of AnyLogic, a shortcut can be used by simply clicking the checkbox next to infectionstatechart in the section entitled Forward message to. However, we are doing that work manually here. While the automatic mechanism can be relied upon for simple models, more complex models (involving multiple statecharts, each associated with different subsets of messages) will in general require the sort of code you have written here (but with logic to determine which message goes where ). 20. Having set the logic handling a person s infection due to exposure to infection another party (realized in the model by reception of an infection message), we nowturn to realize the other side of the process the process in which an infectious person exposes others to their pathogen. Specifically, we realize this exposure process on the part of an infective by having them send a message. This message is only sent when a person is in fact infective that is, when they are present in the infective state. We can implement the sending of this message in a number of ways, but perhaps the simplest is to do so via a transition. Recall that we can associate such a transition with an action to be performed when the transition occurs for example, in the steps above we associated reporting action (printing a message to the Console window) with a transition firing. However, it is worth reflecting that the process by which an infective exposes another individual to infection does not by itself lead the infective to immediately recover

10 from infection. Thus, if we are to implement this message sending process via a transition, it will need to be a special sort of transition a transition that fires, but maintains the person in the same state. Fortunately, AnyLogic does support this sort of self-transition. We now add and configure such a self-transition. a. Please add a self-transition to the Infective state by adding a Transition from the Model tab of the Palette window, and connecting both ends of that transition (i.e. both the origin and destination of the transition) to the Infective state. You can choose your own aesthetic style for such self-transitions, but the figure below shows a common visual representation. b. The properties for this transition must now be set in the Properties window. i. Set the name of the transition to pathogenexposure. (Note that a better name might reflect the fact that this exposure occurs at a level that it is an infecting dose if it is received by a Susceptible individual) ii. As with any other transition, we may wish to have the exposure events within the Infective state occurring according to a timeout (i.e. at regular intervals), as poisson arrivals (i.e. a certain average rate, but where the occurrence in the next small amount of time is independent of the last time exposure occurred), or other variants. In this case, please 1. Set the Triggered by to be a Rate 2. Set the Rate itself to 0.5 i.e. 2 time units on average between exposure events. iii. Recall that the motivation for this transition lies in the action to be performed (after all, the transition does not go between two different states, but instead leads a person to remain in the same state). Here, the action will involve exposing others people to the pathogen. But which other people? Here, we will assume that the individuals at risk of exposure are the next-door neighbours to the infective person within the network in other words, the individuals who are just one connection away from the infective person. The patterns of exposures of these neighbours will differ by pathogen
11 and context. For example, an STI or bloodborne infection would generally only be transmitted to one connected individual at a time that is, each potentially infecting event (e.g. a sexual contact or case of needle sharing) would only infect at most one other individual. By contrast, an airborne infection such as TB or Influenza could in principal be transmitted to multiple people within a single infecting event. Here, we choose to assume that each potentially infecting event only affects a single person at a time. Given this, we need to find a way that this infective could send a message to exactly one neighbour (say, selecting among the possible neighbors with uniform probability) at a time. Fortunately, AnyLogic provides ready support both for exposing a single randomly selected connection at a time and all connections at a time. To send to just one neighbour we use the code fragment: this.send("infection", RANDOM_CONNECTED); Please insert this code (including the trailing semicolon!) in the Action field of the Properties window. Note that when send is called here it tells AnyLogic to deliver a message. The first argument given to send ( Infection ) is just a message; here, we do not pay attention to the contents of that message, so the choice of the message to send is optional. In other models and in future evolutions of this model in other exercises! we may wish to have many different messages, so it s nice to stick to a consistent naming. The second argument tells AnyLogic to what particular Agent (Person) or set of persons the message should be sent. Here, RANDOM_CONNECTED indicates to AnyLogic that it should select a neighbour selected with equal probability. (Note that sending to all neighbours would be accomplished in a similar fashion, but would replace RANDOM_CONNECTED by ALL_CONNECTED. Other options are also available) The model should then look as follows:

12 21. There is just one step remaining before our infection model is ready to simulate outbreaks of infection. Right now, infection can spread from one person to others. However, that infection won t spread unless it is already carried by somebody. To start an epidemic, we need some way of seeding the infection of introducing the very first infectious person into a model. There are many ways we might think to seed an infection in the model. For example, models with an open population might have some immigrants arriving who are already ill. In some cases (e.g. prion based illnesses or zoonoses), a person might pick up an infection from the broader environmental reservoirs that happen to be excluded from the model. Here, we will simply infect one person randomly selected from the population with equal likelihood at the inception of the simulation. Once again, AnyLogic makes this process quite easy. We accomplish by telling the environment to deliver a message here, the same Infection message that we sent to spread the infection to a randomly selected person in the population. Because the population of people is known about by the environment, the environment can take care of this task. To accomplish this, click on the Main class in the Project window. In the (default) General tab, there is a field entitled Startup Code. Please enter environment.delivertorandom("infection");
13 The resulting model looks as follows: 22. The above steps have having handled the mechanics of message reception, message sending, and the initial seeding of infection in the population. All we have to do now is to run the model! Over time, the infection will spread within the connected components of the network (see below).
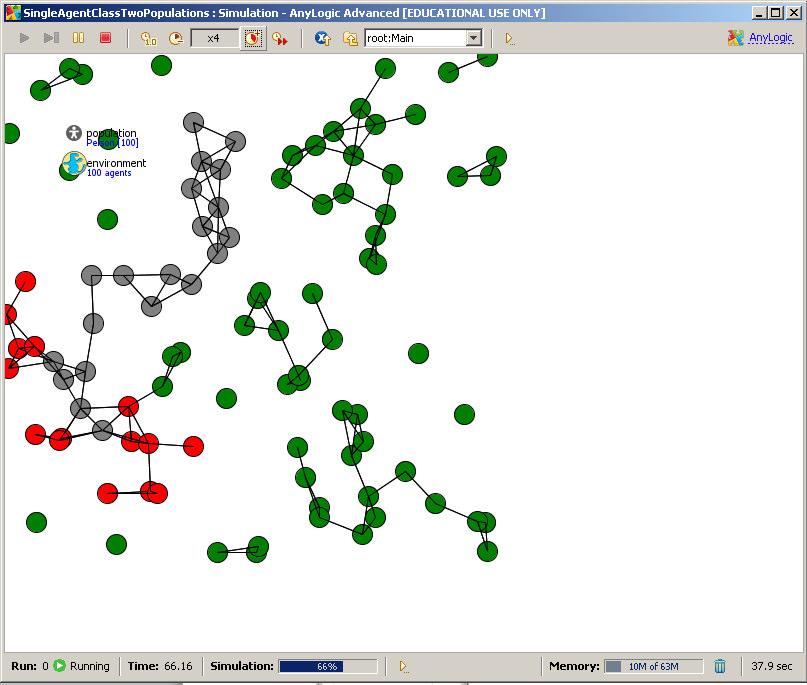
14
AGENT-BASED MODELING BOOTCAMP FOR HEALTH RESEARCHERS AUGUST 2012 CREATING A HETEROGENEOUS POPULATION
 Rating: Basic Prerequisites: Building a Minimalist Network-Based Model Framework Estimated Time Required: 1 hour This exercise shows one simple way to create a population that is heterogeneous in terms
Events in AnyLogic. Nathaniel Osgood MIT
 Events in AnyLogic Nathaniel Osgood MIT 15.879 March 14, 2012 Events & Scheduling in AnyLogic Reminder: In simulating stock & flow models, time advances in steps Euler integration: Fixed-sized Steps Runga-Kutta:
Exercise Rating: Intermediate
 Rating: Intermediate Prerequisites: Building a Minimalist Network-Based Model Framework Estimated Time Required: 1 hour 1) Save SIR Agent Based Calibration to Extended SIR Agent Based Calibration. 2) Try
Interface. 2. Interface Adobe InDesign CS2 H O T
 2. Interface Adobe InDesign CS2 H O T 2 Interface The Welcome Screen Interface Overview The Toolbox Toolbox Fly-Out Menus InDesign Palettes Collapsing and Grouping Palettes Moving and Resizing Docked or
Guide- Using GLEAMviz
 Guide- Using GLEAMviz Introduction At first glance, the GLEAMviz program may seem a bit daunting for the first-time user. This guide is meant to help you through the process of installation and set-up
CHAPTER 1 COPYRIGHTED MATERIAL. Finding Your Way in the Inventor Interface
 CHAPTER 1 Finding Your Way in the Inventor Interface COPYRIGHTED MATERIAL Understanding Inventor s interface behavior Opening existing files Creating new files Modifying the look and feel of Inventor Managing
How to Make Graphs with Excel 2007
 Appendix A How to Make Graphs with Excel 2007 A.1 Introduction This is a quick-and-dirty tutorial to teach you the basics of graph creation and formatting in Microsoft Excel. Many of the tasks that you
Specifying Agent Properties. Nathaniel Osgood MIT
 Specifying Agent Properties Nathaniel Osgood MIT 15.879 March 7, 2012 Avoiding a Common Mistake AnyLogic projects typically contain a variety of classes The AnyLogic interface for accessing these classes
Lesson 1: Creating and formatting an Answers analysis
 Lesson 1: Creating and formatting an Answers analysis Answers is the ad-hoc query environment in the OBIEE suite. It is in Answers that you create and format analyses to help analyze business results.
Using Flash Animation Basics
 Using Flash Contents Using Flash... 1 Animation Basics... 1 Exercise 1. Creating a Symbol... 2 Exercise 2. Working with Layers... 4 Exercise 3. Using the Timeline... 6 Exercise 4. Previewing an animation...
Laboratory 1: Eclipse and Karel the Robot
 Math 121: Introduction to Computing Handout #2 Laboratory 1: Eclipse and Karel the Robot Your first laboratory task is to use the Eclipse IDE framework ( integrated development environment, and the d also
Agent Based Modeling Tutorial
 Agent Based Modeling Tutorial Copyright 1992-2007 XJ Technologies. All rights reserved. XJ Technologies Company Ltd AnyLogic@xjtek.com http://www.xjtek.com/anylogic 2 1992-2007 XJ Technologies http://www.xjtek.com
CommonLook Office GlobalAccess Quick Start Guide using Microsoft PowerPoint
 CommonLook Office GlobalAccess Quick Start Guide using Microsoft PowerPoint Welcome to the NetCentric Technologies CommonLook Office GlobalAccess Quick Start Guide. This tutorial is intended to help users
Shopping Cart: Queries, Personalizations, Filters, and Settings
 Shopping Cart: Queries, Personalizations, Filters, and Settings on the Shopping Cart Home Page Use this Job Aid to: Learn how to organize the Shopping Cart home page so that it is easier to use. BEFORE
6.001 Notes: Section 15.1
 6.001 Notes: Section 15.1 Slide 15.1.1 Our goal over the next few lectures is to build an interpreter, which in a very basic sense is the ultimate in programming, since doing so will allow us to define
EXCEL BASICS: MICROSOFT OFFICE 2007
 EXCEL BASICS: MICROSOFT OFFICE 2007 GETTING STARTED PAGE 02 Prerequisites What You Will Learn USING MICROSOFT EXCEL PAGE 03 Opening Microsoft Excel Microsoft Excel Features Keyboard Review Pointer Shapes
DOING MORE WITH EXCEL: MICROSOFT OFFICE 2013
 DOING MORE WITH EXCEL: MICROSOFT OFFICE 2013 GETTING STARTED PAGE 02 Prerequisites What You Will Learn MORE TASKS IN MICROSOFT EXCEL PAGE 03 Cutting, Copying, and Pasting Data Basic Formulas Filling Data
Epidemic spreading on networks
 Epidemic spreading on networks Due date: Sunday October 25th, 2015, at 23:59. Always show all the steps which you made to arrive at your solution. Make sure you answer all parts of each question. Always
Importing source database objects from a database
 Importing source database objects from a database We are now at the point where we can finally import our source database objects, source database objects. We ll walk through the process of importing from
Project and Production Management Prof. Arun Kanda Department of Mechanical Engineering Indian Institute of Technology, Delhi
 Project and Production Management Prof. Arun Kanda Department of Mechanical Engineering Indian Institute of Technology, Delhi Lecture - 8 Consistency and Redundancy in Project networks In today s lecture
Exercise 1.1 A First NetLogo Session Turtle commands and properties
 Exercise 1.1 A First NetLogo Session NetLogo is an interpreted language meaning you can type commands directly into a command line and see the results. In order to introduce NetLogo we will first type
DOING MORE WITH EXCEL: MICROSOFT OFFICE 2010
 DOING MORE WITH EXCEL: MICROSOFT OFFICE 2010 GETTING STARTED PAGE 02 Prerequisites What You Will Learn MORE TASKS IN MICROSOFT EXCEL PAGE 03 Cutting, Copying, and Pasting Data Filling Data Across Columns
UAccess ANALYTICS Next Steps: Working with Bins, Groups, and Calculated Items: Combining Data Your Way
 UAccess ANALYTICS Next Steps: Working with Bins, Groups, and Calculated Items: Arizona Board of Regents, 2014 THE UNIVERSITY OF ARIZONA created 02.07.2014 v.1.00 For information and permission to use our
Understanding the Interface
 2. Understanding the Interface Adobe Photoshop CS2 for the Web H O T 2 Understanding the Interface The Welcome Screen Interface Overview Customizing Palette Locations Saving Custom Palette Locations Customizing
Chapter 10 Working with Graphs and Charts
 Chapter 10: Working with Graphs and Charts 163 Chapter 10 Working with Graphs and Charts Most people understand information better when presented as a graph or chart than when they look at the raw data.
Ontario Cancer Profiles User Help File
 Ontario Cancer Profiles User Help File Contents Introduction... 2 Module 1 Tool Overview and Layout... 3 Overview of the tool... 3 Highlights vs. selections... 6 Data suppression or unreliable estimates...
Create a Flowchart in PowerPoint
 Create a Flowchart in PowerPoint A flowchart is a diagram of steps, movements or actions involved in a system or activity. Flowcharts use conventional geometric symbols and arrows to define relationships
Excel Basics Rice Digital Media Commons Guide Written for Microsoft Excel 2010 Windows Edition by Eric Miller
 Excel Basics Rice Digital Media Commons Guide Written for Microsoft Excel 2010 Windows Edition by Eric Miller Table of Contents Introduction!... 1 Part 1: Entering Data!... 2 1.a: Typing!... 2 1.b: Editing
You can also search online templates which can be picked based on background themes or based on content needs. Page eleven will explain more.
 Microsoft PowerPoint 2016 Part 1: The Basics Opening PowerPoint Double click on the PowerPoint icon on the desktop. When you first open PowerPoint you will see a list of new presentation themes. You can
Laboratory 5: Collaborative Text Editing
 COMP3511/9511 Lab, Week 12-13, S2 2004 Laboratory 5: Collaborative Text Editing Time Allocated: 30 minutes As we discussed in lectures, the opportunities for creating new forms of collaboration using networking
Using Microsoft Word. Working With Objects
 Using Microsoft Word Many Word documents will require elements that were created in programs other than Word, such as the picture to the right. Nontext elements in a document are referred to as Objects
Collecting, Outputting & Inputting Data in AnyLogic
 Collecting, Outputting & Inputting Data in AnyLogic Nathaniel Osgood Using Modeling to Prepare for Changing Healthcare Needs Duke-NUS April 16, 2014 Recording of Results A frequent modeler need is to record
Code::Blocks Student Manual
 Code::Blocks Student Manual Lawrence Goetz, Network Administrator Yedidyah Langsam, Professor and Theodore Raphan, Distinguished Professor Dept. of Computer and Information Science Brooklyn College of
EXCEL BASICS: MICROSOFT OFFICE 2010
 EXCEL BASICS: MICROSOFT OFFICE 2010 GETTING STARTED PAGE 02 Prerequisites What You Will Learn USING MICROSOFT EXCEL PAGE 03 Opening Microsoft Excel Microsoft Excel Features Keyboard Review Pointer Shapes
HeroBase Administrator Training Guide 101
 HeroBase Administrator Training Guide 101 Contents Introduction... 3 Preconditions... 3 What is a campaign?... 3 What is a Project?... 3 How does Campaign Templates relate to Campaigns?... 4 What is Lead
PowerPoint Basics: Create a Photo Slide Show
 PowerPoint Basics: Create a Photo Slide Show P 570 / 1 Here s an Enjoyable Way to Learn How to Use Microsoft PowerPoint Microsoft PowerPoint is a program included with all versions of Microsoft Office.
On the Web sun.com/aboutsun/comm_invest STAROFFICE 8 DRAW
 STAROFFICE 8 DRAW Graphics They say a picture is worth a thousand words. Pictures are often used along with our words for good reason. They help communicate our thoughts. They give extra information that
What is DealBook WEB?
 What is DealBook WEB? DealBook WEB helps you trade quickly from anywhere you can connect to the Internet. A browser-based application, DealBook WEB provides a simple platform for beginning traders as well
Using Microsoft Excel
 About Excel Using Microsoft Excel What is a Spreadsheet? Microsoft Excel is a program that s used for creating spreadsheets. So what is a spreadsheet? Before personal computers were common, spreadsheet
Adding Fillet, Shell, and Draft Features
 Learn how to: Adding Fillet, Shell, and Draft Features I-DEAS Tutorials: Fundamental Skills add draft features add fillet features use the Ball Corner Fillet option add shell features Before you begin...
Lab 8-1 Lab Multiple Form Types - Setup
 In the following lab instructions, you are going to add a second form type and learn to set up automatic form identification. In addition, you ll be introduced to registration zones and index group zones.
Clip Art and Graphics. Inserting Clip Art. Inserting Other Graphics. Creating Your Own Shapes. Formatting the Shape
 1 of 1 Clip Art and Graphics Inserting Clip Art Click where you want the picture to go (you can change its position later.) From the Insert tab, find the Illustrations Area and click on the Clip Art button
Code::Blocks Student Manual
 Code::Blocks Student Manual Lawrence Goetz, Network Administrator Yedidyah Langsam, Professor and Theodore Raphan, Distinguished Professor Dept. of Computer and Information Science Brooklyn College of
Analyzing PDFs with Citavi 6
 Analyzing PDFs with Citavi 6 Introduction Just Like on Paper... 2 Methods in Detail Highlight Only (Yellow)... 3 Highlighting with a Main Idea (Red)... 4 Adding Direct Quotations (Blue)... 5 Adding Indirect
Lastly, in case you don t already know this, and don t have Excel on your computers, you can get it for free through IT s website under software.
 Welcome to Basic Excel, presented by STEM Gateway as part of the Essential Academic Skills Enhancement, or EASE, workshop series. Before we begin, I want to make sure we are clear that this is by no means
TABLE OF CONTENTS TABLE OF CONTENTS... 1 INTRODUCTION... 3 BREAK... 4 DEFINITIONS... 4 STEP BY STEP- SECTION BREAK... 6 PAGE NUMBERS...
 TABLE OF CONTENTS TABLE OF CONTENTS... 1 INTRODUCTION... 3 BREAK... 4 DEFINITIONS... 4 WHY WOULD YOU USE THIS?... 4 STEP BY STEP- PAGE BREAK... 4 ALTERNATIVE METHODS... 5 STEP BY STEP- SECTION BREAK...
Chapter 2 The SAS Environment
 Chapter 2 The SAS Environment Abstract In this chapter, we begin to become familiar with the basic SAS working environment. We introduce the basic 3-screen layout, how to navigate the SAS Explorer window,
Smoother Graphics Taking Control of Painting the Screen
 It is very likely that by now you ve tried something that made your game run rather slow. Perhaps you tried to use an image with a transparent background, or had a gazillion objects moving on the window
Excel Basics: Working with Spreadsheets
 Excel Basics: Working with Spreadsheets E 890 / 1 Unravel the Mysteries of Cells, Rows, Ranges, Formulas and More Spreadsheets are all about numbers: they help us keep track of figures and make calculations.
Math 1505G, 2013 Graphs and Matrices
 Math 505G, 0 Graphs and Matrices September 7, 0 These are some notes for the short talk I gave the other day. We ll discuss an interesting application of matrix algebra. This is outside what will be tested
DecisionPoint For Excel
 DecisionPoint For Excel Getting Started Guide 2015 Antivia Group Ltd Notation used in this workbook Indicates where you need to click with your mouse Indicates a drag and drop path State >= N Indicates
Strategic Series-7001 Introduction to Custom Screens Version 9.0
 Strategic Series-7001 Introduction to Custom Screens Version 9.0 Information in this document is subject to change without notice and does not represent a commitment on the part of Technical Difference,
Getting started with your
 Getting started with your Connecting your Silhouette Portrait 1 Check Included Items The Silhouette Portrait comes with the items shown in the following list. Check that all the items have been included
Keynote 08 Basics Website:
 Website: http://etc.usf.edu/te/ Keynote is Apple's presentation application. Keynote is installed as part of the iwork suite, which also includes the word processing program Pages and the spreadsheet program
Xton Access Manager GETTING STARTED GUIDE
 Xton Access Manager GETTING STARTED GUIDE XTON TECHNOLOGIES, LLC PHILADELPHIA Copyright 2017. Xton Technologies LLC. Contents Introduction... 2 Technical Support... 2 What is Xton Access Manager?... 3
Animations that make decisions
 Chapter 17 Animations that make decisions 17.1 String decisions Worked Exercise 17.1.1 Develop an animation of a simple traffic light. It should initially show a green disk; after 5 seconds, it should
Jerry Cain Handout #5 CS 106AJ September 30, Using JSKarel
 Jerry Cain Handout #5 CS 106AJ September 30, 2017 Using JSKarel This handout describes how to download and run the JavaScript version of Karel that we ll be using for our first assignment. 1. Getting started
Top Producer 7i Tips & Tricks Volume 1
 Top Producer 7i Tips & Tricks Volume 1 TOP PRODUCER Systems Inc. 1 Table of Contents 1 Using Quick Action Commands...3 1.1 Use the Commands Instead of the Menu s...3 2 Scrolling Within a Long List...5
MAXQDA and Chapter 9 Coding Schemes
 MAXQDA and Chapter 9 Coding Schemes Chapter 9 discusses how the structures of coding schemes, alternate groupings are key to moving forward with analysis. The nature and structures of the coding scheme
Function. Description
 Function Check In Get / Checkout Description Checking in a file uploads the file from the user s hard drive into the vault and creates a new file version with any changes to the file that have been saved.
Meltem Özturan
 Meltem Özturan www.mis.boun.edu.tr/ozturan/samd 1 2 Modeling System Requirements Object Oriented Approach to Requirements OOA considers an IS as a set of objects that work together to carry out the function.
Your First Windows Form
 Your First Windows Form From now on, we re going to be creating Windows Forms Applications, rather than Console Applications. Windows Forms Applications make use of something called a Form. The Form is
Instructor Info: Dave Tucker, LSSMBB ProModel Senior Consultant Office:
 This course is intended for previous Users of Process Simulator who have completed Basic Training but may not have used the software for a while. Our hope is that this training will help these Users brush
User Guide. Contents. NAFSA Adviser s Manual 360 User Guide Page 1
 User Guide Contents Getting Started... 2 The Adviser s Manual Launch Page on the NAFSA Website... 4 Opening the Manual... 5 Open the Manual from the Adviser s Manual home page on the NAFSA website... 5
Chapter 20 Troubleshooter
 Chapter 20 Troubleshooter Once you have been using the Home Control Assistant for a while, you will probably want to look at the Troubleshooter. The Troubleshooter is a set of several tools you can use
Create a Project in AISAP
 Before Starting: You need an AISAP account with a username and password. Exercise Goal: Learn how to create a project, search the AISAP library for existing data, add data to a project, and filter your
CS Multimedia and Communications REMEMBER TO BRING YOUR MEMORY STICK TO EVERY LAB! Lab 02: Introduction to Photoshop Part 1
 CS 1033 Multimedia and Communications REMEMBER TO BRING YOUR MEMORY STICK TO EVERY LAB! Lab 02: Introduction to Photoshop Part 1 Upon completion of this lab, you should be able to: Open, create new, save
Extensible scriptlet-driven tool to manipulate, or do work based on, files and file metadata (fields)
") 1. MCUtils This package contains a suite of scripts for acquiring and manipulating MC metadata, and for performing various actions. The available scripts are listed below. The scripts are written in Perl
1. MCUtils This package contains a suite of scripts for acquiring and manipulating MC metadata, and for performing various actions. The available scripts are listed below. The scripts are written in Perl
Tabbing Between Fields and Control Elements
 Note: This discussion is based on MacOS, 10.12.6 (Sierra). Some illustrations may differ when using other versions of macos or OS X. The capability and features of the Mac have grown considerably over
Creating an ArborCAD filter from Excel.
 ArborCAD Help File Windows systems only Creating an ArborCAD filter from Excel. This help file assumes you have your tree survey data in an Excel sheet. The ArborCAD filter is a special file which holds
This is being done to address the issues of privacy, security and convenience as it relates to your University of Alberta account.
 EDIT202 Web 2.0 Lab Assignment Guidelines Creating a Blog 1. Before you can start creating your blog you will need to create a new Google account which you will be used to register for the resources used
Learning Objectives. Description. Your AU Expert(s) Trent Earley Behlen Mfg. Co. Shane Wemhoff Behlen Mfg. Co.
 Trent Earley Behlen Mfg. Co. Shane Wemhoff Behlen Mfg. Co.") PL17257 JavaScript and PLM: Empowering the User Trent Earley Behlen Mfg. Co. Shane Wemhoff Behlen Mfg. Co. Learning Objectives Using items and setting data in a Workspace Setting Data in Related Workspaces
PL17257 JavaScript and PLM: Empowering the User Trent Earley Behlen Mfg. Co. Shane Wemhoff Behlen Mfg. Co. Learning Objectives Using items and setting data in a Workspace Setting Data in Related Workspaces
Using Excel This is only a brief overview that highlights some of the useful points in a spreadsheet program.
 Using Excel 2007 This is only a brief overview that highlights some of the useful points in a spreadsheet program. 1. Input of data - Generally you should attempt to put the independent variable on the
GuruFocus User Manual: The FilingWiz
 GuruFocus User Manual: The FilingWiz Contents 0. Introduction to FilingWiz a. Brief overview b. Access 1. The Search Query Toolbox 2. The Search Results Column 3. The Highlights Column a. Highlights tab
A Guided Tour Through the SAS Windowing Environment Casey Cantrell, Clarion Consulting, Los Angeles, CA
 A Guided Tour Through the SAS Windowing Environment Casey Cantrell, Clarion Consulting, Los Angeles, CA ABSTRACT The SAS system running in the Microsoft Windows environment contains a multitude of tools
Introduction to Microsoft Publisher
 Class Description This is an introduction to Microsoft Publisher, with a focus on choosing a template and modifying it to meet your needs. Class Length One and one half (1½) hours Introduction to Microsoft
Warewolf User Guide 1: Introduction and Basic Concepts
 Warewolf User Guide 1: Introduction and Basic Concepts Contents: An Introduction to Warewolf Preparation for the Course Welcome to Warewolf Studio Create your first Microservice Exercise 1 Using the Explorer
Logi Ad Hoc Reporting System Administration Guide
 Logi Ad Hoc Reporting System Administration Guide Version 10.3 Last Updated: August 2012 Page 2 Table of Contents INTRODUCTION... 4 Target Audience... 4 Application Architecture... 5 Document Overview...
WPI Project Center WordPress Manual For Editors
 WPI Project Center WordPress Manual For Editors April 17, 2015 Table of Contents Who should use this manual... 3 Signing into WordPress... 3 The WordPress Dashboard and Left-Hand Navigation Menu... 4 Adding
Tech Tip of the Month The Ins and Outs of the Solar Fire Page Designer
 Tech Tip of the Month The Ins and Outs of the Solar Fire Page Designer Solar Fire 5 s Page Designer is a major factor in making this program one of the most flexible and customizable pieces of software
Word 2003: Flowcharts Learning guide
 Word 2003: Flowcharts Learning guide How can I use a flowchart? As you plan a project or consider a new procedure in your department, a good diagram can help you determine whether the project or procedure
Teach Yourself Microsoft PowerPoint Topic 4: Slide Master, Comments and Save Options
 Teach Yourself Microsoft PowerPoint Topic 4: Slide Master, Comments and Save Options http://www.gerrykruyer.com This week you will work with slide masters, add comments, find out how to save your presentations
Click the buttons in the interactive below to become familiar with the drawing tool's commands.
 Google Documents Inserting Text Boxes and Shapes Introduction Page 1 Google Documents has a drawing tool designed for inserting text boxes and shapes into your document. Although not necessary for every
Guides. Tutorial: A Node-RED dashboard using node-re... dashboard. What is Node RED? 1 of 9 7/29/17, 9:27 AM
 Guides Tutorial: A Node-RED dashboard using node-reddashboard by SENSE TECNIC SYSTEMS on MAY 16, 2016 with 4 COMMENTS This is a simple example of reading and visualizing data using the new UI nodes from
EXCEL + POWERPOINT. Analyzing, Visualizing, and Presenting Data-Rich Insights to Any Audience KNACK TRAINING
 EXCEL + POWERPOINT Analyzing, Visualizing, and Presenting Data-Rich Insights to Any Audience KNACK TRAINING KEYBOARD SHORTCUTS NAVIGATION & SELECTION SHORTCUTS 3 EDITING SHORTCUTS 3 SUMMARIES PIVOT TABLES
Introduction to Microsoft Word
 Chapter Microsoft Word is a powerful word processing program that allows you to enter text, make changes to it, format it, record and print it. You can use it to produce professional business letters,
ActiveBPEL Fundamentals
 Unit 22: Simulation ActiveBPEL Fundamentals This is Unit #22 of the BPEL Fundamentals course. In past Units we ve looked at ActiveBPEL Designer, Workspaces and Projects, created the Process itself and
CREATING CONTENT WITH MICROSOFT POWERPOINT
 CREATING CONTENT WITH MICROSOFT POWERPOINT Simple Tips And Tricks Presented by TABLE OF CONTENTS Introduction... 2 Design Tips... 3 Advanced Tips... 4 ShortCut Keys for Microsoft PowerPoint... 5 How-Tos...
COPYRIGHTED MATERIAL. Getting Started with Google Analytics. P a r t
 P a r t I Getting Started with Google Analytics As analytics applications go, Google Analytics is probably the easiest (or at least one of the easiest) available in the market today. But don t let the
Quick Tips to Using I-DEAS. Learn about:
 Learn about: Quick Tips to Using I-DEAS I-DEAS Tutorials: Fundamental Skills windows mouse buttons applications and tasks menus icons part modeling viewing selecting data management using the online tutorials
Introduction to Programming in C Department of Computer Science and Engineering. Lecture No. #17. Loops: Break Statement
 Introduction to Programming in C Department of Computer Science and Engineering Lecture No. #17 Loops: Break Statement (Refer Slide Time: 00:07) In this session we will see one more feature that is present
USING DRUPAL. Hampshire College Website Editors Guide https://drupal.hampshire.edu
 USING DRUPAL Hampshire College Website Editors Guide 2014 https://drupal.hampshire.edu Asha Kinney Hampshire College Information Technology - 2014 HOW TO GET HELP Your best bet is ALWAYS going to be to
The tracing tool in SQL-Hero tries to deal with the following weaknesses found in the out-of-the-box SQL Profiler tool:
 Revision Description 7/21/2010 Original SQL-Hero Tracing Introduction Let s start by asking why you might want to do SQL tracing in the first place. As it turns out, this can be an extremely useful activity
Editing Documents on Your Mac (Part 1 of 3) Review
 Review") Note: This discussion is based on MacOS, 10.2.2 (Sierra). Some illustrations may differ when using other versions of Mac OS or OS X. Whether it s an email message or an article for a newsletter, we all
Note: This discussion is based on MacOS, 10.2.2 (Sierra). Some illustrations may differ when using other versions of Mac OS or OS X. Whether it s an email message or an article for a newsletter, we all
FILE ORGANIZATION. GETTING STARTED PAGE 02 Prerequisites What You Will Learn
 FILE ORGANIZATION GETTING STARTED PAGE 02 Prerequisites What You Will Learn PRINCIPLES OF FILE ORGANIZATION PAGE 03 Organization Trees Creating Categories FILES AND FOLDERS PAGE 05 Creating Folders Saving
1 Introduction to Using Excel Spreadsheets
 Survey of Math: Excel Spreadsheet Guide (for Excel 2007) Page 1 of 6 1 Introduction to Using Excel Spreadsheets This section of the guide is based on the file (a faux grade sheet created for messing with)
APPLICATION DEVELOPMENT CHALLENGE
 APPLICATION DEVELOPMENT CHALLENGE 19-22 June 2017 POWERFUL PROTOTYPES, WITHOUT CODING Create simple click-through diagrams or highly functional, rich prototypes with conditional logic, dynamic content,
IS751 Creating Effective Presentations With PowerPoint 2010
 IS Creating Effective Presentations With PowerPoint 00 October 0 Royal Holloway IT Department Page 0 IS Creating Effective Presentations & Watsonia Publishing with PowerPoint 00 th October 0 Table of Contents
MicroStation Design Files
 MicroStation Design Files Module Overview This module discusses aspects of working with design files. Module Prerequisites Knowledge of MicroStation s interface Some knowledge about MicroStation design
Designed by Jason Wagner, Course Web Programmer, Office of e-learning NOTE ABOUT CELL REFERENCES IN THIS DOCUMENT... 1
 Excel Essentials Designed by Jason Wagner, Course Web Programmer, Office of e-learning NOTE ABOUT CELL REFERENCES IN THIS DOCUMENT... 1 FREQUENTLY USED KEYBOARD SHORTCUTS... 1 FORMATTING CELLS WITH PRESET