Data Visualization 101: trends, skillset and tools
|
|
|
- Arlene Davis
- 5 years ago
- Views:
Transcription


1 Partha Padmanabhan Solutions Architect, Cisco Data Visualization 101: trends, skillset and tools
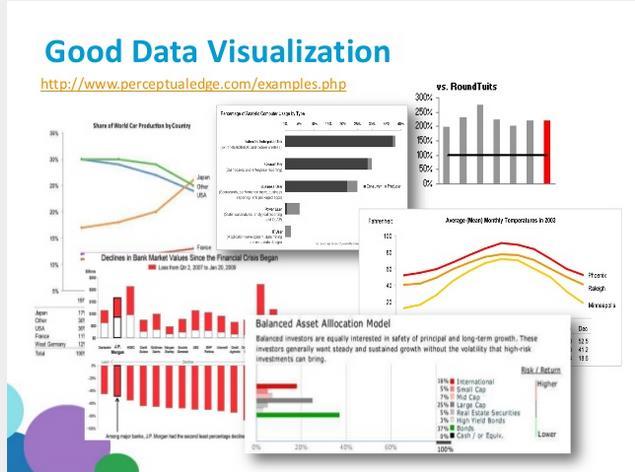
2 A good Data Visualization is something that provides capability of envisioning the Information and Visual Explanations


3
4 What is Data Visualization? Data visualization is the presentation of data in a pictorial or graphical format. It is also viewed as a modern equipment of visual communication
5 Why Data Visualization? As the access to the growing amount of data increases, data visualization is becoming necessary and important. There are two basic types of data visualization: Exploration: Helps find a story the data tells you. Explanation: Tells a story to the audience. Both types of data visualization must take into account the audience s expectations. Within these two basic categories, there are many different ways data can be made visual.
6 Challenges of Data Visualization Analytical tools and data visualization tools have evolved supporting complex, interactive visualizations and handling complex data. There is no technology barrier for advanced visualization applications. More than the challenges with Data Visualizations and the applications, the challenges lies with the end user that gets caught up with the visuals and forgets the business requirements.
7 Pain points with Data Visualization: - Data Over Simplification: Taking huge amount of data and trying to simplify the visualization with handful of pictorial representations Simple Vs. Complex Simple : Calculating a KPI ( Net Profit) reliability based on the inputs. Complex: Alcohol Intoxication Tests Either the results can be unreliable or completely inaccurate - Human Limitations: - While there is no limit for human imagination on handling a visualization problem, the algorithms created in handling the data can be flawed. - Visual Reliability: - This is an issue for the consumers of the data/visualization than the developers. - Visualization leads to interpretation of data - The conclusion from the visualizations may be general and not specific to a metric. - Visualization Inevitable: - With multiple visualizations tools in the market along with the Self-Service capabilities and algorithm based visualizations, the addiction of visualization too much to ever fade.
8 Gartner s Magic Quadrant 2017
9
10 One of the first companies to present data in visual format. Tableau provides various capabilities of visualizing the data along with in-memory capabilities. Depending on the volume and frequency of the being refreshed, Tableau provides the capability of visualizing the data in Live-Connect & Extract features. Data-blending is one of the unique features of Tableau that enables the users to visualize non-related Datasets with one or more matching data attributes. - Supports connection to number of data sources

11 Power BI is a business analytics service provided by Microsoft. It provides interactive visualizations with self-service business intelligence capabilities, where end users can create reports and dashboards by themselves, without having to depend on information technology staff or database administrators

12 The Qlik data analytics platform offers powerful self-service visualization, guided and embedded analytics and reporting capabilities

13 TIBCO Spotfire is a smart, secure, governed, enterprise-class analytics platform with built-in data wrangling that delivers AI-driven, visual, geo, and streaming analytics.
14 Unleash the power of your big data with MicroStrategy data analytics and visualization tools. Easy-to-use data dashboards fed from 70+ data sources.
15 D3.js is a JavaScript library for producing dynamic, interactive data visualizations in web browsers. It makes use of the widely implemented SVG, HTML5, and CSS standards. It is the successor to the earlier Protovis framework
16 Visualization Best Practices

17 Visualization of a Pie Chart ( 3D)

18
19
20 Demo
21 Entry point for a SW professional into Data Visualization If you are a business analyst or a data analyst If you are well versed with creating graphs with excel If you know how to use.js(javascript) and ready to explore weird and cool data visualizations

22
MicroStrategy Desktop Quick Start Guide
 MicroStrategy Desktop Quick Start Guide Version: 10.4 10.4, December 2017 Copyright 2017 by MicroStrategy Incorporated. All rights reserved. Trademark Information The following are either trademarks or
Classroom Course Description. Course Outline. Tableau Intermediate & Advance. Audience
 Classroom Course Description Tableau Intermediate & Advance Audience Tableau Fundamentals & Advance serves the beginner to intermediate Tableau user, targeted towards anyone who works with data regardless
Spotfire and Tableau Positioning. Summary
 Licensed for distribution Summary So how do the products compare? In a nutshell Spotfire is the more sophisticated and better performing visual analytics platform, and this would be true of comparisons
JAVASCRIPT CHARTING. Scaling for the Enterprise with Metric Insights Copyright Metric insights, Inc.
 JAVASCRIPT CHARTING Scaling for the Enterprise with Metric Insights 2013 Copyright Metric insights, Inc. A REVOLUTION IS HAPPENING... 3! Challenges... 3! Borrowing From The Enterprise BI Stack... 4! Visualization
MicroStrategy Desktop
 MicroStrategy Desktop Quick Start Guide MicroStrategy Desktop is designed to enable business professionals like you to explore data, simply and without needing direct support from IT. 1 Import data from
Creating Dashboards That Work Learning Web Analytics
 Creating Dashboards That Work 103 - Learning Web Analytics The way we present collected data has a huge impact on our ability to draw meaning from it. There are nearly as many pieces of digital information
RSDs vs Dossiers Best Practices on When and Where to use them
 RSDs vs Dossiers Best Practices on When and Where to use them Matthew Hannagan, Principal Consultant, United Kingdom Copyright 2017 MicroStrategy Incorporated. All Rights Reserved. Safe Harbor Notice This
Designing Reports in Power BI Desktop using Bookmarks and Drillthrough
 Designing Reports in Power BI Desktop using Bookmarks and Drillthrough Download Slides & PBIX Files from GitHub https://github.com/criticalpathtraining/bookmarks Critical Path Training https://www.criticalpathtrainig.com
Microsoft Power BI for O365
 Microsoft Power BI for O365 Next hour.. o o o o o o o o Power BI for O365 Data Discovery Data Analysis Data Visualization & Power Maps Natural Language Search (Q&A) Power BI Site Data Management Self Service
Analytics: measuring web site success. MBA 563 Week 3
 Analytics: measuring web site success MBA 563 Week 3 You can t manage what you can t measure (Bob Napier, ex CIO, Hewlett Packard) FOCUS ON WEBSITE ANALYTICS Website Analytics Onsite analytics Web site
Potential issues: * Difficulty in coding and/or finding the. * Should I provide more source code? * Others
 Assignment III Potential issues: * Division of the work within the team? * Difficulty in coding and/or finding the network data? * Should I provide more source code? * Others 1 InfoVis Software Toolkit
MicroStrategy Academic Program
 MicroStrategy Academic Program Creating a center of excellence for enterprise analytics and mobility. DATA PREPARATION: HOW TO WRANGLE, ENRICH, AND PROFILE DATA APPROXIMATE TIME NEEDED: 1 HOUR TABLE OF
!Best Visual Storytelling with D3: An Introduction to Data Visualization in. JavaScript (Addison-Wesley Data and Analytics) PDF
 PDF") !Best Visual Storytelling with D3: An Introduction to Data Visualization in JavaScript (Addison-Wesley Data and Analytics) PDF!Best Visual Storytelling with D3: An Introduction to Data Visualization in
!Best Visual Storytelling with D3: An Introduction to Data Visualization in JavaScript (Addison-Wesley Data and Analytics) PDF!Best Visual Storytelling with D3: An Introduction to Data Visualization in
MicroStrategy Analytics Desktop
 MicroStrategy Analytics Desktop Quick Start Guide MicroStrategy Analytics Desktop is designed to enable business professionals like you to explore data, simply and without needing direct support from IT.
Displaying ndtv Graphics in Spotfire using TERR and JSViz
 Displaying ndtv Graphics in Spotfire using TERR and JSViz Introduction The R package ndtv provides a quick and simple means to create compelling interactive graphics. The following R Code: library(ndtv)
MicroStrategy Desktop Quick Start Guide
 MicroStrategy Desktop Quick Start Guide Version: 10.4 10.4, June 2017 Copyright 2017 by MicroStrategy Incorporated. All rights reserved. If you have not executed a written or electronic agreement with
Spotfire and Qlik Sense Positioning. Summary
 Licensed for distribution Summary TIBCO Spotfire and Qlik Sense are two of the most prominent offerings in a new generation of business intelligence platforms. They both major on data visualization, exploration
Qlik Sense Desktop. Data, Discovery, Collaboration in minutes. Qlik Sense Desktop. Qlik Associative Model. Get Started for Free
 Qlik Sense Desktop Data, Discovery, Collaboration in minutes With Qlik Sense Desktop making business decisions becomes faster, easier, and more collaborative than ever. Qlik Sense Desktop puts rapid analytics
MODERNIZE YOUR DATA CENTER. With Cisco Nexus Switches
 MODERNIZE YOUR DATA CENTER With Cisco Nexus Switches TABLE OF CONTENTS TABLE OF CONTENTS Data Center Needs are Changing Cisco Nexus Switches Lead the Transition to a Next Generation Data Center Outcomes
VAT/GST Analytics by Deloitte User Guide August 2017
 VAT/GST Analytics by Deloitte User Guide August 2017 Contents What is VAT/GST Analytics? What is Qlik Sense? The Associative Model How to access Qlik Sense? Navigate through Qlik Sense A quick overview
Feed Your Inner Data Scientist JAVASCRIPT TOOLS FOR DATA VISUALIZATION AND ANALYSIS
 Feed Your Inner Data Scientist JAVASCRIPT TOOLS FOR DATA VISUALIZATION AND ANALYSIS GOAL For Today Big Data Health Gov t Financial Dev Ops IOT Sensors Stats Bio Doug Mair Doug.Mair@gmail.com @doug_mair
Tableau. training courses
 Tableau training courses Tableau Desktop 2 day course This course covers Tableau Desktop functionality required for new Tableau users. It starts with simple visualizations and moves to an in-depth look
Built for Speed: Comparing Panoply and Amazon Redshift Rendering Performance Utilizing Tableau Visualizations
 Built for Speed: Comparing Panoply and Amazon Redshift Rendering Performance Utilizing Tableau Visualizations Table of contents Faster Visualizations from Data Warehouses 3 The Plan 4 The Criteria 4 Learning
REALIZE YOUR. DIGITAL VISION with Digital Private Cloud from Atos and VMware
 REALIZE YOUR DIGITAL VISION with Digital Private Cloud from Atos and VMware Today s critical business challenges and their IT impact Business challenges Maximizing agility to accelerate time to market
Qlik Sense Enterprise architecture and scalability
 White Paper Qlik Sense Enterprise architecture and scalability June, 2017 qlik.com Platform Qlik Sense is an analytics platform powered by an associative, in-memory analytics engine. Based on users selections,
Tableau COURSE CONTENT
 Tableau COURSE CONTENT Introduction to Data Warehousing What is Data Warehousing Data Warehousing Characteristics and Architecture Difference between OLTP And OLAP What is Dimension table When to use Dimension
Low Friction Data Warehousing WITH PERSPECTIVE ILM DATA GOVERNOR
 Low Friction Data Warehousing WITH PERSPECTIVE ILM DATA GOVERNOR Table of Contents Foreword... 2 New Era of Rapid Data Warehousing... 3 Eliminating Slow Reporting and Analytics Pains... 3 Applying 20 Years
TECHNOLOGY SOLUTION EVOLUTION
 JAR PLATFORM JORVAK TECHNOLOGY SOLUTION EVOLUTION 1990s Build Your Own Time to Production Present Time Highly Configurable Hybrid Platforms Universal Connectivity Application Screens Integrations/Reporting
Drawing the Big Picture
 Drawing the Big Picture Multi-Platform Data Architectures, Queries, and Analytics Philip Russom TDWI Research Director for Data Management August 26, 2015 Sponsor 2 Speakers Philip Russom TDWI Research
The Definitive Guide to Preparing Your Data for Tableau
 The Definitive Guide to Preparing Your Data for Tableau Speed Your Time to Visualization If you re like most data analysts today, creating rich visualizations of your data is a critical step in the analytic
What s New in Spotfire DXP 1.1. Spotfire Product Management January 2007
 What s New in Spotfire DXP 1.1 Spotfire Product Management January 2007 Spotfire DXP Version 1.1 This document highlights the new capabilities planned for release in version 1.1 of Spotfire DXP. In this
DataND Finance. A Journey into Enterprise Data Warehouse
 DataND Finance A Journey into Enterprise Data Warehouse About the Presenters Vaibhav Agarwal Chris Frederick Manager, Finance Systems Email: vagarwal@nd.edu Business Intelligence Manager Email: cfreder2@nd.edu
EZY Intellect Pte. Ltd., #1 Changi North Street 1, Singapore
 Tableau in Business Intelligence Duration: 6 Days Tableau Desktop Tableau Introduction Tableau Introduction. Overview of Tableau workbook, worksheets. Dimension & Measures Discrete and Continuous Install
Comparative Study of Static and Interactive VisualizationApproaches
 Comparative Study of Static and Interactive Approaches Kirti Nilesh Mahajan Institute of Management and Entrepreneurship Development (IMED), BharatiVidyapeeth Deemed University, Pune, Maharashtra, India
Introduction to Sencha Ext JS
 Introduction to Sencha Ext JS Olga Petrova olga@sencha.com Sales Engineer EMEA Agenda Use Case How It Works Advantages Demo Use case Ext JS a Javascript framework for building enterprise data-intensive
A detailed comparison of EasyMorph vs Tableau Prep
 A detailed comparison of vs We at keep getting asked by our customers and partners: How is positioned versus?. Well, you asked, we answer! Short answer and are similar, but there are two important differences.
QLIKVIEW SCALABILITY BENCHMARK WHITE PAPER
 QLIKVIEW SCALABILITY BENCHMARK WHITE PAPER Measuring Business Intelligence Throughput on a Single Server QlikView Scalability Center Technical White Paper December 2012 qlikview.com QLIKVIEW THROUGHPUT
Business Analytics Nanodegree Syllabus
 Business Analytics Nanodegree Syllabus Master data fundamentals applicable to any industry Before You Start There are no prerequisites for this program, aside from basic computer skills. You should be
Tableau Desktop: Part 2
 Tableau Desktop: Part 2 095205 Target Student Professionals in a variety of job roles who are currently using Tableau to perform numerical or general data analysis, visualization, and reporting, who now
How Commercial Off-the-Shelf (COTS) Business Intelligence (BI) Tools Can Improve Financial Management Analysis
 Business Intelligence (BI) Tools Can Improve Financial Management Analysis") How Commercial Off-the-Shelf (COTS) Business Intelligence (BI) Tools Can Improve Financial Management Analysis Carolyn L. North, CPA, CGFM, CDFM/A, PMP R. Ross Hosse, CDFM Purpose of Business Intelligence
How Commercial Off-the-Shelf (COTS) Business Intelligence (BI) Tools Can Improve Financial Management Analysis Carolyn L. North, CPA, CGFM, CDFM/A, PMP R. Ross Hosse, CDFM Purpose of Business Intelligence
Product Requirements for Data Dwarf. Revisions
 Product Requirements for Data Dwarf Prepared by Sean Spearman Cody Brown Ray Smets Aimee Galang Tim Shen Mercury Squad seanmspeaman@gmail.com codybrwn551@aol.com rayjsmets@gmail.com aimeegalang@gmail.com
Desktop User Guide. Version: 10.10
 Version: 10.10 10.10, December 2017 Copyright 2017 by MicroStrategy Incorporated. All rights reserved. Trademark Information The following are either trademarks or registered trademarks of MicroStrategy
How To Manage Disk Effectively with MPG's Performance Navigator
 How To Manage Disk Effectively with MPG's Performance Navigator Today s Agenda: How To Really Understand Your Disk Environment a) Managing Disk is Hard It Doesn t Have To Be b) Measure Individual ASPs
chapter two: building your first report... 15
 An Introduction to SAS Visual Analytics: How to Explore Numbers, Design Reports, and Gain Insight into Your Data. Full book available for purchase here. contents about this book... ix about these authors...
UCF DATA ANALYTICS AND VISUALIZATION BOOT CAMP
 UCF DATA ANALYTICS AND VISUALIZATION BOOT CAMP CURRICULUM OVERVIEW Over the past decade, the explosion of data has transformed nearly every industry known to man. Whether it s marketing, healthcare, government,
20466C - Version: 1. Implementing Data Models and Reports with Microsoft SQL Server
 20466C - Version: 1 Implementing Data Models and Reports with Microsoft SQL Server Implementing Data Models and Reports with Microsoft SQL Server 20466C - Version: 1 5 days Course Description: The focus
POWER BI BOOTCAMP. COURSE INCLUDES: 4-days of instructor led discussion, Hands-on Office labs and ebook.
 Course Code : AUDIENCE : FORMAT: LENGTH: POWER BI BOOTCAMP O365-412-PBID (CP PBD365) Professional Developers Instructor-led training with hands-on labs 4 Days COURSE INCLUDES: 4-days of instructor led
IT directors, CIO s, IT Managers, BI Managers, data warehousing professionals, data scientists, enterprise architects, data architects
 Organised by: www.unicom.co.uk OVERVIEW This two day workshop is aimed at getting Data Scientists, Data Warehousing and BI professionals up to scratch on Big Data, Hadoop, other NoSQL DBMSs and Multi-Platform
Course Outline. Microsoft Power BI Interactive Data Visualizations Course : 2 days Instructor Led
 Microsoft Power BI Interactive Data Visualizations Course 752550: 2 days Instructor Led ABOUT THE COURSE Microsoft Power BI transforms your company data into rich visuals that facilitate new ways of thinking
Analytics: measuring web site success. MBA 563 Week 4
 Analytics: measuring web site success MBA 563 Week 4 Overview: Methods of measuring marketing success You can t manage what you can t measure (Bob Napier, ex CIO, Hewlett Packard) 1. Data mining and predictive
Content Visualization Issues
 Name Sanobar Nishat (113052001) MTP : Implementation Issues of Visualization on Small screen devices Report: Summary Report 4 (week 4) Date: 4 Feb 13 Summary: Graphical data visualization is used to display
Modernize with all-flash
 Modernize with all-flash EFFICIENCY AGILITY SPEED Pillars of the modern data center FLASH SCALE-OUT SOFTWARE DEFINED CLOUD ENABLED Reduce costs (# of drives, power, floor space, etc.) Consistent and predictable
CA ERwin Data Modeler r9 Rick Alaras N.A. Channel Account Manager
 ERwin r9 CA ERwin Data Modeler r9 Rick Alaras N.A. Channel Account Manager In today s data-driven economy, there is an increasing disconnect between consumers and providers of data DATA VOLUMES INCREASING
DATA SCIENCE NORTHWESTERN BOOT CAMP CURRICULUM OVERVIEW DATA SCIENCE BOOT CAMP
 DATA SCIENCE BOOT CAMP NORTHWESTERN DATA SCIENCE BOOT CAMP CURRICULUM OVERVIEW Over the past decade, the explosion of data has transformed nearly every industry known to man. Whether it s marketing, healthcare,
THE DATA ANALYTICS BOOT CAMP
 THE DATA ANALYTICS BOOT CAMP CURRICULUM OVERVIEW Over the course of the past decade, the explosion of data has transformed nearly every industry known to man. Whether it s in marketing, healthcare, government,
COURSE 20466D: IMPLEMENTING DATA MODELS AND REPORTS WITH MICROSOFT SQL SERVER
 ABOUT THIS COURSE The focus of this five-day instructor-led course is on creating managed enterprise BI solutions. It describes how to implement multidimensional and tabular data models, deliver reports
Qlik s Associative Model
 White Paper Qlik s Associative Model See the Whole Story that Lives Within Your Data January, 2017 qlik.com Table of Contents Introduction 3 Qlik s associative model 3 Query-based visualization tools only
2013 European Users Conference Barcelona
 OData API Questionmark Analytics Copyright 1995-2013 Questionmark Corporation and/or Questionmark Computing Limited, known collectively as Questionmark. All rights reserved. Questionmark Austin Fossey
The TIBCO Insight Platform 1. Data on Fire 2. Data to Action. Michael O Connell Catalina Herrera Peter Shaw September 7, 2016
 The TIBCO Insight Platform 1. Data on Fire 2. Data to Action Michael O Connell Catalina Herrera Peter Shaw September 7, 2016 Analytics Journey with TIBCO Source: Gartner (May 2015) The TIBCO Insight Platform:
The Data Catalog The Key to Managing Data, Big and Small. April Reeve May
 The Data Catalog The Key to Managing Data, Big and Small April Reeve May 18 2017 April Reeve Thirty years doing data oriented stuff Data Management disciplines Data Integration, Data Governance, Data Modeling,
DATA ANALYTICS BOOT CAMP
 The UofT SCS DATA ANALYTICS BOOT CAMP Curriculum Overview Over the past decade, the explosion of data has transformed nearly every industry known to man. Whether it s marketing, healthcare, government,
TIBCO Analytics Meetup. Michael O Connell and the TIBCO Data Science Team April 25th, 2017
 TIBCO Analytics Meetup Michael O Connell and the TIBCO Data Science Team April 25th, 2017 CONFIDENTIALITY The following information is confidential information of TIBCO Software Inc. Use, duplication,
Capability White Paper Straight-Through-Processing (STP)
") Capability White Paper Straight-Through-Processing (STP) Drag-and-drop to create automated, repeatable, flexible and powerful data flow and application logic orchestration without programming to support
Capability White Paper Straight-Through-Processing (STP) Drag-and-drop to create automated, repeatable, flexible and powerful data flow and application logic orchestration without programming to support
alteryx training courses
 alteryx training courses alteryx designer 2 day course This course covers Alteryx Designer for new and intermediate Alteryx users. It introduces the User Interface and works through core Alteryx capability,
#mstrworld. Analyzing Multiple Data Sources with Multisource Data Federation and In-Memory Data Blending. Presented by: Trishla Maru.
 Analyzing Multiple Data Sources with Multisource Data Federation and In-Memory Data Blending Presented by: Trishla Maru Agenda Overview MultiSource Data Federation Use Cases Design Considerations Data
Spotfire: Brisbane Breakfast & Learn. Thursday, 9 November 2017
 Spotfire: Brisbane Breakfast & Learn Thursday, 9 November 2017 CONFIDENTIALITY The following information is confidential information of TIBCO Software Inc. Use, duplication, transmission, or republication
Introduction to Data Science
 UNIT I INTRODUCTION TO DATA SCIENCE Syllabus Introduction of Data Science Basic Data Analytics using R R Graphical User Interfaces Data Import and Export Attribute and Data Types Descriptive Statistics
From Insight to Action: Analytics from Both Sides of the Brain. Vaz Balasingham Director of Solutions Consulting
 From Insight to Action: Analytics from Both Sides of the Brain Vaz Balasingham Director of Solutions Consulting vbalasin@tibco.com Insight to Action from Both Sides of the Brain Value Grow Revenue Reduce
Informatica Enterprise Information Catalog
 Data Sheet Informatica Enterprise Information Catalog Benefits Automatically catalog and classify all types of data across the enterprise using an AI-powered catalog Identify domains and entities with
Energizing Life's Work with the leading social software platform 19 th September 2013, Moscow
 Energizing Life's Work with the leading social software platform 19 th September 2013, Moscow At the Dawn of IT I think there is a world market for maybe 5 computers. Thomas J. Watson, Sr. There is no
InfoVis Systems & Toolkits. Outline. CS 795/895 Information Visualization Fall Dr. Michele C. Weigle.
 CS 795/895 Information Visualization Fall 2012 InfoVis Systems & Toolkits Dr. Michele C. Weigle http://www.cs.odu.edu/~mweigle/cs795-f12/ Outline! Graphing tools! Visualization systems! built-in visualizations!
Qlik Analytics Platform
 Technical Brief Qlik Analytics Platform Building Engaging Visual Analytics October, 2015 qlik.com Table of Contents Introduction 3 Introducing Qlik Analytics Platform 3 Integration Capabilities 4 Architecture
Strengthening Self-Service Analytics with Data Preparation and Data Virtualization
 Strengthening Self-Service Analytics with Data Preparation and Data Virtualization A Technical Whitepaper Rick F. van der Lans Independent Business Intelligence Analyst R20/Consultancy September 2015 Sponsored
InfoVis Systems & Toolkits
 InfoVis Systems & Toolkits CS 7450 - Information Visualization September 21, 2016 John Stasko Learning Objectives Gain familiarity with history of visualization toolkits Describe what each's new contribution
Implementing Data Models and Reports with SQL Server 2014
 Course 20466D: Implementing Data Models and Reports with SQL Server 2014 Page 1 of 6 Implementing Data Models and Reports with SQL Server 2014 Course 20466D: 4 days; Instructor-Led Introduction The focus
MicroStrategy Academic Program
 MicroStrategy Academic Program Creating a center of excellence for enterprise analytics and mobility. GEOSPATIAL ANALYTICS: HOW TO VISUALIZE GEOSPATIAL DATA ON MAPS AND CUSTOM SHAPE FILES APPROXIMATE TIME
MCSE Mobility Earned: MCSE Cloud Platform & Infrastructure Earned: 2017 MCSE MCSE. MCSD App Builder. MCSE Business Applications Earned 2017
 MOBILITY 10 Mobility CLOUD PLATFORM & INFRASTRUCTURE Server 2012 Server 2016 MCSA Linux on Azure Cloud Platform & Infrastructure MCSA Cloud Platform PRODUCTIVITY Server 2012 or 2016 MCSA Office 365 Productivity
Fast Innovation requires Fast IT
 Fast Innovation requires Fast IT Cisco Data Virtualization Puneet Kumar Bhugra Business Solutions Manager 1 Challenge In Data, Big Data & Analytics Siloed, Multiple Sources Business Outcomes Business Opportunity:
Strategies for Running Oracle Forms from Mobile Devices and Tablets.
 Strategies for Running Oracle Forms from Mobile Devices and Tablets Mia Urman, AuraPlayer miaurman@auraplayer.com Denis Tyrell, Oracle 5 Copyright 2012, Oracle and/or its affiliates. All rights reserved.
MicroStrategy Academic Program
 MicroStrategy Academic Program Creating a center of excellence for enterprise analytics and mobility. PREDICTIVE ANALYTICS AND R APPROXIMATE TIME NEEDED: 1 HOUR TABLE OF CONTENTS TABLE OF CONTENTS 2 SET
Datameer for Data Preparation:
 Datameer for Data Preparation: Explore, Profile, Blend, Cleanse, Enrich, Share, Operationalize DATAMEER FOR DATA PREPARATION: EXPLORE, PROFILE, BLEND, CLEANSE, ENRICH, SHARE, OPERATIONALIZE Datameer Datameer
OData API. Questionmark Analytics Austin Fossey Users Conference San Antonio March 4 th 7 th
 OData API Questionmark Analytics Austin Fossey 2014 Users Conference San Antonio March 4 th 7 th Austin Fossey Reporting and Analytics Manager, Questionmark austin.fossey@questionmark.com Objectives By
Magento U. Getting Started with Magento Business Intelligence Essentials
 Magento U Getting Started with Magento Business Intelligence Essentials Leah Ard Solutions Architect, Magento Business Intelligence Nate Golubiewski Solutions Consultant, Magento Agenda Overview: Magento
Deploying, Managing and Reusing R Models in an Enterprise Environment
 Deploying, Managing and Reusing R Models in an Enterprise Environment Making Data Science Accessible to a Wider Audience Lou Bajuk-Yorgan, Sr. Director, Product Management Streaming and Advanced Analytics
An Overview of Every Mobile Widget From Analytics and Transactions to Geolocation and Multimedia
 An Overview of Every Mobile Widget From Analytics and Transactions to Geolocation and Multimedia Andrea Schiller #mstrworld Agenda Introduction Basic Visualizations (Graphs) Advanced Visualizations (Widgets)
Tableau Advanced Training. Student Guide April x. For Evaluation Only
 Tableau Advanced Training Student Guide www.datarevelations.com 914.945.0567 April 2017 10.x Contents A. Warm Up 1 Bar Chart Colored by Profit 1 Salary Curve 2 2015 v s. 2014 Sales 3 VII. Programmatic
The Associative Difference
 White Paper The Associative Difference Freedom from the limitations of query-based tools September, 2017 qlik.com Table of Contents Introduction 3 Qlik s Associative Difference 3 Query-based tools limitations
Business Intelligence: MAKING DATA AGILE USING INTEGRATED TOOLS TO VISUALIZE ZEMA DATA
 Business Intelligence: MAKING DATA AGILE USING INTEGRATED TOOLS TO VISUALIZE ZEMA DATA ARTICLE NOVEMBER 2017 ZEMA gives insight into the business intelligence information businesses need, anywhere, and
Intro to BI Architecture Warren Sifre
 Intro to BI Architecture Warren Sifre introduction Warren Sifre Principal Consultant Email: wa_sifre@hotmail.com Website: www.linkedin.com/in/wsifre Twitter: @WAS_SQL Professional History 20 years in the
What I didn't know I needed to know
 Welcome to TC18! # T C 1 8 What I didn't know I needed to know David Clark Sith Lord Nationwide Insurance Infrastructure Engineering Yi Cheng Sith Lady Nationwide Insurance Infrastructure Engineering Agenda
Data Driven Guides: Supporting expressive design for Information graphics
 Data Driven Guides: Supporting expressive design for Information graphics Nam Wook Kim Eston Schweickart Zhicheng Leo Liu Harvard Cornell Adobe Mira Dontcheva Wilmot Li Jovan Popović Hanspeter Pfister
Perfect Balance of Public and Private Cloud
 Perfect Balance of Public and Private Cloud Delivered by Fujitsu Introducing A unique and flexible range of services, designed to make moving to the public cloud fast and easier for your business. These
Extract API: Build sophisticated data models with the Extract API
 Welcome # T C 1 8 Extract API: Build sophisticated data models with the Extract API Justin Craycraft Senior Sales Consultant Tableau / Customer Consulting My Office Photo Used with permission Agenda 1)
MicroStrategy Academic Program
 MicroStrategy Academic Program Creating a center of excellence for enterprise analytics and mobility. HOW TO DEPLOY ENTERPRISE ANALYTICS AND MOBILITY ON AWS APPROXIMATE TIME NEEDED: 1 HOUR In this workshop,
Case Study: Tata Communications Delivering a Truly Interactive Business Intelligence Experience on a Large Multi-Tenant Hadoop Cluster
 Case Study: Tata Communications Delivering a Truly Interactive Business Intelligence Experience on a Large Multi-Tenant Hadoop Cluster CASE STUDY: TATA COMMUNICATIONS 1 Ten years ago, Tata Communications,
Data Visualization (CIS/DSC 468)
") Data Visualization (CIS/DSC 468) Web Programming Dr. David Koop Definition of Visualization Computer-based visualization systems provide visual representations of datasets designed to help people carry
Data Visualization (CIS/DSC 468) Web Programming Dr. David Koop Definition of Visualization Computer-based visualization systems provide visual representations of datasets designed to help people carry
Ian Choy. Technology Solutions Professional
 Ian Choy Technology Solutions Professional XML KPIs SQL Server 2000 Management Studio Mirroring SQL Server 2005 Compression Policy-Based Mgmt Programmability SQL Server 2008 PowerPivot SharePoint Integration
QLIKVIEW ARCHITECTURAL OVERVIEW
 QLIKVIEW ARCHITECTURAL OVERVIEW A QlikView Technology White Paper Published: October, 2010 qlikview.com Table of Contents Making Sense of the QlikView Platform 3 Most BI Software Is Built on Old Technology
Interoperability First Published On: Last Updated On:
 First Published On: 02-08-2017 Last Updated On: 04-23-2018 1 Table of Contents 1. vsan with vrealize Operations (vr Ops) 1.1.Using vr Ops MP for vsan to understand performance 2 1. vsan with vrealize Operations
Power BI Architecture
 What is Power BI? Power BI is a collection of software services, apps, and connectors that work together to turn unrelated sources of data into coherent, visually immersive, and interactive insights. -