SAS/GRAPH Introduction. Winfried Jakob, SAS Administrator Canadian Institute for Health Information
|
|
|
- Mitchell Lindsey
- 5 years ago
- Views:
Transcription

1 SAS/GRAPH Introduction Winfried Jakob, SAS Administrator Canadian Institute for Health Information 1
2 Agenda Overview Components of SAS/GRAPH Software Device-Based vs. Template-Based Graphics Graph Types A Typical SAS/GRAPH Program Getting Started 2
3 Overview SAS/GRAPH is the data visualization and presentation (graphics) component of the SAS System. 3
4 Overview SAS/GRAPH Visually represents the relationship between data values Produces two- and three-dimensional graphs, including charts, plots, maps Can combine several graphs into one Supports creation of custom graphics 4
5 Overview SAS/GRAPH Allows addition of titles, footnotes and notes Supports selection of text fonts, colours, patterns, line styles Provides control over size and position of many graphics elements 5
6 Overview SAS/GRAPH Creates presentation graphics: Text slides Display of several graphs at one time Combination of graphs and text Automated presentations 6
7 Overview SAS/GRAPH Generates a wide variety of graphics output: Vector graphics, bitmap images, ActiveX, Java For screen, web browsers, hardcopy devices Supports ODS destinations: LISTING, HTML, RTF, PDF, PRINTER Graphs can be stored in SAS catalogs: Replay, recombine, export, print 7
8 Overview SAS/GRAPH Provides map data sets, fonts Provides utility procedures for: Map import / map creation / map manipulation Font creation Device customization Checking the SAS/GRAPH environment settings 8
9 Components of SAS/GRAPH Device-based SAS/GRAPH procedures Annotate Facility Data Step Graphics Interface Network Visualization (NV) Workshop 9
10 Components of SAS/GRAPH SAS/GRAPH statistical graphics suite Part of ODS Statistical Graphics Template-based Provides these features: Statistical Graphics (SG) procedures Graph Template Language ODS Graphics Editor ODS Graphics Designer 10
11 Device-Based vs. Template-Based Graphics SAS/GRAPH produces graphics using two very distinct systems: Device-Based or Template-Based Note: Most users are familiar with the traditional devicebased system for producing graphics 11
12 Device-Based Graphics SAS/GRAPH output generated by a default or user-specified device (DEVICE= option) DEVICE= Examples: WIN, GIF, PNG, JPEG, ACTIVEX, SVG, HPGL Procedure Examples: GCHART, GPLOT, GMAP, GBARLINE, G3D, GCONTOUR Note: GOPTIONS control the graphical environment 12
13 Template-Based Graphics SAS/GRAPH output generated based on an ODS template of type STATGRAPH Procedure Examples: SGPLOT, SGPANEL, SGSCATTER, SGRENDER Note: ODS GRAPHICS statement controls the graphical environment. GOPTIONS have no effect 13
14 Graph Types: Overview Charts Two-Dimensional Plots Three-Dimensional Plots Maps KPI Charts (KPI = Key Performance Indicator) Text Slide and Presentation Graphics Custom Graphics 14
15 Graph Types: Block Charts 15
16 Graph Types: Horizontal Bar Charts 16
17 Graph Types: Vertical Bar Charts 17


18 Graph Types: Pie Charts 18

19 Graph Types: Donut Charts 19
20 Graph Types: Star Charts 20

21 Graph Types: Bar-Line Charts 21

22 Graph Types: Area Bar Charts 22

23 Graph Types: Tile Charts 23
24 Graph Types: Radar Charts 24
25 Types: Two-Dimensional Scatter Plots 25
26 Graph Types: Simple Line Plots 26
27 Graph Types: Regression Plots 27
28 Graph Types: High-Low Plots 28
29 Graph Types: Bubble Plots 29
30 Graph Types: 3-D Surface Plots 30
31 Graph Types: 3-D Scatter Plots 31
32 Graph Types: 3-D Contour Plots 32

33 Graph Types: Block Maps 33
34 Graph Types: Choropleth Maps 34

35 Graph Types: Prism Maps 35
36 Graph Types: Surface Maps 36

37 Graph Types: KPI Charts 37

38 Graph Types: Text Slides 38

39 Graph Types: Combined Graphs 39
40 A Typical SAS/GRAPH Program ods html file="c:\regression.htm" style=analysis; goptions reset=all device=activex; title c=magenta "Study of Height vs. Weight"; footnote justify=r height=2 "Data: SASHELP.CLASS"; symbol interpol=rcclm95 value=circle; proc gplot data=sashelp.class; plot height * weight / haxis = 45 to 155 by 10; run; quit; ods html close; 40
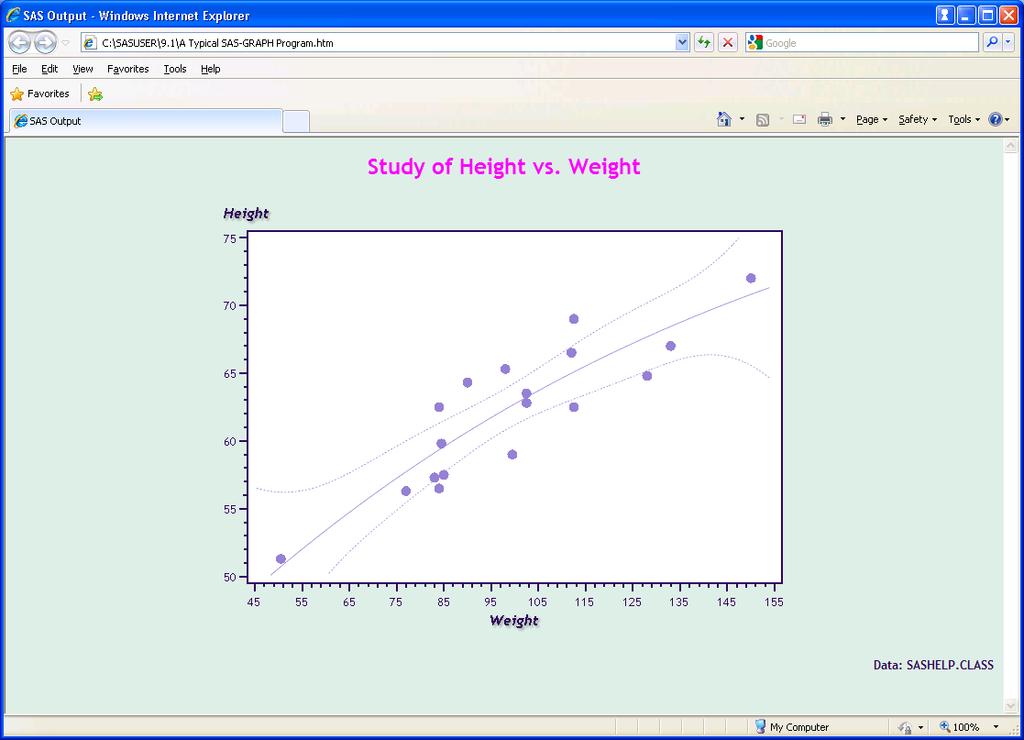
41 41
42 Elements of a SAS/GRAPH Program Procedure Statement Action Statement proc gplot plot x * y Other Statements and Options / haxis = Global Statements: AXIS BY GOPTIONS LEGEND PATTERN SYMBOL TITLE NOTE FOOTNOTE 42
43 Getting Started Get the reference documentation: SAS/GRAPH 9.2 Reference free on the Web in HTML or PDF (only pages ) Most examples in the reference documentation are installed as part of SAS/GRAPH in folder: YourSASroot\graph\sample Run examples of interest and read up on the procedure and the global statements. 43
44 Getting Started Use Quick Results with SAS/GRAPH Software by Arthur L. Carpenter / Charles E. Shipp, SAS Books by Users #55127 (from still good for device-based graphics) Learn by doing experience is the best teacher For ODS Statistical Graphics: Graphing Made Easy with SG Procedures by Susan J. Slaughter / Lora D. Delwiche, SGF 2011 paper 44
45 Final Message IF you plan to be an avid user THEN DO; END; take a course; read books and articles; learn by doing; ELSE use Enterprise Guide; 45
46 SAS/GRAPH 9.2 Introduction Main source for this presentation: SAS/GRAPH 9.2 Reference (PDF Version) Note: SAS and all other SAS Institute Inc. product or service names are registered trademarks or trademarks of SAS To contact the presenter: 46
CHAPTER 1 Introduction to SAS/GRAPH Software
 3 CHAPTER 1 Introduction to SAS/GRAPH Software Overview 4 Components of SAS/GRAPH Software 4 Device-Based Graphics and Template-Based Graphics 6 Graph Types 6 Charts 7 Block charts 7 Horizontal bar charts
Interactive Graphs from the SAS System
 Interactive Graphs from the SAS System Shi-Tao Yeh, GlaxoSmithKline, King of Prussia, PA. ABSTRACT An interactive graph is a dynamic graph interface that allows viewers interaction. The SAS System provides
Introduction to SAS/GRAPH Statistical Graphics Procedures
 3 CHAPTER 1 Introduction to SAS/GRAPH Statistical Graphics Procedures Overview of SAS/GRAPH Statistical Graphics Procedures 3 Introduction to the SGPLOT Procedure 4 Introduction to the SGPANEL Procedure
Introduction to Statistical Graphics Procedures
 Introduction to Statistical Graphics Procedures Selvaratnam Sridharma, U.S. Census Bureau, Washington, DC ABSTRACT SAS statistical graphics procedures (SG procedures) that were introduced in SAS 9.2 help
SAS/GRAPH 9.4: Java Applets and ActiveX Control User s Guide
 SAS/GRAPH 9.4: Java Applets and ActiveX Control User s Guide SAS Documentation August 30, 2017 The correct bibliographic citation for this manual is as follows: SAS Institute Inc. 2014. SAS/GRAPH 9.4:
Chapter 13 Introduction to Graphics Using SAS/GRAPH (Self-Study)
") Chapter 13 Introduction to Graphics Using SAS/GRAPH (Self-Study) 13.1 Introduction... 2 13.2 Creating Bar and Pie Charts... 8 13.3 Creating Plots... 20 13-2 Chapter 13 Introduction to Graphics Using SAS/GRAPH
Chapter 13 Introduction to Graphics Using SAS/GRAPH (Self-Study) 13.1 Introduction... 2 13.2 Creating Bar and Pie Charts... 8 13.3 Creating Plots... 20 13-2 Chapter 13 Introduction to Graphics Using SAS/GRAPH
Information Visualization
 Paper 158-25 Graphs In a Minute Harry J. Maxwell Jr., SAS Institute Inc, Cary, NC ABSTRACT Software from SAS Institute provides multiple ways of producing attractive graphics quickly using simple and intuitive
A Visual Revolution Statistical Graphics in SAS 9.2 Bob Newman, Amadeus Software Limited
 A Visual Revolution Statistical Graphics in SAS 9.2 Bob Newman, Amadeus Software Limited ABSTRACT This paper gives an introduction to the ODS Statistical Graphics facilities of SAS 9.2, emphasising ease
New Visualization in V8.2
 Paper 161-26 New Visualization in V8.2 Himesh Patel, SAS Institute Sanjay Matange, SAS Institute ABSTRACT Looking for a pain-free way to combine tables and graphs on the same page? Well, the search is
Creating Graphs Using SAS ODS Graphics Designer
 Creating Graphs Using SAS ODS Graphics Designer William Knabe Former Director of Statistical Applications, UI Information Technology Services SAS Summer Training Institute 2016 Slide 1 Overview. Evolution
What s new in SAS 9.2
 Winnipeg SAS User Group 29APR2009 What s new in SAS 9.2 Sylvain Tremblay SAS Canada Education New release of SAS: 9.2 SAS Foundation: BASE STAT... Tools & Solutions Enterprise Guide 4.2 Enterprise Miner
Overview 14 Table Definitions and Style Definitions 16 Output Objects and Output Destinations 18 ODS References and Resources 20
 Contents Acknowledgments xiii About This Book xv Part 1 Introduction 1 Chapter 1 Why Use ODS? 3 Limitations of SAS Listing Output 4 Difficulties with Importing Standard Listing Output into a Word Processor
Tips to Customize SAS/GRAPH... for Reluctant Beginners et al. Claudine Lougee, Dualenic, LLC, Glen Allen, VA
 Paper SIB-109 Tips to Customize SAS/GRAPH... for Reluctant Beginners et al. Claudine Lougee, Dualenic, LLC, Glen Allen, VA ABSTRACT SAS graphs do not have to be difficult or created by SAS/GRAPH experts.
Easing into Data Exploration, Reporting, and Analytics Using SAS Enterprise Guide
 Paper 809-2017 Easing into Data Exploration, Reporting, and Analytics Using SAS Enterprise Guide ABSTRACT Marje Fecht, Prowerk Consulting Whether you have been programming in SAS for years, are new to
Getting Started with the SGPLOT Procedure
 ABSTRACT Getting Started with the SGPLOT Procedure Joshua M. Horstman, Nested Loop Consulting Do you want to create highly-customizable, publication-ready graphics in just minutes using SAS? This workshop
Something for Nothing! Converting Plots from SAS/GRAPH to ODS Graphics
 ABSTRACT Paper 1610-2014 Something for Nothing! Converting Plots from SAS/GRAPH to ODS Graphics Philip R Holland, Holland Numerics Limited, UK All the documentation about the creation of graphs with SAS
SAS CLINICAL SYLLABUS. DURATION: - 60 Hours
 SAS CLINICAL SYLLABUS DURATION: - 60 Hours BASE SAS PART - I Introduction To Sas System & Architecture History And Various Modules Features Variables & Sas Syntax Rules Sas Data Sets Data Set Options Operators
ABC s of Graphs in Version 8 Caroline Bahler, Meridian Software, Inc.
 ABC s of Graphs in Version 8 Caroline Bahler, Meridian Software, Inc. Abstract Version 8 has greatly increased the versatility and usability of graphs that can be created by SAS. This paper will discuss
Using SAS/GRAPH Software to Create Graphs on the Web Himesh Patel, SAS Institute Inc., Cary, NC Revised by David Caira, SAS Institute Inc.
 Paper 189 Using SAS/GRAPH Software to Create Graphs on the Web Himesh Patel, SAS Institute Inc., Cary, NC Revised by David Caira, SAS Institute Inc., Cary, NC ABSTRACT This paper highlights some ways of
Introduction to ODS Graphics for the Non-Statistician
 ABSTRACT Paper RV-01 Introduction to ODS Graphics for the Non-Statistician Mike Kalt and Cynthia Zender, SAS Institute Inc., Cary, NC Are you a History, English, or other humanities major who has stumbled
Output Delivery System: The Basics and Beyond Lauren E. Haworth Cynthia L. Zender Michele M. Burlew
 Reviewed by Ken Mah Statistics Canada For the Ottawa Area SAS Users Society (O.A.S.U.S) June 1 st, 2011 Output Delivery System: The Basics and Beyond Lauren E. Haworth Cynthia L. Zender Michele M. Burlew
Elixir Ad-hoc Report. Release Elixir Technology Pte Ltd
 Elixir Ad-hoc Report Release 3.5.0 Elixir Technology Pte Ltd Elixir Ad-hoc Report: Release 3.5.0 Elixir Technology Pte Ltd Published 2014 Copyright 2014 Elixir Technology Pte Ltd All rights reserved. Java
Coders' Corner. Paper ABSTRACT GLOBAL STATEMENTS INTRODUCTION
 Paper 70-26 Data Visualization of Outliers from a Health Research Perspective Using SAS/GRAPH and the Annotate Facility Nadia Redmond Kaiser Permanente Center for Health Research, Portland, Oregon ABSTRACT
Graphing Made Easy with ODS Graphics Procedures
 Paper 1267-2014 Graphing Made Easy with ODS Graphics Procedures Lora D. Delwiche, University of California, Davis, CA Susan J. Slaughter, Avocet Solutions, Davis, CA ABSTRACT New with SAS 9.2, ODS Graphics
Elixir Ad-hoc Report. Release Elixir Technology Pte Ltd
 Elixir Ad-hoc Report Release 4.0.0 Elixir Technology Pte Ltd Elixir Ad-hoc Report: Release 4.0.0 Elixir Technology Pte Ltd Published 2015 Copyright 2015 Elixir Technology Pte Ltd All rights reserved. Java
Paper ###-YYYY. SAS Enterprise Guide: A Revolutionary Tool! Jennifer First, Systems Seminar Consultants, Madison, WI
 Paper ###-YYYY SAS Enterprise Guide: A Revolutionary Tool! Jennifer First, Systems Seminar Consultants, Madison, WI ABSTRACT Whether you are a novice or a pro with SAS, Enterprise Guide has something for
Need a Scientific Journal Ready Graphic? No Problem!
 ABSTRACT Paper 1440-2017 Need a Scientific Journal Ready Graphic? No Problem! Charlotte Baker, Florida Agricultural and Mechanical University Graphics are an excellent way to display results from multiple
Want Quick Results? An Introduction to SAS/GRAPH Software. Arthur L. Carpenter California Occidental Consultants
 Want Quick Results? An Introduction to SAS/GRAPH Software Arthur L. arpenter alifornia Occidental onsultants KEY WORDS GOPTIONS, GPLOT, GHART, SYMBOL, AXIS, TITLE, FOOTNOTE ABSTRAT SAS/GRAPH software contains
From Getting Started with the Graph Template Language in SAS. Full book available for purchase here.
 From Getting Started with the Graph Template Language in SAS. Full book available for purchase here. Contents About This Book... xi About The Author... xv Acknowledgments...xvii Chapter 1: Introduction
And Now, Presenting...
 SAS Graphics on ODS 9.2 Performance-Enhancing Steroids Daniel O Connor, SAS Institute Inc, Cary, NC ABSTRACT In the midst of performance-enhancing drug scandals in professional sports, you would think
Using Graph-N-Go With ODS to Easily Present Your Data and Web-Enable Your Graphs Curtis A. Smith, Defense Contract Audit Agency, La Mirada, CA
 Paper 160-26 Using Graph-N-Go With ODS to Easily Present Your Data and Web-Enable Your Graphs Curtis A. Smith, Defense Contract Audit Agency, La Mirada, CA ABSTRACT Visualizing and presenting data effectively
Time Contour Plots. David J. Corliss Magnify Analytic Solutions, Detroit, MI
 Time Contour Plots David J. Corliss Magnify Analytic Solutions, Detroit, MI ABSTRACT This new SAS tool is two-dimensional color chart for visualizing changes in a population or system over time. Data for
Using PROC SGPLOT for Quick High-Quality Graphs
 Paper 154-2010 Using PROC SGPLOT for Quick High-Quality Graphs Susan J. Slaughter, Avocet Solutions, Davis, CA Lora D. Delwiche, University of California, Davis, CA ABSTRACT New with SAS 9.2, ODS Graphics
Making Presentations More Fun with DATA Step Graphics Interface (DSGI) Hui-Ping Chen, Eli Lilly and Company, Indianapolis, Indiana
 Hui-Ping Chen, Eli Lilly and Company, Indianapolis, Indiana") Paper CC03 Making Presentations More Fun with DATA Step Graphics Interface (DSGI) Hui-Ping Chen, Eli Lilly and Company, Indianapolis, Indiana ABSTRACT Microsoft PowerPoint is powerful and most popular
Paper CC03 Making Presentations More Fun with DATA Step Graphics Interface (DSGI) Hui-Ping Chen, Eli Lilly and Company, Indianapolis, Indiana ABSTRACT Microsoft PowerPoint is powerful and most popular
Paper Time Contour Plots. David J. Corliss, Wayne State University / Physics and Astronomy
 ABSTRACT Paper 1311-2014 Time Contour Plots David J. Corliss, Wayne State University / Physics and Astronomy This new SAS tool is two-dimensional color chart for visualizing changes in a population or
Data Driven Annotations: An Introduction to SAS/GRAPH s Annotate Facility
 Paper HW03 Data Driven Annotations: An Introduction to SAS/GRAPH s Annotate Facility Arthur L. Carpenter California Occidental Consultants ABSTRACT When SAS/GRAPH was first introduced, it was the only
NEW FEATURES IN FOUNDATION SAS 9.4 CYNTHIA JOHNSON CUSTOMER LOYALTY
 NEW FEATURES IN FOUNDATION SAS 9.4 CYNTHIA JOHNSON CUSTOMER LOYALTY FOUNDATION SAS WHAT S NEW IN 9.4 Agenda Base SAS SAS/ACCESS Interface to PC Files SAS Support for Hadoop SAS/GRAPH SAS Studio BASE SAS
From Clicking to Coding: Using ODS Graphics Designer as a Tool to Learn Graph Template Language
 MWSUG 2018 - SP-075 From Clicking to Coding: Using ODS Graphics Designer as a Tool to Learn Graph Template Language ABSTRACT Margaret M. Kline, Grand Valley State University, Allendale, MI Daniel F. Muzyka,
Graphing Made Easy with SGPLOT and SGPANEL Procedures
 Paper 2441-2015 Graphing Made Easy with SGPLOT and SGPANEL Procedures Susan J. Slaughter, Avocet Solutions, Davis, CA Lora D. Delwiche, University of California, Davis, CA ABSTRACT When ODS Graphics was
Contents. Tutorials Section 1. About SAS Enterprise Guide ix About This Book xi Acknowledgments xiii
 Contents About SAS Enterprise Guide ix About This Book xi Acknowledgments xiii Tutorials Section 1 Tutorial A Getting Started with SAS Enterprise Guide 3 Starting SAS Enterprise Guide 3 SAS Enterprise
INTRODUCTION TO THE SAS ANNOTATE FACILITY
 Improving Your Graphics Using SAS/GRAPH Annotate Facility David J. Pasta, Ovation Research Group, San Francisco, CA David Mink, Ovation Research Group, San Francisco, CA ABSTRACT Have you ever created
Picturing Statistics Diana Suhr, University of Northern Colorado
 Picturing Statistics Diana Suhr, University of Northern Colorado Abstract Statistical results could be easier to understand if you visualize them. This Hands On Workshop will give you an opportunity to
Producing Summary Tables in SAS Enterprise Guide
 Producing Summary Tables in SAS Enterprise Guide Lora D. Delwiche, University of California, Davis, CA Susan J. Slaughter, Avocet Solutions, Davis, CA ABSTRACT This paper shows, step-by-step, how to use
Presentation Quality Graphics with SAS/GRAPH
 Presentation Quality Graphics with SAS/GRAPH Keith Cranford, Marquee Associates, LLC Abstract The SASI GRAP~ Annotate Facilily along with hardware fonts can be used to produce presentation qualily graphics
A Juxtaposition of Tables and Graphs Using SAS /GRAPH Procedures
 A Juxtaposition of Tables and Graphs Using SAS /GRAPH Procedures Suhas R. Sanjee, MaxisIT Inc., Edison, NJ Sheng Zhang, Merck and Co., Upper Gwynedd, PA ABSTRACT Graphs provide high-impact visuals that
Contents About SAS Enterprise Guide About This Book xi Acknowledgments xiii
 The Little SAS Enterprise Guide Book. Full book available for purchase here. Contents About SAS Enterprise Guide About This Book xi Acknowledgments xiii ix Tutorials Section 1 Tutorial A Getting Started
Modifying Graphics in SAS
 Modifying Graphics in SAS Statistics 135 Autumn 2005 Copyright c 2005 by Mark E. Irwin Modifying Graphs As in S, it is possible to modify fonts, colours, symbols, lines, etc in SAS. The approach is a bit
An Introduction to ODS for Statistical Graphics in SAS 9.1 Robert N. Rodriguez SAS Institute Inc., Cary, North Carolina, USA
 An Introduction to ODS for Statistical Graphics in SAS 9.1 Robert N. Rodriguez SAS Institute Inc., Cary, North Carolina, USA ABSTRACT In SAS 9.1, over two dozen SAS/STAT and SAS/ETS procedures have been
PharmaSUG 2015 Paper PO03
 PharmaSUG 2015 Paper P03 A Visual Reflection on SAS/GRAPH History: Plot, Gplot, Greplay, and Sgrender Haibin Shu, AccuClin Global Services LLC, Wayne, PA John He, AccuClin Global Services LLC, Wayne, PA
SAS Studio: A New Way to Program in SAS
 SAS Studio: A New Way to Program in SAS Lora D Delwiche, Winters, CA Susan J Slaughter, Avocet Solutions, Davis, CA ABSTRACT SAS Studio is an important new interface for SAS, designed for both traditional
Arthur L. Carpenter California Occidental Consultants
 Paper HOW-004 SAS/GRAPH Elements You Should Know Even If You Don t Use SAS/GRAPH Arthur L. Carpenter California Occidental Consultants ABSTRACT We no longer live or work in a line printer - green bar paper
Converting Annotate to ODS Graphics. Is It Possible?
 ABSTRACT Paper 2686-2015 Converting Annotate to ODS Graphics. Is It Possible? Philip R Holland, Holland Numerics Limited In the previous chapter I described how many standard SAS/GRAPH plots can be converted
SAS Studio 4.4: User s Guide
 SAS Studio 4.4: User s Guide SAS Documentation July 6, 2018 The correct bibliographic citation for this manual is as follows: SAS Institute Inc. 2018. SAS Studio 4.4: User s Guide. Cary, NC: SAS Institute
IMPROVING A GRAPH USING PROC GPLOT AND THE GOPTIONS STATEMENT
 SESUG Paper 33-2017 IMPROVING A GRAPH USING PROC GPLOT AND THE GOPTIONS STATEMENT Wendi Wright, Questar Assessment, Inc. ABSTRACT Starting with a SAS PLOT program, we will transfer this plot into PROC
Information Visualization
 Paper 166-25 Presenting Your Data Easily with Graph-N-Go Curtis A. Smith, Defense Contract Audit Agency, La Mirada, CA ABSTRACT Visualizing and presenting data effectively using reports and listings can
Introduction to ODS Statistical Graphics
 Paper BB-277 Introduction to ODS Statistical Graphics Kirk Paul Lafler, Software Intelligence Corporation, Spring Valley, California Abstract Delivering timely and quality looking reports, graphs and information
SAS: Proc GPLOT. Computing for Research I. 01/26/2011 N. Baker
 SAS: Proc GPLOT Computing for Research I 01/26/2011 N. Baker Introduction to SAS/GRAPH Graphics component of SAS system. Includes charts, plots, and maps in both 2 and 3 dimensions. Procedures included
The GANNO Procedure. Overview CHAPTER 12
 503 CHAPTER 12 The GANNO Procedure Overview 503 Procedure Syntax 504 PROC GANNO Statement 504 Examples 507 Example 1: Scaling Data-Dependent Output 507 Example 2: Storing Annotate Graphics 509 Example
ODS and Web Enabled Device Drivers: Displaying and Controlling Large Numbers of Graphs. Arthur L. Carpenter and Richard O. Smith Data Explorations
 ODS and Web Enabled Device Drivers: Displaying and Controlling Large Numbers of Graphs Arthur L. Carpenter and Richard O. Smith Data Explorations ABSTRACT With the advent of the Output Delivery System,
Introducing Statistical Graphics (SG): Victoria UG May 2018 Mary Harding SAS Canada
: Victoria UG May 2018 Mary Harding SAS Canada") Introducing Statistical Graphics (SG): Victoria UG May 2018 Mary Harding SAS Canada Copyright SAS Institute Inc. All rights reserved. Agenda Introduction to Statistical Graphics PROC SGPLOT General purpose
Introducing Statistical Graphics (SG): Victoria UG May 2018 Mary Harding SAS Canada Copyright SAS Institute Inc. All rights reserved. Agenda Introduction to Statistical Graphics PROC SGPLOT General purpose
Chapter 27 Saving and Printing Graphics
 Chapter 27 Saving and Printing Graphics Chapter Table of Contents CHOOSING FONTS...404 SETTING DISPLAY OPTIONS...406 SAVING GRAPHICS...407 SavingGraphicsCatalogs...407 SavingGraphicsFiles...408 PRINTING...410
Fly over, drill down, and explore
 ABSTRACT Paper 79-2013 Fly over, drill down, and explore Suzanne Brown, HealthInsight New Mexico, Albuquerque, NM Data often have a spatial dimension, whether it is a five-year financial plan and annual
When Simpler is Better Visualizing Laboratory Data Using SG Procedures Wei Cheng, Isis Pharmaceuticals, Inc., Carlsbad, CA
 When Simpler is Better Visualizing Laboratory Data Using SG Procedures Wei Cheng, Isis Pharmaceuticals, Inc., Carlsbad, CA ABSTRACT In SAS 9.2, SAS/GRAPH introduces a family of new procedures to create
ABSTRACT INTRODUCTION THE ODS TAGSET FACILITY
 Graphs in Flash Using the Graph Template Language Himesh Patel, SAS Institute Inc., Cary, NC David Kelley, SAS Institute Inc., Cary, NC Dan Heath, SAS Institute Inc., Cary, NC ABSTRACT The Graph Template
1182 Index. batch mode 28 BCOLOR= option TITLE, FOOTNOTE, and NOTE statements
 Index 1181 Index A ACROSS= option DONUT statement 561 LEGEND statement 188 PIE/PIE3D statements 561 STAR statement 575 action statements 22 ActiveX controls 104 ADD statement, GDEVICE procedure optional
Creating Maps in SAS/GRAPH
 Creating Maps in SAS/GRAPH By Jeffery D. Gilbert, Trilogy Consulting Corporation, Kalamazoo, MI Abstract This paper will give an introduction to creating graphs using the PROC GMAP procedure in SAS/GRAPH.
Effective Forecast Visualization With SAS/GRAPH Samuel T. Croker, Lexington, SC
 DP01 Effective Forecast Visualization With SAS/GRAPH Samuel T. Croker, Lexington, SC ABSTRACT A statistical forecast is useless without sharp, attractive and informative graphics to present it. It is really
Visual Storytelling The Art of Communicating Information with Graphics
 Visual Storytelling The Art of Communicating Information with Graphics Kirk Paul Lafler, Software Intelligence Corporation, Spring Valley, California Abstract Telling a story with facts and data alone
Multiple Graphical and Tabular Reports on One Page, Multiple Ways to Do It Niraj J Pandya, CT, USA
 Paper TT11 Multiple Graphical and Tabular Reports on One Page, Multiple Ways to Do It Niraj J Pandya, CT, USA ABSTRACT Creating different kind of reports for the presentation of same data sounds a normal
2997 Yarmouth Greenway Drive, Madison, WI Phone: (608) Web:
 Web:") Getting the Most Out of SAS Enterprise Guide 2997 Yarmouth Greenway Drive, Madison, WI 53711 Phone: (608) 278-9964 Web: www.sys-seminar.com 1 Questions, Comments Technical Difficulties: Call 1-800-263-6317
Getting the Most Out of SAS Enterprise Guide 2997 Yarmouth Greenway Drive, Madison, WI 53711 Phone: (608) 278-9964 Web: www.sys-seminar.com 1 Questions, Comments Technical Difficulties: Call 1-800-263-6317
AURA ACADEMY SAS TRAINING. Opposite Hanuman Temple, Srinivasa Nagar East, Ameerpet,Hyderabad Page 1
 SAS TRAINING SAS/BASE BASIC THEORY & RULES ETC SAS WINDOWING ENVIRONMENT CREATION OF LIBRARIES SAS PROGRAMMING (BRIEFLY) - DATASTEP - PROC STEP WAYS TO READ DATA INTO SAS BACK END PROCESS OF DATASTEP INSTALLATION
ODS The output delivery system
 SAS Lecture 6 ODS and graphs ODS The output delivery system Aidan McDermott, May 2, 2006 1 2 The output delivery system During the 1990 s SAS introduced a more extensive way of dealing with SAS output
Data Annotations in Clinical Trial Graphs Sudhir Singh, i3 Statprobe, Cary, NC
 PharmaSUG2010 - Paper TT16 Data Annotations in Clinical Trial Graphs Sudhir Singh, i3 Statprobe, Cary, NC ABSTRACT Graphical representation of clinical data is used for concise visual presentations of
Six Cool Things You Can Do In Display Manager Jenine Milum, Charlotte, NC Wachovia Bank
 Paper CC-029 Six Cool Things You Can Do In Display Manager Jenine Milum, Charlotte, NC Wachovia Bank ABSTRACT Many people use Display Manager but don t realize how much work it can actually do for you.
New SAS/GRAPH Procedures for Creating Statistical Graphics in Data Analysis Dan Heath, SAS Institute Inc., Cary, NC
 ABSTRACT Paper 193-2007 New SAS/GRAPH Procedures for Creating Statistical Graphics in Data Analysis Dan Heath, SAS Institute Inc., Cary, NC Making a plot of the data is often the first step in a data analysis
Chapter 1 Introduction. Chapter Contents
 Chapter 1 Introduction Chapter Contents OVERVIEW OF SAS/STAT SOFTWARE................... 17 ABOUT THIS BOOK.............................. 17 Chapter Organization............................. 17 Typographical
Is your picture worth a thousand words? Creating Effective Presentations with SAS/GRAPH
 Is your picture worth a thousand words? Creating Effective Presentations with SAS/GRAPH Justina M. Flavin, Pfizer Global Research & Development, La Jolla Laboratories, San Diego, CA Arthur L. Carpenter,
Internet/Intranet, the Web & SAS
 Dynamic Behavior from Static Web Applications Ted Durie, SAS, Overland Park, KS ABSTRACT Many Web applications, because of the infinite query combinations possible, require dynamic Web solutions. This
DIS: Design and imaging software
 Using IT productivity tools and applications This is the ability to use a software application designed to create, modify and layout artwork or images for display in print or on a screen (eg vector graphics
Beginning Tutorials. bt006 USING ODS. Ban Chuan Cheah, Westat, Rockville, MD. Abstract
 bt006 USING ODS Ban Chuan Cheah, Westat, Rockville, MD Abstract This paper will guide you, step by step, through some easy and not-so-easy ways to enhance your SAS output using the Output Delivery System
Multiple Forest Plots and the SAS System
 Multiple Forest Plots and the SAS System Poster 10 Anne Barfield, Quanticate, Manchester, United Kingdom ABSTRACT This paper is the accompanying paper to the poster entitled Multiple Forest Plots and the
Index COPYRIGHTED MATERIAL. Symbols and Numerics
 Symbols and Numerics ( ) (parentheses), in functions, 173... (double quotes), enclosing character strings, 183 #...# (pound signs), enclosing datetime literals, 184... (single quotes), enclosing character
SAS Enterprise Guide. Kathleen Nosal Yarmouth Greenway Drive Madison, WI (608)
") SAS Enterprise Guide Kathleen Nosal 2997 Yarmouth Greenway Drive Madison, WI 53711 (608) 278-9964 www.sys-seminar.com 1 Overview What is Enterprise Guide? Top five reasons you want to learn more about
SAS Enterprise Guide Kathleen Nosal 2997 Yarmouth Greenway Drive Madison, WI 53711 (608) 278-9964 www.sys-seminar.com 1 Overview What is Enterprise Guide? Top five reasons you want to learn more about
Techdata Solution. SAS Analytics (Clinical/Finance/Banking)
") +91-9702066624 Techdata Solution Training - Staffing - Consulting Mumbai & Pune SAS Analytics (Clinical/Finance/Banking) What is SAS SAS (pronounced "sass", originally Statistical Analysis System) is an
+91-9702066624 Techdata Solution Training - Staffing - Consulting Mumbai & Pune SAS Analytics (Clinical/Finance/Banking) What is SAS SAS (pronounced "sass", originally Statistical Analysis System) is an
Professional outputs with ODS LATEX
 Paper TU04 Professional outputs with ODS LATEX Arnaud DAUCHY, Sanofi Aventis, Paris, France Solenn LE GUENNEC, Sanofi Aventis, Paris, France ABSTRACT ODS tagset and ODS markup have been embedded from SAS
ODS GRAPHICS DESIGNER (Creating Templates for Batchable Graphs)
") ODS GRAPHICS DESIGNER (Creating Templates for Batchable Graphs) Golden Horseshoe SAS User Group October 14, 2011 Barry Hong BYHong@uss.com 2011 History of SAS Graphics In the beginning there was PROC PLOT
ODS GRAPHICS DESIGNER (Creating Templates for Batchable Graphs) Golden Horseshoe SAS User Group October 14, 2011 Barry Hong BYHong@uss.com 2011 History of SAS Graphics In the beginning there was PROC PLOT
Paper S Data Presentation 101: An Analyst s Perspective
 Paper S1-12-2013 Data Presentation 101: An Analyst s Perspective Deanna Chyn, University of Michigan, Ann Arbor, MI Anca Tilea, University of Michigan, Ann Arbor, MI ABSTRACT You are done with the tedious
SAS Visual Analytics 8.2: Getting Started with Reports
 SAS Visual Analytics 8.2: Getting Started with Reports Introduction Reporting The SAS Visual Analytics tools give you everything you need to produce and distribute clear and compelling reports. SAS Visual
Supplementary Materials of canvasdesigner
 Supplementary Materials of canvasdesigner Contents Web URLs to tools and online user guide... 2 SVG (Scalable Vector Graphics) files generated by canvasxpress... 3 Layout multiple SVG files by canvasdesigner...
I KNOW HOW TO PROGRAM IN SAS HOW DO I NAVIGATE SAS ENTERPRISE GUIDE?
 Paper HOW-068 A SAS Programmer s Guide to the SAS Enterprise Guide Marje Fecht, Prowerk Consulting LLC, Cape Coral, FL Rupinder Dhillon, Dhillon Consulting Inc., Toronto, ON, Canada ABSTRACT You have been
AGENDA. Water Resources Data Management with HEC-DSSVue
 AGENDA Hydrologic Engineering Center Training course on Water Resources Data Management with HEC-DSSVue Course Control Number #152 Davis, California This class is designed to provide Corps water resource
SGPANEL: Telling the Story Better Chuck Kincaid, COMSYS, Portage, MI
 SGPANEL: Telling the Story Better Chuck Kincaid, COMSYS, Portage, MI ABSTRACT SAS has a new set of graphics procedures called Statistical Graphics. They are built upon the Graphics Template Language (GTL)
Chapter 3. Determining Effective Data Display with Charts
 Chapter 3 Determining Effective Data Display with Charts Chapter Introduction Creating effective charts that show quantitative information clearly, precisely, and efficiently Basics of creating and modifying
Choosing the Right Procedure
 3 CHAPTER 1 Choosing the Right Procedure Functional Categories of Base SAS Procedures 3 Report Writing 3 Statistics 3 Utilities 4 Report-Writing Procedures 4 Statistical Procedures 6 Available Statistical
The Evolution of a SAS/GRAPH Application Jenine Eason, AutoTrader.com, Atlanta, GA
 Paper P05-04 The Evolution of a SAS/GRAPH Application Jenine Eason, AutoTrader.com, Atlanta, GA INTRODUCTION Graphs are an excellent way to represent any activity. The author is using web server errors
SAS/ASSIST Software Setup
 173 APPENDIX 3 SAS/ASSIST Software Setup Appendix Overview 173 Setting Up Graphics Devices 173 Setting Up Remote Connect Configurations 175 Adding a SAS/ASSIST Button to Your Toolbox 176 Setting Up HTML
SAS Report Viewer 8.2 Documentation
 SAS Report Viewer 8.2 Documentation About SAS Report Viewer SAS Report Viewer (the report viewer) enables users who are not report designers to view a report using a web browser. To open a report in the
Custom Map Displays Created with SAS/GRAPH Procedures and the Annotate Facility Debra Miller, National Park Service, Denver, CO
 Paper 134-28 Custom Map Displays Created with SAS/GRAPH Procedures and the Annotate Facility Debra Miller, National Park Service, Denver, CO ABSTRACT The Annotate facility is a flexible system that you
MANAGING SAS/GRAPH DISPLAYS WITH THE GREPLAY PROCEDURE. Perry Watts IMS Health
 MANAGING SAS/GRAPH DISPLAYS WITH THE PROCEDURE Perry Watts IMS Health Abstract PROC is used for redisplaying graphs that have been stored in temporary or permanent catalogs. This tutorial will show how
SAS (Statistical Analysis Software/System)
") SAS (Statistical Analysis Software/System) SAS Analytics:- Class Room: Training Fee & Duration : 23K & 3 Months Online: Training Fee & Duration : 25K & 3 Months Learning SAS: Getting Started with SAS Basic
SAS (Statistical Analysis Software/System) SAS Analytics:- Class Room: Training Fee & Duration : 23K & 3 Months Online: Training Fee & Duration : 25K & 3 Months Learning SAS: Getting Started with SAS Basic