ICE/FIRE Analyzer Programming Dialog
|
|
|
- Melvin Phillips
- 5 years ago
- Views:
Transcription
1 ICE/FIRE Analyzer Programming Dialog TRACE32 Online Help TRACE32 Directory TRACE32 Index TRACE32 Documents... FIRE In-Circuit Emulator... ICE Analyzer System... FIRE Analyzer Programming... ICE/FIRE Analyzer Programming Dialog... 1 Introduction... 2 How to Start 2 Programming... 3 Elements in the Dialog Box 3 Actions 4 Conditions 6 Levels 7 Load, Save and Clear 7 Definitions 9 Address/Range Definition 9 Data Definition 12 Counter Definition 15 Examples 18 Example 1: Selective Trace on a Single Address 18 Example 2: Selective Trace on a Symbol 19 Example 3: Selective Trace on an Address Range 21 Example 4: Selective Trace on an Address Range defined through a Symbol 22 Example 5: Selective Trace on Write Access to a Symbol 24 Example 6: Selective Trace on Value on Data Bus 26 Example 7: Trace all and mark with Label A beginning from 2 µs 28 Example 8: Trace all, mark the Cycles executed in Function Sieve with Label B and mark the Entrance of Function Sieve with Label A 30 Example 9: Trace all, when Function Sieve is reached goto Level 1 and stop Sampling and Debugging after 5 Cycles 31 ICE/FIRE Analyzer Programming Dialog 1
2 ICE/FIRE Analyzer Programming Dialog Version 14-Nov-2018 Introduction How to Start The Analyzer Programming Dialog can be found on any TRACE32 CD dated May 1999 and later. To start select under the menu Analyzer the option Trigger Definition > Dialog. An empty dialog box will appear. Please go on reading this manual to get an overview on the functionality of the dialog. ICE/FIRE Analyzer Programming Dialog 2

3 Programming Elements in the Dialog Box Remark The intension of the Analyzer Programming Dialog Window is to provide an intuitive and easy to use interface to program the Analyzer Trigger Unit. The Analyzer Programming Dialog Window does not represent the full functionality of the Analyzer Trigger Unit. Overview Address definition Data definition Count definition Condition Pannel to controll the programming ICE/FIRE Analyzer Programming Dialog 3

4 Actions Actions ICE/FIRE Analyzer Programming Dialog 4
5 An Analyzer Trigger Program executes ACTIONS depending on the current situation of the user program/target hardware. Sample Stop Analyzer Stop CPU&Analyzer Mark A Mark B Mark C Inc Count0 Inc Count1 Restart Count0 Restart Count1 Goto Level0 Goto Level1 Goto Level2 Samples only the specified CPU cycles (Selective Tracing) Stops tracing Stops CPU and tracing Put a marker with label A, B or C to the line in the trace output Increment the counter identified by the label COUNT0 or COUNT1. Set the counter identified by the label COUNT0 or COUNT1 to zero. Go on tracing according to the actions defined under Level0, Level1 or Level2. ICE/FIRE Analyzer Programming Dialog 5

6 Conditions One situation of the user program/target system is described by different characteristics. Different characteristics combinded throught LOGICAL AND form a definite condition. An action will only be carried out if the program/target system reaches the situation defined through the condition. The characteristics are: Address/Range RD/WR Data Count Address or address range To be defined in the address definition fields A-Range, B-Range or C-Range CPU cycle type READ, WRITE or ACCESS (READ or WRITE) CPU data To be defined in the data definition fields DATA0 or DATA1 Counter or Time Counter To be defined in the count definition fields COUNT0 or COUNT1 If no characteristic is chosen the action is carried out at every CPU cycle. ICE/FIRE Analyzer Programming Dialog 6

7 Levels Three different levels can be used to define a set of actions. The levels can be referenced by the logical names Level0, Level1 and Level2. At any time only one of this sets of actions can be carried out. Use the action Goto Level1 to let the system carry out only the actions under Level1 beginning from a definite condition. For this example all CPU cycles are collected and marked with label A in the output until the address A- Range is reached. From that time on all CPU cycles are collected and marked with label B in the output. Load, Save and Clear At the bottom of the dialog you find the buttons to controll where your dialog will be stored. Use the button CLEAR to reset the dialog window if you want to begin from the scratch. With the button LOAD an analyzer program can be read into the dialog window. Only analyzer programs written with the Analyzer Dialog can be loaded into the dialog again. Press the button VIEW and you will see the contents of the dialog written down in statements of the analyzer programming language. Use this button now and then to learn the basics of the analyzer programming language. ICE/FIRE Analyzer Programming Dialog 7

8 Program Analyzer will write the contents of the dialog to the file which is specified under Actual used file:. After that the analyzer will be programmed. If no file name is given you will be asked to define one. The analyzer is successfully programmed if you get the message Otherwise a message box shows the error. Special for C166 Before the analyzer is programmed you will be asked Press OK if you want to go on programming the analyzer. But be aware that all breakpoints you set before will be deleted. Program Analyzer & Close works the same as Program Analyzer except that the dialog will be closed after the analyzer is programmed successfully. ICE/FIRE Analyzer Programming Dialog 8


9 Definitions Address/Range Definition Up to three diffent address areas can be defined in this part of the dialog. This areas are later referenced by the logical names A-Range, B-Range or C-Range. The logical name AB-Range defines an area declared throught the area A-Range combined with the area B-Range by LOGICAL AND. Each area e.g. A-Range allows to define the address space throught tree different singular address parts. One of this part can hold a single address or an address range. All three singular address parts are combinded throught LOGICAL OR to form the charcteristic named A-Range. If you don t know how to specify an address or an address range just click the V button. With the appearing subdialog a single address or any kind of range can be defined easily. ICE/FIRE Analyzer Programming Dialog 9


10 As you are familiar with the syntax of defining an address in TRACE32 just fill out the dialog. The defined address area will be used to define the condition for carrying out an action in the main dialog. If not address area is defined at the time you want to choose an address area name you will be asked to do so. ICE/FIRE Analyzer Programming Dialog 10

11 ICE/FIRE Analyzer Programming Dialog 11


12 Data Definition Two different data values can be used to observe the data on the databus. The data values are later referenced by the labels DATA0 and DATA1. The data is defined through the value and the type. If you don t know how to specify a data value just click the V button. With the appearing subdialog a single data, a data range or a mask can be defined easily. ICE/FIRE Analyzer Programming Dialog 12
13 With the type you specify the width of the value and the position on the databus. Depending on your CPU you have different types available. Databus 8 bit B Byte size and whole databus Databus 16 bit B B0 B1 W0 W Byte size and anywhere on the databus Byte size and at the lower byte of the data bus Byte size and at the upper byte of the data bus Word size and lower word on data bus Word size and any position on data bus Databus 32 bit B B0 B1 B2 B3 W0 W1 W2 W L0 L Byte size and anywhere on the databus Byte size and at the lower byte of the lower word on data bus Byte size and at the upper byte of the lower word on data bus Byte size and at the lower byte of the upper word on data bus Byte size and at the upper byte of the upper word on data bus Word size and lower word on data bus Word size and middle word on data bus Word size and upper word on data bus Word size and any position on data bus Double word size and lower double word on data bus Double word size and any position on data bus For details on other data types see Analyzer Programming Guide chapter Data Selectors. ICE/FIRE Analyzer Programming Dialog 13


14 As you are familiar with the syntax of defining data in TRACE32 just fill out the dialog. If there is no data defined at the time you want to use a data name you will be asked to do so. ICE/FIRE Analyzer Programming Dialog 14


15 Counter Definition For controlling the flow two different counters can be defined. For each counter you can define the maximum value and if you want to define the counter as time counter the unit. The counters are referenced in the condition of an action by the labels COUNT0 and COUNT1. If you use the COUNT0/1 in the way showed above the sampling begins when the counter COUNT0 has reached the value of 12 ks. But as there are no actions defined to set the counter COUNT0 this will never happen. To control the value of the counters the actions Inc Count0/1 and Restart Count0/1 are available. ICE/FIRE Analyzer Programming Dialog 15


16 Inc COUNT0/1 adds 1 to the value of the counter COUNT0/1. Restart COUNT0/1 sets the value of the counter COUNT0/1 to zero. If you don t know how to define the value of a counter just click the V button. As you are familiar with the syntax of defining counters in TRACE32 just fill out the dialog. If there is no counter defined at the time you want to use a counter name in a condition or an action you will be asked to define it. ICE/FIRE Analyzer Programming Dialog 16

17 ICE/FIRE Analyzer Programming Dialog 17


18 Examples Example 1: Selective Trace on a Single Address Click here to open the Define Address Window Enter the address and confirm with OK. ICE/FIRE Analyzer Programming Dialog 18

19 Example 2: Selective Trace on a Symbol Click here to open the Define Address Window Click here to browse through the symbol data base Select the symbol by a double click ICE/FIRE Analyzer Programming Dialog 19

20 ICE/FIRE Analyzer Programming Dialog 20


21 Example 3: Selective Trace on an Address Range Click here to open the Define Address Window 1. Click here to select the radio button for Range 2. Click here to choose a memory class out of the list of available classes 3. Type in the base address of the range 4. Type in the end address of the range 5. Press OK button ICE/FIRE Analyzer Programming Dialog 21


22 Example 4: Selective Trace on an Address Range defined through a Symbol Click here to open the Define Address Window Click here to select the radio button for HLL-Range Select the symbol by a double click Press the V button ICE/FIRE Analyzer Programming Dialog 22

23 ICE/FIRE Analyzer Programming Dialog 23


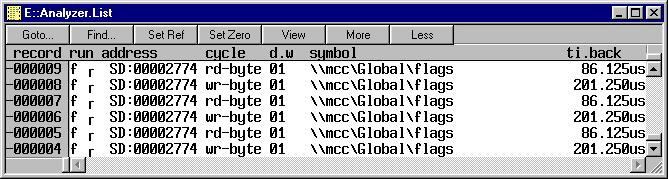
24 Example 5: Selective Trace on Write Access to a Symbol Click here to open the Define Address Window Click here to browse through the symbol data base Select the symbol by a double click ICE/FIRE Analyzer Programming Dialog 24


25 ICE/FIRE Analyzer Programming Dialog 25

26 Example 6: Selective Trace on Value on Data Bus Click here to open the Define Data Window Click here to select the width of the value Type in the value Click here to select a single value Press OK ICE/FIRE Analyzer Programming Dialog 26

27 ICE/FIRE Analyzer Programming Dialog 27


28 Example 7: Trace all and mark with Label A beginning from 2 µs Click here to open the Define Counter Window Click here to select a Time Counter Type in the value Click here to select time unit ICE/FIRE Analyzer Programming Dialog 28

29 ICE/FIRE Analyzer Programming Dialog 29


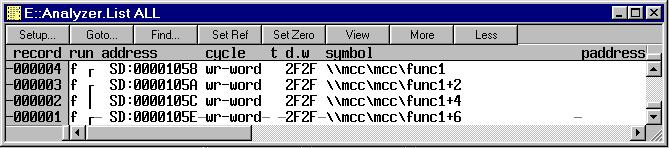
30 Example 8: Trace all, mark the Cycles executed in Function Sieve with Label B and mark the Entrance of Function Sieve with Label A Define the begin of function sieve as A-Range Define the end of function sieve as B-Range Display was cut here ICE/FIRE Analyzer Programming Dialog 30
 ICE/FIRE Analyzer Programming Dialog")
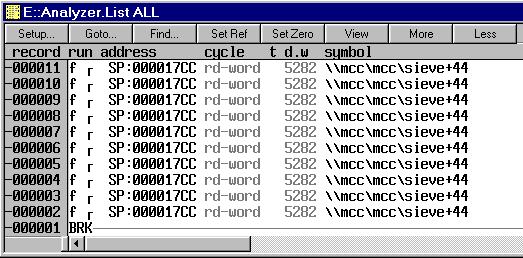
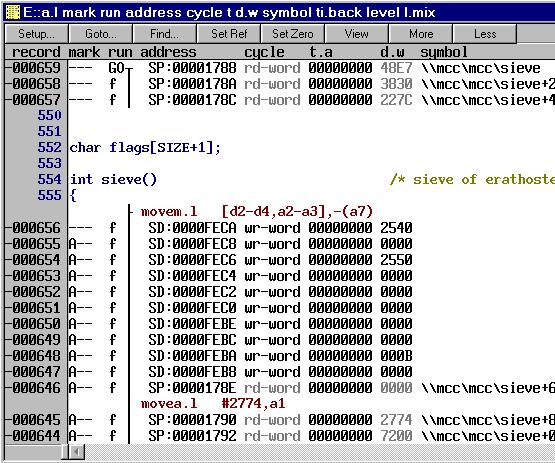
31 Example 9: Trace all, when Function Sieve is reached goto Level 1 and stop Sampling and Debugging after 5 Cycles Define the begin of function sieve in A-Range Change level if sieve is reached Always set COUNT0 to zero Add one to COUNT0 every cycle Stop sampling and debugging when COUNT0 reaches 5 (decimal) ICE/FIRE Analyzer Programming Dialog 31


32 Debugger stops here Level is changed Sampling stops here ICE/FIRE Analyzer Programming Dialog 32
ARM-ETM Programming Dialog
 ARM-ETM Programming Dialog TRACE32 Online Help TRACE32 Directory TRACE32 Index TRACE32 Documents... ICD In-Circuit Debugger... Processor Architecture Manuals... ARM/CORTEX/XSCALE... ARM-ETM Programming
TRACE32 Getting Started... ICD In-Circuit Debugger Getting Started... ICD Introduction... 1
 ICD Introduction TRACE32 Online Help TRACE32 Directory TRACE32 Index TRACE32 Getting Started... ICD In-Circuit Debugger Getting Started... ICD Introduction... 1 Introduction... 2 What is an In-Circuit
TRACE32 Debugger Getting Started... ICD Tutorial About the Tutorial... 2
 ICD Tutorial TRACE32 Online Help TRACE32 Directory TRACE32 Index TRACE32 Debugger Getting Started... ICD Tutorial... 1 About the Tutorial... 2 Working with the Debugger... 3 Set up the Program Environment
An Introduction to Komodo
 An Introduction to Komodo The Komodo debugger and simulator is the low-level debugger used in the Digital Systems Laboratory. Like all debuggers, Komodo allows you to run your programs under controlled
_ V Renesas R8C In-Circuit Emulation. Contents. Technical Notes
 _ V9.12. 225 Technical Notes Renesas R8C In-Circuit Emulation This document is intended to be used together with the CPU reference manual provided by the silicon vendor. This document assumes knowledge
TRACE32 Documents... ICD In-Circuit Debugger... Processor Architecture Manuals... NS NS32000 Monitor... 1
 NS32000 Monitor TRACE32 Online Help TRACE32 Directory TRACE32 Index TRACE32 Documents... ICD In-Circuit Debugger... Processor Architecture Manuals... NS32000... NS32000 Monitor... 1 Brief Overview of Documents
Chapter 12 Visual Program Debugger
 Chapter 12 Visual Program Debugger In the previous chapter on programs a section titled Getting programs to do what you want discussed using the log to trace how programs execute. That is a useful technique
Training Simulator and Demo Software
 Training Simulator and Demo Software TRACE32 Online Help TRACE32 Directory TRACE32 Index TRACE32 Training... Training Simulator and Demo Software... 1 About the Demo... 2 Starting the TRACE32 Simulator...
Renesas 78K/78K0R/RL78 Family In-Circuit Emulation
 _ Technical Notes V9.12.225 Renesas 78K/78K0R/RL78 Family In-Circuit Emulation This document is intended to be used together with the CPU reference manual provided by the silicon vendor. This document
Changing the Embedded World TM. Module 3: Getting Started Debugging
 Changing the Embedded World TM Module 3: Getting Started Debugging Module Objectives: Section 1: Introduce Debugging Techniques Section 2: PSoC In-Circuit Emulator (ICE) Section 3: Hands on Debugging a
Freescale Semiconductor, Inc.
 Hitex Emulator Target Interface Product Manual Manual Date HITEX Emulator Target Interface Nov 2002 Contents 3 Contents Freescale Semiconductor, Inc. Hitex Target Interface...........................5
NEW CEIBO DEBUGGER. Menus and Commands
 NEW CEIBO DEBUGGER Menus and Commands Ceibo Debugger Menus and Commands D.1. Introduction CEIBO DEBUGGER is the latest software available from Ceibo and can be used with most of Ceibo emulators. You will
Integration for CodeWright
 Integration for CodeWright TRACE32 Online Help TRACE32 Directory TRACE32 Index TRACE32 Documents... 3rd Party Tool Integrations... Integration for CodeWright... 1 Overview... 2 Brief Overview of Documents
ICE Performance Analyzer User s Guide
 ICE Performance Analyzer User s Guide TRACE32 Online Help TRACE32 Directory TRACE32 Index TRACE32 Documents... ICE In-Circuit Emulator... ICE Analyzer System... ICE Performance Analyzer User's Guide...
AN1369 APPLICATION NOTE
 AN1369 APPLICATION NOTE GETTING STARTED WITH RAISONANCE IDE FOR THE ST6 MICROCONTROLLER by Microcontroller Division Applications INTRODUCTION Ride is the development toolchain for ST62 developed by Raisonance.
Application Note for the SNOOPer Trace
 Application Note for the SNOOPer Trace TRACE32 Online Help TRACE32 Directory TRACE32 Index TRACE32 Documents... Trace Analysis... Trace Application Notes... Application Note for the SNOOPer Trace... 1
NEC 78K0- Family On-Chip Emulation
 _ Technical Notes V9.9.86 NEC 78K0- Family On-Chip Emulation Contents Contents... 1 1 Introduction... 2 2 Emulation options... 3 2.1 Hardware Options... 3 3 CPU Setup... 6 3.1 General Options... 6 3.2
MPLAB SIM. MPLAB IDE Software Simulation Engine Microchip Technology Incorporated MPLAB SIM Software Simulation Engine
 MPLAB SIM MPLAB IDE Software Simulation Engine 2004 Microchip Technology Incorporated MPLAB SIM Software Simulation Engine Slide 1 Welcome to this web seminar on MPLAB SIM, the software simulator that
Trace Getting Started V8.02
 Trace Getting Started V8.02 1. Introduction This paper helps the user to entirely exploit the trace and troubleshoot most often situations that the developer is confronted with while debugging the application.
file://c:\documents and Settings\degrysep\Local Settings\Temp\~hh607E.htm
 Page 1 of 18 Trace Tutorial Overview The objective of this tutorial is to acquaint you with the basic use of the Trace System software. The Trace System software includes the following: The Trace Control
TDT 1.2 Release Notes and FAQ March 2002
 TDT 1.2 Release Notes and FAQ March 2002 This document gives additional information about the use of the ARM Trace Debug Tools TDT 1.2 (build 1031) For more information, please see the Trace Debug Tools
Integration for CodeBlocks
 Integration for CodeBlocks TRACE32 Online Help TRACE32 Directory TRACE32 Index TRACE32 Documents... 3rd Party Tool Integrations... Integration for CodeBlocks... 1 Overview... 2 Supported Code::Blocks versions...
Programming in the MAXQ environment
 AVAILABLE The in-circuit debugging and program-loading features of the MAXQ2000 microcontroller combine with IAR s Embedded Workbench development environment to provide C or assembly-level application
The following content has been imported from Legacy Help systems and is in the process of being checked for accuracy.
 Processor Debug Old Content - visit altium.com/documentation Modified by Admin on Nov 6, 2013 The following content has been imported from Legacy Help systems and is in the process of being checked for
H8 C-SPY. User Guide WINDOWS WORKBENCH VERSION
 H8 C-SPY User Guide WINDOWS WORKBENCH VERSION COPYRIGHT NOTICE Copyright 1998 IAR Systems. All rights reserved. No part of this document may be reproduced without the prior written consent of IAR Systems.
SMT107 User Manual User Manual (QCF42); Version 3.0, 8/11/00; Sundance Multiprocessor Technology Ltd. 1999
; Version 3.0, 8/11/00; Sundance Multiprocessor Technology Ltd. 1999") SMT107 User Manual User Manual (QCF42); Version 3.0, 8/11/00; Sundance Multiprocessor Technology Ltd. 1999 Version 1.2 Page 2 of 16 SMT107 User Manual Revision History Date Comments Engineer Version 20/04/01
SMT107 User Manual User Manual (QCF42); Version 3.0, 8/11/00; Sundance Multiprocessor Technology Ltd. 1999 Version 1.2 Page 2 of 16 SMT107 User Manual Revision History Date Comments Engineer Version 20/04/01
Introduction. This tutorial introduces the following SingleStep features:
 Introduction This tutorial introduces the following SingleStep features: Starting a debug session. Watching variables. Setting breakpoints. Modifying breakpoints. Stepping through a program. Changing variables
Lab 3-2: Exploring the Heap
 Lab 3-2: Exploring the Heap Objectives Become familiar with the Windows Embedded CE 6.0 heap Prerequisites Completed Lab 2-1 Estimated time to complete this lab: 30 minutes Lab Setup To complete this lab,
MCUez MMDS or MMEVS for HC05/08 ezstart GUIDE
 MCUEZQSG0508/D FEBRUARY 1998 MCUez MMDS or MMEVS for HC05/08 ezstart GUIDE Copyright 1998 MOTOROLA; All Rights Reserved Important Notice to Users While every effort has been made to ensure the accuracy
ADS MultiTrace Tutorial v2.0
 ADS MultiTrace Tutorial v2.0 ADS MultiTrace Tutorial 1 Introduction Aim This guide provides the user with a basic introduction to the ARM MultiTrace tools and some guidance for their initial setup and
This document describes support for OSEK operating system used with winidea.
 _ V1.2 TECHNICAL INFORMATION OSEK operating system Introduction This document describes support for OSEK operating system used with winidea. It assumes that: Hardware is configured properly, An OSEK builder
Table of Contents. Table of Contents... I. Table of Figures... III. Tutorial VIII-A Nesting Branch General Example...4
 Table of Contents Radiant Technologies, Inc. 2835D Pan American Freeway NE Albuquerque, NM 87107 Tel: 505-842-8007 Fax: 505-842-0366 e-mail: radiant@ferrodevices.com Table of Contents... I Table of Figures...
Section 1 AVR Studio User Guide
 Section 1 AVR Studio User Guide 1.1 Introduction Welcome to AVR Studio from Atmel Corporation. AVR Studio is a Development Tool for the AVR family of microcontrollers. This manual describes the how to
ZCRMZNICE01ZEMG Crimzon In-Circuit Emulator
 Quick Start Guide QS006602-0408 Introduction Zilog s ZCRMZNICE01ZEMG Crimzon (ICE), shown in Figure 1, provides Crimzon chip family emulation with a Trace and Event system for program debugging using Zilog
F²MC-8FX FAMILY MB95100 SERIES EMULATOR HW SETUP 8-BIT MICROCONTROLLER APPLICATION NOTE. Fujitsu Microelectronics Europe Application Note
 Fujitsu Microelectronics Europe Application Note MCU-AN-395002-E-V10 F²MC-8FX FAMILY 8-BIT MICROCONTROLLER MB95100 SERIES EMULATOR HW SETUP APPLICATION NOTE Revision History Revision History Date 2004-10-12
Quick-Start Guide. BNS Solutions. QSK62P Plus
 BNS Solutions Quick-Start Guide QSK62P Plus RS-232 Port Link LED 8-character x 2-line LCD Expansion Port (2) Reset Switch Power LED Thermistor I/O Ring (4) M16C MCU Analog Adjust Pot MCU Crystal Expansion
MULTIPROG QUICK START GUIDE
 MULTIPROG QUICK START GUIDE Manual issue date: April 2002 Windows is a trademark of Microsoft Corporation. Copyright 2002 by KW-Software GmbH All rights reserved. KW-Software GmbH Lagesche Straße 32 32657
Using the KD30 Debugger
 ELEC3730 Embedded Systems Tutorial 3 Using the KD30 Debugger 1 Introduction Overview The KD30 debugger is a powerful software tool that can greatly reduce the time it takes to develop complex programs
Lab 8: Debugging Embedded Devices and Software
 Lab 8: Debugging Embedded Devices and Software Summary: Given pre-written code, isolate code and functional errors to create a working memory interfacing program. Learning Objectives: Debug and fix pre-written
KIT-VR7701-TP. User's Manual(Rev.1.00) RealTimeEvaluator
 RealTimeEvaluator") User's Manual(Rev.1.00) RealTimeEvaluator Software Version Up * The latest RTE for Win32 (Rte4win32) can be down-loaded from following URL. http://www.midas.co.jp/products/download/english/program/rte4win_32.htm
User's Manual(Rev.1.00) RealTimeEvaluator Software Version Up * The latest RTE for Win32 (Rte4win32) can be down-loaded from following URL. http://www.midas.co.jp/products/download/english/program/rte4win_32.htm
DOMAIN TECHNOLOGIES. Getting Started Guide Version 1.1. BoxView IDE. Integrated Development Environment
 Getting Started Guide Version 1.1 BoxView IDE Integrated Development Environment Table of Contents INTRODUCTION...3 System Requirements...3 INSTALLATION...4 License Server...4 Registration...5 Node Locked
Assembly Programming in Atmel Studio 7 Step by Step Tutorial
 Assembly Programming in Atmel Studio 7 Step by Step Tutorial Sepehr Naimi BIHE University 12/1/2017 Contents Introduction... 2 Downloading and Installing Atmel Studio... 3 Opening Atmel Studio... 3 Creating
_ V ST STM8 Family On-Chip Emulation. Contents. Technical Notes
 _ V9.12. 225 Technical Notes ST STM8 Family On-Chip Emulation This document is intended to be used together with the CPU reference manual provided by the silicon vendor. This document assumes knowledge
ASSIGNMENT ECE514 (COMPUTER ORGANIZATION) ASSIGNMENT NO. 3
 ASSIGNMENT NO. 3") ASSIGNMENT ECE514 (COMPUTER ORGANIZATION) ASSIGNMENT NO. 3 This is an individual assignment for ECE514. It carries a mark of 10%. The rubric of marks is given in Appendix 3. This assignment is about designing
ASSIGNMENT ECE514 (COMPUTER ORGANIZATION) ASSIGNMENT NO. 3 This is an individual assignment for ECE514. It carries a mark of 10%. The rubric of marks is given in Appendix 3. This assignment is about designing
Hello and welcome to this Renesas Interactive module that provides an overview of the RX DMA Controller
 Hello and welcome to this Renesas Interactive module that provides an overview of the RX DMA Controller 1 The purpose of this Renesas Interactive module is to give you a basic understanding of the RX Direct
ZAP Cross Debuggers for Motorola Microcontrollers
 ZAP Cross Debuggers for Motorola Microcontrollers ZAP is a family of full-featured C and assembly language source-level debuggers designed to give Motorola embedded microcontroller developers a consistent
JCreator. Starting JCreator
 1 of 12 9/29/2005 2:31 PM JCreator JCreator is a commercial Java environment available from http://www.jcreator.com. Inexpensive academic licenses and a free "limited edition" are available. JCreator runs
embos Real-Time Operating System embos plug-in for IAR C-Spy Debugger Document: UM01025 Software Version: 3.0 Revision: 0 Date: September 18, 2017
 embos Real-Time Operating System embos plug-in for IAR C-Spy Debugger Document: UM01025 Software Version: 3.0 Revision: 0 Date: September 18, 2017 A product of SEGGER Microcontroller GmbH & Co. KG www.segger.com
PCAN-Explorer 6. Tel: Professional Windows Software to Communicate with CAN and CAN FD Busses. Software >> PC Software
 PCAN-Explorer 6 Professional Windows Software to Communicate with CAN and CAN FD Busses The PCAN-Explorer 6 is a versatile, professional program for working with CAN and CAN FD networks. The user is not
Profiling Applications and Creating Accelerators
 Introduction Program hot-spots that are compute-intensive may be good candidates for hardware acceleration, especially when it is possible to stream data between hardware and the CPU and memory and overlap
IAR C-SPY Hardware Debugger Systems User Guide. for Renesas E30A/E30 Emulators
 IAR C-SPY Hardware Debugger Systems User Guide for Renesas E30A/E30 Emulators COPYRIGHT NOTICE Copyright 2007 2009 IAR Systems AB. No part of this document may be reproduced without the prior written consent
Barracuda I and II Chips (I mask is OK36N and II mask is OK79X) PC9S12DP256
 PC9S12DP256") How To See the COP Watchdog Fire in the Nohau Trace Buffer with Motorola HCS12 Microcontrollers Application Note by Doron Fael & Robert Boys V2.6 January 16, 2002 Purpose This note demonstrates the Nohau
How To See the COP Watchdog Fire in the Nohau Trace Buffer with Motorola HCS12 Microcontrollers Application Note by Doron Fael & Robert Boys V2.6 January 16, 2002 Purpose This note demonstrates the Nohau
User Manual. LPC-StickView V3.0. for LPC-Stick (LPC2468) LPC2478-Stick LPC3250-Stick. Contents
 LPC2478-Stick LPC3250-Stick. Contents") User Manual LPC-StickView V3.0 for LPC-Stick (LPC2468) LPC2478-Stick LPC3250-Stick Contents 1 What is the LPC-Stick? 2 2 System Components 2 3 Installation 3 4 Updates 3 5 Starting the LPC-Stick View Software
User Manual LPC-StickView V3.0 for LPC-Stick (LPC2468) LPC2478-Stick LPC3250-Stick Contents 1 What is the LPC-Stick? 2 2 System Components 2 3 Installation 3 4 Updates 3 5 Starting the LPC-Stick View Software
KIT-VR5500-TP. User's Manual(Rev.2.02) RealTimeEvaluator
 RealTimeEvaluator") User's Manual(Rev.2.02) RealTimeEvaluator Software Version Up * The latest RTE for Win32 (Rte4win32) can be down-loaded from following URL. http://www.midas.co.jp/products/download/english/program/rte4win_32.htm
User's Manual(Rev.2.02) RealTimeEvaluator Software Version Up * The latest RTE for Win32 (Rte4win32) can be down-loaded from following URL. http://www.midas.co.jp/products/download/english/program/rte4win_32.htm
This chapter introduces how to use the emulator of TOPICE quickly.
 Quick Starting Summarization This chapter introduces how to use the emulator of TOPICE quickly. Compiling Source and Debugging Creating a New Project Select main menu Project, then choose the submenu New
Advanced Debugging using the Ashling MPC5500 tools
 Ashling Product Brief APB200 Advanced Debugging using the Ashling MPC5500 tools 1. Contents 1. Contents 1 2. Introduction 1 3. Break on Data Access 1 4. Tracing Accesses to a Variable 3 4.1 Cycle accurate
DDDA User Guide Version 1.5
 DDDA User Guide Version 1.5 email: DDDASupport@thinksrs.com Copyright 2002 Stanford Research Systems, Inc. All Rights Reserved. Table Of Contents CHAPTER 1 DDDA... 3 INTRODUCTION... 3 REGISTERING YOUR
In-Circuit Emulator. UNetICE for ARM
 In-Circuit Emulator UNetICE for ARM User Manual Version 1.0 Rorixwell Inc. Authorized distributor by Embest Info&Tech Tel: +1 (416) 757 0764 Fax: +1 (416) 757 0764 10 Electro Road, Toronto, ON, M1R 2A7,
IN-CIRCUIT DEBUG (ICD) USER GUIDE
 USER GUIDE") April 2003 IN-CIRCUIT DEBUG (ICD) USER GUIDE The Western Design Center, Inc., 2002 WDC TABLE OF CONTENTS 1. Introduction...3 2. Debug Port...4 3. The ICD Registers...4 4. ICDCTRL Register Bit Definitions...5
April 2003 IN-CIRCUIT DEBUG (ICD) USER GUIDE The Western Design Center, Inc., 2002 WDC TABLE OF CONTENTS 1. Introduction...3 2. Debug Port...4 3. The ICD Registers...4 4. ICDCTRL Register Bit Definitions...5
ICE Port Analyzer User s Guide
 ICE Port Analyzer User s Guide TRACE32 Online Help TRACE32 Directory TRACE32 Index TRACE32 Documents... ICE In-Circuit Emulator... ICE Port Analyzer User's Guide... 1 Basic Function... 2 Port Analyzer
Getting Started in C Programming with Keil MDK-ARM Version 5
 Getting Started in C Programming with Keil MDK-ARM Version 5 Reason for Revision This document was revised for Keil MDK-ARM v5.14 on February 18, 2015. This document was revised for MSP432 LaunchPad on
FR Family MB Emulator System Getting Started Guide
 FR Family MB2198-01 Emulator System Getting Started Guide Doc. No. 002-05222 Rev. *A Cypress Semiconductor 198 Champion Court San Jose, CA 95134-1709 http://www.cypress.com Copyrights Copyrights Cypress
Repetition and Loop Statements Chapter 5
 Repetition and Loop Statements Chapter 5 1 Chapter Objectives To understand why repetition is an important control structure in programming To learn about loop control variables and the three steps needed
RTOS Debugger for RTX-ARM
 RTOS Debugger for RTX-ARM TRACE32 Online Help TRACE32 Directory TRACE32 Index TRACE32 Documents... RTOS Debuggers... RTOS Debugger for RTX-ARM... 1 Overview... 2 Brief Overview of Documents for New Users...
embos Real-Time Operating System embos plug-in for IAR C-Spy Debugger Document: UM01025 Software Version: 3.1 Revision: 0 Date: May 3, 2018
 embos Real-Time Operating System Document: UM01025 Software Version: 3.1 Revision: 0 Date: May 3, 2018 A product of SEGGER Microcontroller GmbH www.segger.com 2 Disclaimer Specifications written in this
TRACE32 Documents... ICD In-Circuit Debugger... Processor Architecture Manuals... TriCore... TriCore Monitor... 1
 TriCore Monitor TRACE32 Online Help TRACE32 Directory TRACE32 Index TRACE32 Documents... ICD In-Circuit Debugger... Processor Architecture Manuals... TriCore... TriCore Monitor... 1 Brief Overview of Documents
ZAP Cross Debuggers for STMicroelectronics Microcontrollers
 ZAP Cross Debuggers for STMicroelectronics Microcontrollers ZAP is a family of full-featured C and assembly language source-level debuggers designed to give STMicroelectronics embedded microcontroller
1 Introduction to MARS
 1 Introduction to MARS 1.1 Objectives After completing this lab, you will: Get familiar with the MARS simulator Learn how to assemble, run, and debug a MIPS program 1.2 The MARS Simulator MARS, the MIPS
EMUL-AVR-PC. User Guide
 EMUL-AVR-PC User Guide Nohau Corporation 51 E. Campbell Ave. Campbell, CA 95008 PH: (408) 866-1820 Fax: (408) 378-7869 E-mail: support@nohau.com www.nohau.com EMUL AVR PC User Guide Edition 1, July 24,
KIT-VR4120-TP. User's Manual (Rev.1.01) RealTimeEvaluator
 RealTimeEvaluator") User's Manual (Rev.1.01) RealTimeEvaluator Software Version Up * The latest RTE for Win32 (Rte4win32) can be down-loaded from following URL. http://www.midas.co.jp/products/download/english/program/rte4win_32.htm
User's Manual (Rev.1.01) RealTimeEvaluator Software Version Up * The latest RTE for Win32 (Rte4win32) can be down-loaded from following URL. http://www.midas.co.jp/products/download/english/program/rte4win_32.htm
Getting Started in C Programming with Keil MDK-ARM Version 5
 Getting Started in C Programming with Keil MDK-ARM Version 5 Reason for Revision This document was revised for Keil MDK-ARM v5.14 on February 18, 2015. This document was revised for MSP432 LaunchPad on
A Quick Introduction to MPLAB SIM
 A Quick Introduction to MPLAB SIM Welcome to this web seminar, A Quick Introduction to MPLAB SIM. My name is Darrel Johansen and I m a manager in the Development Tools group at Microchip. Page 1 What Is
Getting Started in C Programming with Keil MDK-ARM Version 5
 Getting Started in C Programming with Keil MDK-ARM Version 5 Reason for Revision This document was revised for Keil MDK-ARM v5.14 on February 18, 2015. This document was revised for MSP432 LaunchPad on
Lab 0 Introduction to the MSP430F5529 Launchpad-based Lab Board and Code Composer Studio
 ECE2049 Embedded Computing in Engineering Design Lab 0 Introduction to the MSP430F5529 Launchpad-based Lab Board and Code Composer Studio In this lab, you will be introduced to the Code Composer Studio
Lab 2: Basic Assembly Programming and Debugging using AVR Studio. Due: December 13, 2011
 Lab 2: Basic Assembly Programming and Debugging using AVR Studio 1 Outcomes Due: December 13, 2011 Familiarize yourself with the capabilities of the ATMEGA32 embedded microcontroller and AVR Studio Develop
XDS560 Trace. Technology Showcase. Daniel Rinkes Texas Instruments
 XDS560 Trace Technology Showcase Daniel Rinkes Texas Instruments Agenda AET / XDS560 Trace Overview Interrupt Profiling Statistical Profiling Thread Aware Profiling Thread Aware Dynamic Call Graph Agenda
Digital Electronics & Computer Engineering (E85)
") Digital Electronics & Computer Engineering (E85) Lab 8: MIPS Components Introduction In this lab, you will begin developing a schematic model of the MIPS processor. In the next lab, you will assemble the
Digital Electronics & Computer Engineering (E85) Lab 8: MIPS Components Introduction In this lab, you will begin developing a schematic model of the MIPS processor. In the next lab, you will assemble the
RTE-V850E/GP1-IE USER'S MANUAL (REV.1.01) RealTimeEvaluator
 RealTimeEvaluator") RTE-V850E/GP1-IE USER'S MANUAL (REV.1.01) RealTimeEvaluator REVISION HISTORY Rev. 1.00 June 20, 2002 Rev. 1.01 November 15, 2002 First edition Revising following chapters * "Measured value of execution
RTE-V850E/GP1-IE USER'S MANUAL (REV.1.01) RealTimeEvaluator REVISION HISTORY Rev. 1.00 June 20, 2002 Rev. 1.01 November 15, 2002 First edition Revising following chapters * "Measured value of execution
IP Routing Lab Assignment Configuring Basic Aspects of IP IGP Routing Protocols
 IP Routing Lab Assignment Configuring Basic Aspects of IP IGP Routing Protocols 1 PURPOSE AND GOALS This lab assignment will give you a hands-on experience in configuring and managing routers and particularly
Getting Started. In This Chapter
 Getting Started In This Chapter 2 This chapter introduces concepts and procedures that help you get started with AutoCAD. You learn how to open, close, and manage your drawings. You also learn about the
CFC. Special functions from SIMATIC S7 CFC V7.0 SP1 onwards
 CFC Function Function expansions from SIMATIC S7 CFC V7.1 onwards Forcing of values of an interconnected input: by means of the "Force functionality", interconnected block inputs can be forced to use the
4 DEBUGGING. In This Chapter. Figure 2-0. Table 2-0. Listing 2-0.
 4 DEBUGGING Figure 2-0. Table 2-0. Listing 2-0. In This Chapter This chapter contains the following topics: Debug Sessions on page 4-2 Code Behavior Analysis Tools on page 4-8 DSP Program Execution Operations
TREX Set-Up Guide: Creating a TREX Executable File for Windows
 TREX Set-Up Guide: Creating a TREX Executable File for Windows Prepared By: HDR 1 International Boulevard, 10 th Floor, Suite 1000 Mahwah, NJ 07495 May 13, 2013 Creating a TREX Executable File for Windows
Support for RISC-V. Lauterbach GmbH. Bob Kupyn Lauterbach Markus Goehrle - Lauterbach GmbH
 Company Lauterbach Profile Debug Support for RISC-V Lauterbach GmbH Bob Kupyn Lauterbach USA @2016 Markus Goehrle - Lauterbach GmbH Leading Manufacturer of Microprocessor Development Tools Founded in 1979
Figure 1. JTAGAVRU1 application The JTAGAVRU1 is supported by AVR Studio. Updated versions of AVR Studio is found on
 JTAG AVR Emulator through USB Main Features AVR Studio Compatible Supports AVR Devices with JTAG Interface Emulates Digital and Analog On-Chip Functions Data and Program Memory Breakpoints Supports Assembler
OS Awareness Manual Sciopta
 OS Awareness Manual Sciopta TRACE32 Online Help TRACE32 Directory TRACE32 Index TRACE32 Documents... OS Awareness Manuals... OS Awareness Manual Sciopta... 1 History... 2 Overview... 2 Brief Overview of
EMUL-PPC-PC. Getting Started Guide. Version 1.0
 EMUL-PPC-PC Getting Started Guide Version 1.0 EMUL PowerPC Getting Started Guide Edition1 ICE Technology. All rights reserved worldwide. Contents Warranty Information European CE Requirements User Responsibility
KIT-V850E2/MN4-TP-H. User s Manual (Rev. 1.01) RealTimeEvaluator
 RealTimeEvaluator") KIT-V850E2/MN4-TP-H User s Manual (Rev. 1.01) RealTimeEvaluator Software Version Up * The latest RTE for Win32 (Rte4win32) can be down-loaded from following URL. http://www.midas.co.jp/products/download/english/program/rte4win_32.htm
KIT-V850E2/MN4-TP-H User s Manual (Rev. 1.01) RealTimeEvaluator Software Version Up * The latest RTE for Win32 (Rte4win32) can be down-loaded from following URL. http://www.midas.co.jp/products/download/english/program/rte4win_32.htm
W7100A / W7100. Version WIZnet Co., Inc. All Rights Reserved. For more information, visit our website at
 W7100A / W7100 Debugger Guide Version 1.1 2012 WIZnet Co., Inc. All Rights Reserved. For more information, visit our website at http://www.wiznet.co.kr Copyright 2012 WIZnet Co., Inc. All rights reserved.
DOMAIN TECHNOLOGIES INC. Users Guide Version 2.0 SB-USB2. Emulator
 INC. Users Guide Version 2.0 SB-USB2 Emulator Table of Contents 1 INTRODUCTION... 3 1.1 Features... 3 1.2 Package Contents... 4 1.3 Related Components... 4 2 INSTALLATION... 4 3 INTEGRATION WITH LSI LOGIC
Hands-on CUDA exercises
 Hands-on CUDA exercises CUDA Exercises We have provided skeletons and solutions for 6 hands-on CUDA exercises In each exercise (except for #5), you have to implement the missing portions of the code Finished
Stimuli Generator User s Guide
 Stimuli Generator User s Guide TRACE32 Online Help TRACE32 Directory TRACE32 Index TRACE32 Documents... Stimuli Generator... Stimuli Generator User's Guide... 1 Stimuli-Generator... 2 Basics 2 Digital
System Messages - Numerical List
 Page 1 of 13 Open topic with navigation V+ Language Reference Guide, v17.x Page 2 of 13 System Messages - Numerical List This section lists all the V+ messages that have a numeric code. Most message codes
A & A Library - Network Install
 A & A Library - Network Install Before You Install or Update Your Software One of the most important things to remember before you start updating or reinstalling any computer software is to turn off any
CodeWarrior. Microcomputer Architecture and Interfacing Colorado School of Mines Professor William Hoff
 CodeWarrior 1 Assembler An assembler is a program that translates assembly language into machine code. Machine code are the numbers that the CPU recognizes as instructions. $B6 $10 $00 Assembly language
Megawin 8051 OCD ICE
 Megawin User Manual This document information is the intellectual property of Megawin Technology Co., Ltd. 1 Contents 1 Introduction... 3 Features... 3 Description... 3 2 Hardware Setup... 4 3 Software
3 TUTORIAL. In This Chapter. Figure 1-0. Table 1-0. Listing 1-0.
 3 TUTORIAL Figure 1-0. Table 1-0. Listing 1-0. In This Chapter This chapter contains the following topics: Overview on page 3-2 Exercise One: Building and Running a C Program on page 3-4 Exercise Two:
Development Tools. 8-Bit Development Tools. Development Tools. AVR Development Tools
 Development Tools AVR Development Tools This section describes some of the development tools that are available for the 8-bit AVR family. Atmel AVR Assembler Atmel AVR Simulator IAR ANSI C-Compiler, Assembler,
Application Note for the Trace.Find Command
 Application Note for the Trace.Find Command TRACE32 Online Help TRACE32 Directory TRACE32 Index TRACE32 Documents... Trace Analysis... Trace Application Notes... Application Note for the Trace.Find Command...
As CCS starts up, a splash screen similar to one shown below will appear.
 APPENDIX A. CODE COMPOSER STUDIO (CCS) v6.1: A BRIEF TUTORIAL FOR THE DSK6713 A.1 Introduction Code Composer Studio (CCS) is Texas Instruments Eclipse-based integrated development environment (IDE) for