Introduction to R Commander
|
|
|
- Allen Turner
- 5 years ago
- Views:
Transcription
1 Introduction to R Commander 1. Get R and Rcmdr to run 2. Familiarize yourself with Rcmdr 3. Look over Rcmdr metadata (Fox, 2005) 4. Start doing stats / plots with Rcmdr
2 Tasks 1. Clear Workspace and History. 2. Install and run the Rcmdr package. 3. Manually enter and edit data files (LecturerData and OnlyLecturer) 4. Import RData file in three formats: lxs, txt, csv 5. Save data file
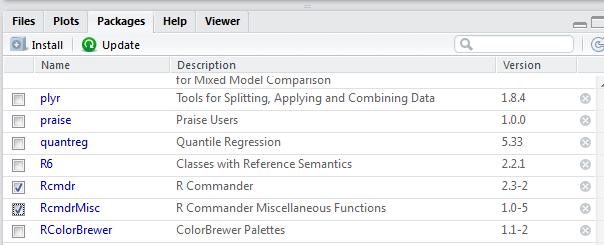
3 Installing Rcmdr Package 1. Install Rcmdr package 2. Load Rcmdr package 3. A new GUI window will pop-up; which will add functionality to R via menu-driven functions NOTE: You can install packages using the R console or R Studio. I show you how to do the installation both ways, but you will only need to do it once. HINT: I suggest using R Studio.
4 Question 1a Figure out how to import the xls file: RData1.xls Explain how you managed to import this file. Report the R commands you used
5 Question 1b Figure out how to import the txt file: RData2.txt Explain how you managed to import this file. Report the R commands you used
6 Question 1c Figure out how to import this csv file: RData3.csv Explain how you managed to import this file. Report the R commands you used


7 Answers Utilized command for csv from R textbook for mac. Initially imported same way as.txt and excel files and got same response from R, so it seems like the other way worked too
8 Answers I opened the readr package first and used this command to import the csv file (assigned the file to the name RData3 ): library(readr) RData3 <- read_csv( C:/Users/Angelica Moua/Desktop/RData3_.csv )
9 Answers The command for R to be able to read a csv file is: Rdata3 = read.csv("rdata3.csv") > Rdata5 = read.csv("rdata3.csv") Warning in file(file, "rt") : cannot open file 'Rdata3.csv': No such file or directory Error in file(file, "rt") : cannot open the connection Remember: R is always pointed at a directory on your computer. You can find out which directory by running the getwd (get working directory) function; this function has no arguments. To change your working directory, use setwd and specify the path to the desired folder.
 > setwd(\"~/r/working\") > Rdata5 = read.csv(\"rdata3.")
10 Troubleshooting Checking Working Directory: getwd() Setting Working Directory: setwd() > setwd("~/r/working") > Rdata5 = read.csv("rdata3.csv")
11 Answers I was able to import the RData3.csv file by going to: Data -> Import Data -> from text file, clipboard, or URL I selected commas [,] as the field separator, left the rest as the default and hit OK. > RData4 <- read.table("c:/assignment#2/rdata2_3.csv", header=true, sep=",", na.strings="na", dec=".", strip.white=true)
12 Answers > RData4 <- read.table("c:/assignment#2/rdata2_3.csv", header=true, sep=",", na.strings="na", dec=".", strip.white=true) read.table(file) reads a file in table format and creates a data frame from it; the default separator sep="" is any whitespace; use header=true to read the first line as a header of column names; use as.is=true to prevent character vectors from being converted to factors; use comment.char="" to prevent "#" from being interpreted as a comment; use skip=n to skip n lines before reading data; see the help for options on row naming, NA treatment, and others read.csv("filename",header=true) id. but with defaults set for reading comma-delimited files
13 Answers I searched in the Short-refcard.pdf for csv data and found a Command. I put the following in R console and it worked! read.csv("filename",header=true) id. but with defaults set for reading comma-delimited files > RData5 <- read.csv("rdata3.csv",header=true)
14 Question 2: Subsetting Data Make LecturerData the active file Extract records where job is Lecturer, and set aside records where job is Researcher. Use subset command: Data / Active Dataset / Subset Active Dataset Save the new dataframe you created. Call it: LecturerOnly
15 Answers I searched in the Short-refcard.pdf for csv data and found a Command. I put the following in the R console and it worked! subset(x,...) returns a selection of x with respect to criteria (..., typically comparisons: x$v1 < 10); if x is a data frame, the option select gives the variables to be kept or dropped using a minus sign lecturers <- subset(professors, subset=job == 'lecturer')

16 Answers watch?v=imrqigvjj2y
17 Question 3 Enter the following information, from the three datasets: RData1, RData2, RData3 Summary Statistics RData 1 RData2 RData3 Min st Quartile Median Mean rd Quartile Max
18 Answers RData1 Min: Mean: Max:

19 Answers RData2 Min: Mean: Max:

20 Answers RData3 Min: Mean: Max:
21 Questions / Answers 6. Create, save and paste three box plots: one for each of the three datasets: RData1, RData2, RData3. Paste each plot in a separate slide and make sure you report the summary statistics you calculated in question 4.
22 Answers RData1 Min: Median: Max: st Quartile: rd Quartile: Mean:
23 Answers RData2 Min: Median: Max: st Quartile: rd Quartile: Mean:
24 Answers RData3 Min: Median: Max: st Quartile: rd Quartile: Mean:

25 Installing Rcmdr Package in R Studio

26 Check the History Window > library("rcmdr", lib.loc="~/r/win-library/3.4")
27 Check the Function Library > help(library)

28
 Output Window")
29 Running Rcmdr Package Console Window Submit Button ( ENTER ) Output Window Messages


30 Creating a Dataframe in Rcmdr Rcmdr has a built-in spreadsheet tool that allows the user to enter and manipulate data. For this exercise, you will create a dataframe called LecturerData similar to the one developed in lecture 3. Go to the top Rcmdr menu and use: Data / New Data Set


31 Adding Data to a Dataframe in Rcmdr REMEMBER THESE RULES: Data from the same entity go in the same row Different variables are placed on different columns Create a dataset with four columns and four rows by adding rows / columns to dataframe Name columns Enter data shown below:

32 Creating Coding Variables in Rcmdr Data / Manage Variables in Active Dataset / Convert Numeric Variables to Factors
 as a factor in an analysis, we coded these fields with")

33 Creating Coding Variables in Rcmdr Note: Because we want to analyze the categorical data (1 is lecturer / 2 is researcher) as a factor in an analysis, we coded these fields with integers. However, we want the computer to understand that these two integers are used as identifiers of categorical data: 1 means lecturer & 2 means researcher Overwrite the Jobs Variable


34 Editing a Dataset in Rcmdr Selecting and Editing Datasets: Activate dataset by selecting it from scrolling list Use menu buttons to view and edit the selected dataset

35 Subsetting Data with Rcmdr Make LecturerData the active file Extract records where job is Lecturer, and set aside records where job is Researcher. Use subset command: Data / Active Dataset / Subset Active Dataset Save the new dataframe you created. Call it: LecturerOnly
 and SPSS files (.")
36 Importing Data into Rcmdr Note: Excel files ( xlsx, csv and.txt ) and SPSS files (.dat ) can be easily imported into R cmdr Data / Import Data / from Excel file


37 Importing Data into Rcmdr Import file RData1.xlsx Enter the following information: dataset name, whether headers are present, whether you want to convert character data into factors, and whether there are any missing data (empty cells)

38 Importing Data into Rcmdr Note: Importing.txt files from a variety of sources. Data / Import Data/ from text file, clipboard, or URL


39 Importing Data into Rcmdr Import file RData2.txt Import data from clipboard Enter metadata:
40 Importing Data into Rcmdr Import file RData3.csv Figure out how to import this csv file Hint: you will need to enter a line command

41 Sumamrizing Data with Rcmdr Summarize datasets using: Statistics / Summaries / Active data set NOTE: you need to select the active dataset and perform these calculations one at a time

42 Sumamrizing Data with Rcmdr Create plots using: Graphs / Histograms Box Plots NOTE: you need to select the active dataset and perform these calculations one at a time HINT: What types of plots can RCmdr make? (Explore the other available plots)

43 Saving Plots Made with Rcmdr After you create a plot, can save it using: Graphs / Save graph to file / as bitmap as PDF / PS / EPS

44 Saving Plots Made with Rcmdr NOTE: Bitmap is JPEG or PNG format files You can select: - Picture size - Font size
Introduction to R Cmdr
 Introduction to R Cmdr MARS 6910 Spring 2015 David Hyrenbach Starting R Some Basic Unix Commands (http://cran.r-project.org/ doc/contrib/short-refcard.pdf) ls() show objects in search path; () default
An Introduction to R- Programming
 An Introduction to R- Programming Hadeel Alkofide, Msc, PhD NOT a biostatistician or R expert just simply an R user Some slides were adapted from lectures by Angie Mae Rodday MSc, PhD at Tufts University
Introduction to R. UCLA Statistical Consulting Center R Bootcamp. Irina Kukuyeva September 20, 2010
 UCLA Statistical Consulting Center R Bootcamp Irina Kukuyeva ikukuyeva@stat.ucla.edu September 20, 2010 Outline 1 Introduction 2 Preliminaries 3 Working with Vectors and Matrices 4 Data Sets in R 5 Overview
POL 345: Quantitative Analysis and Politics
 POL 345: Quantitative Analysis and Politics Precept Handout 1 Week 2 (Verzani Chapter 1: Sections 1.2.4 1.4.31) Remember to complete the entire handout and submit the precept questions to the Blackboard
Data Input/Output. Andrew Jaffe. January 4, 2016
 Data Input/Output Andrew Jaffe January 4, 2016 Before we get Started: Working Directories R looks for files on your computer relative to the working directory It s always safer to set the working directory
Reading in data. Programming in R for Data Science Anders Stockmarr, Kasper Kristensen, Anders Nielsen
 Reading in data Programming in R for Data Science Anders Stockmarr, Kasper Kristensen, Anders Nielsen Data Import R can import data many ways. Packages exists that handles import from software systems
The R and R-commander software
 The R and R-commander software This course uses the statistical package 'R' and the 'R-commander' graphical user interface (Rcmdr). Full details about these packages and the advantages associated with
Module 4. Data Input. Andrew Jaffe Instructor
 Module 4 Data Input Andrew Jaffe Instructor Data Input We used several pre-installed sample datasets during previous modules (CO2, iris) However, 'reading in' data is the first step of any real project/analysis
LAB #1: DESCRIPTIVE STATISTICS WITH R
 NAVAL POSTGRADUATE SCHOOL LAB #1: DESCRIPTIVE STATISTICS WITH R Statistics (OA3102) Lab #1: Descriptive Statistics with R Goal: Introduce students to various R commands for descriptive statistics. Lab
A whirlwind introduction to using R for your research
 A whirlwind introduction to using R for your research Jeremy Chacón 1 Outline 1. Why use R? 2. The R-Studio work environment 3. The mock experimental analysis: 1. Writing and running code 2. Getting data
No Name What it does? 1 attach Attach your data frame to your working environment. 2 boxplot Creates a boxplot.
 No Name What it does? 1 attach Attach your data frame to your working environment. 2 boxplot Creates a boxplot. 3 confint A metafor package function that gives you the confidence intervals of effect sizes.
Reading data into R. 1. Data in human readable form, which can be inspected with a text editor.
 Reading data into R There is a famous, but apocryphal, story about Mrs Beeton, the 19th century cook and writer, which says that she began her recipe for rabbit stew with the instruction First catch your
Experimental epidemiology analyses with R and R commander. Lars T. Fadnes Centre for International Health University of Bergen
 Experimental epidemiology analyses with R and R commander Lars T. Fadnes Centre for International Health University of Bergen 1 Click to add an outline 2 How to install R commander? - install.packages("rcmdr",
Tutorial: SeqAPass Boxplot Generator
 1 Tutorial: SeqAPass Boxplot Generator 1. Access SeqAPASS by opening https://seqapass.epa.gov/seqapass/ using Mozilla Firefox web browser 2. Open the About link on the login page or upon logging in to
Lab 1: Getting started with R and RStudio Questions? or
 Lab 1: Getting started with R and RStudio Questions? david.montwe@ualberta.ca or isaacren@ualberta.ca 1. Installing R and RStudio To install R, go to https://cran.r-project.org/ and click on the Download
Lab 1. Introduction to R & SAS. R is free, open-source software. Get it here:
 Lab 1. Introduction to R & SAS R is free, open-source software. Get it here: http://tinyurl.com/yfet8mj for your own computer. 1.1. Using R like a calculator Open R and type these commands into the R Console
Introduction to R. Andy Grogan-Kaylor October 22, Contents
 Introduction to R Andy Grogan-Kaylor October 22, 2018 Contents 1 Background 2 2 Introduction 2 3 Base R and Libraries 3 4 Working Directory 3 5 Writing R Code or Script 4 6 Graphical User Interface 4 7
PSS718 - Data Mining
 Lecture 3 Hacettepe University, IPS, PSS October 10, 2016 Data is important Data -> Information -> Knowledge -> Wisdom Dataset a collection of data, a.k.a. matrix, table. Observation a row of a dataset,
Introduction to R and R-Studio Toy Program #1 R Essentials. This illustration Assumes that You Have Installed R and R-Studio
 Introduction to R and R-Studio 2018-19 Toy Program #1 R Essentials This illustration Assumes that You Have Installed R and R-Studio If you have not already installed R and RStudio, please see: Windows
R for IR. Created by Narren Brown, Grinnell College, and Diane Saphire, Trinity University
 R for IR Created by Narren Brown, Grinnell College, and Diane Saphire, Trinity University For presentation at the June 2013 Meeting of the Higher Education Data Sharing Consortium Table of Contents I.
PARTE XI: Introduzione all ambiente R - Panoramica
 PARTE XI: Introduzione all ambiente R - Panoramica 1 Getting help Most R functions have online documentation. help(topic) documentation on topic?topic id. help.search("topic") search the help system apropos("topic")
The goal of this handout is to allow you to install R on a Windows-based PC and to deal with some of the issues that can (will) come up.
 come up.") Fall 2010 Handout on Using R Page: 1 The goal of this handout is to allow you to install R on a Windows-based PC and to deal with some of the issues that can (will) come up. 1. Installing R First off,
Fall 2010 Handout on Using R Page: 1 The goal of this handout is to allow you to install R on a Windows-based PC and to deal with some of the issues that can (will) come up. 1. Installing R First off,
IMPORTING DATA INTO R. Introduction Flat Files
 IMPORTING DATA INTO R Introduction Flat Files Importing data into R? 5 Types Flat Files Excel Files Statistical Software Databases Data from the Web Flat Files states.csv Comma Separated Values state,capital,pop_mill,area_sqm
CSV Roll Documentation
 CSV Roll Documentation Version 1.1 March 2015 INTRODUCTION The CSV Roll is designed to display the contents of a Microsoft Excel worksheet in a Breeze playlist. The Excel worksheet must be exported as
Statistics for Biologists: Practicals
 Statistics for Biologists: Practicals Peter Stoll University of Basel HS 2012 Peter Stoll (University of Basel) Statistics for Biologists: Practicals HS 2012 1 / 22 Outline Getting started Essentials of
R Basics / Course Business
 R Basics / Course Business We ll be using a sample dataset in class today: CourseWeb: Course Documents " Sample Data " Week 2 Can download to your computer before class CourseWeb survey on research/stats
ADVANCED INQUIRIES IN ALBEDO: PART 2 EXCEL DATA PROCESSING INSTRUCTIONS
 ADVANCED INQUIRIES IN ALBEDO: PART 2 EXCEL DATA PROCESSING INSTRUCTIONS Once you have downloaded a MODIS subset, there are a few steps you must take before you begin analyzing the data. Directions for
Introduction to R & R Commander
 Introduction to R & R Commander Alexander Ploner 2011-03-18 CONTENTS CONTENTS Contents 1 Getting started 3 1.1 First steps............................................ 3 1.2 A simple
Orientation Assignment for Statistics Software (nothing to hand in) Mary Parker,
 Mary Parker,") Orientation to MINITAB, Mary Parker, mparker@austincc.edu. Last updated 1/3/10. page 1 of Orientation Assignment for Statistics Software (nothing to hand in) Mary Parker, mparker@austincc.edu When you
Orientation to MINITAB, Mary Parker, mparker@austincc.edu. Last updated 1/3/10. page 1 of Orientation Assignment for Statistics Software (nothing to hand in) Mary Parker, mparker@austincc.edu When you
1. Setup Everyone: Mount the /geobase/geo5215 drive and add a new Lab4 folder in you Labs directory.
 L A B 4 E X C E L For this lab, you will practice importing datasets into an Excel worksheet using different types of formatting. First, you will import data that is nicely organized at the source. Then
EXCEL IMPORT user guide
 18.2 user guide No Magic, Inc. 2015 All material contained herein is considered proprietary information owned by No Magic, Inc. and is not to be shared, copied, or reproduced by any means. All information
Module 1: Introduction RStudio
 Module 1: Introduction RStudio Contents Page(s) Installing R and RStudio Software for Social Network Analysis 1-2 Introduction to R Language/ Syntax 3 Welcome to RStudio 4-14 A. The 4 Panes 5 B. Calculator
An Introduction to the R Commander
 An Introduction to the R Commander BIO/MAT 460, Spring 2011 Christopher J. Mecklin Department of Mathematics & Statistics Biomathematics Research Group Murray State University Murray, KY 42071 christopher.mecklin@murraystate.edu
Instruction: Download and Install R and RStudio
 1 Instruction: Download and Install R and RStudio We will use a free statistical package R, and a free version of RStudio. Please refer to the following two steps to download both R and RStudio on your
Introduction to R. base -> R win32.exe (this will change depending on the latest version)
") Dr Raffaella Calabrese, Essex Business School 1. GETTING STARTED Introduction to R R is a powerful environment for statistical computing which runs on several platforms. R is available free of charge.
Dr Raffaella Calabrese, Essex Business School 1. GETTING STARTED Introduction to R R is a powerful environment for statistical computing which runs on several platforms. R is available free of charge.
Corso di Identificazione dei Modelli e Analisi dei Dati
 Università degli Studi di Pavia Dipartimento di Ingegneria Industriale e dell Informazione Corso di Identificazione dei Modelli e Analisi dei Dati Data Import Prof. Giuseppe De Nicolao, Federica Acerbi,
Reading and wri+ng data
 An introduc+on to Reading and wri+ng data Noémie Becker & Benedikt Holtmann Winter Semester 16/17 Course outline Day 4 Course outline Review Data types and structures Reading data How should data look
Tab-Delimited File and Compound Objects - Documents, Postcards, and Cubes. (Not Monographs)
") 1" Tab-Delimited File and Compound Objects - Documents, Postcards, and Cubes (Not Monographs) See Help Sheet: Tab-Delimited File and Compound Object - Monograph Content "2" Page 4: Why use Tab-delimited
1" Tab-Delimited File and Compound Objects - Documents, Postcards, and Cubes (Not Monographs) See Help Sheet: Tab-Delimited File and Compound Object - Monograph Content "2" Page 4: Why use Tab-delimited
Getting started with Minitab 14 for Windows
 INFORMATION SYSTEMS SERVICES Getting started with Minitab 14 for Windows This document provides an introduction to the Minitab (Version 14) statistical package. AUTHOR: Information Systems Services, University
TUTORIAL. HCS- Tools + Scripting Integrations
 TUTORIAL HCS- Tools + Scripting Integrations HCS- Tools... 3 Setup... 3 Task and Data... 4 1) Data Input Opera Reader... 7 2) Meta data integration Expand barcode... 8 3) Meta data integration Join Layout...
https://biostatisticien.eu/springer/courserw3.pdf
 P. Lafaye de Micheaux 1 1 Mathematics and Statistics Departement Université de Montréal CANADA New South Wales University Sydney, Australia May 27, 2014 https://biostatisticien.eu/springer/courserw3.pdf
STENO Introductory R-Workshop: Loading a Data Set Tommi Suvitaival, Steno Diabetes Center June 11, 2015
 STENO Introductory R-Workshop: Loading a Data Set Tommi Suvitaival, tsvv@steno.dk, Steno Diabetes Center June 11, 2015 Contents 1 Introduction 1 2 Recap: Variables 2 3 Data Containers 2 3.1 Vectors................................................
Intro to R h)p://jacobfenton.s3.amazonaws.com/r- handson.pdf. Jacob Fenton CAR Director InvesBgaBve ReporBng Workshop, American University
p://jacobfenton.s3.amazonaws.com/r- handson.pdf. Jacob Fenton CAR Director InvesBgaBve ReporBng Workshop, American University") Intro to R h)p://jacobfenton.s3.amazonaws.com/r- handson.pdf Jacob Fenton CAR Director InvesBgaBve ReporBng Workshop, American University Overview Import data Move around the file system, save an image
Intro to R h)p://jacobfenton.s3.amazonaws.com/r- handson.pdf Jacob Fenton CAR Director InvesBgaBve ReporBng Workshop, American University Overview Import data Move around the file system, save an image
Generalized Linear Models
 Generalized Linear Models Methods@Manchester Summer School Manchester University July 2 6, 2018 Software and Data www.research-training.net/manchester2018 Graeme.Hutcheson@manchester.ac.uk University of
R Commander Tutorial
 R Commander Tutorial Introduction R is a powerful, freely available software package that allows analyzing and graphing data. However, for somebody who does not frequently use statistical software packages,
Input/Output Data Frames
 Input/Output Data Frames Statistics 135 Autumn 2005 Copyright c 2005 by Mark E. Irwin Input/Output Importing text files Rectangular (n rows, c columns) Usually you want to use read.table read.table(file,
Reading and writing data
 An introduction to WS 2017/2018 Reading and writing data Dr. Noémie Becker Dr. Sonja Grath Special thanks to: Prof. Dr. Martin Hutzenthaler and Dr. Benedikt Holtmann for significant contributions to course
CS Introduction to Computational and Data Science. Instructor: Renzhi Cao Computer Science Department Pacific Lutheran University Spring 2017
 CS 133 - Introduction to Computational and Data Science Instructor: Renzhi Cao Computer Science Department Pacific Lutheran University Spring 2017 Announcement Read book to page 44. Final project Today
ECO375 Tutorial 1 Introduction to Stata
 ECO375 Tutorial 1 Introduction to Stata Matt Tudball University of Toronto Mississauga September 14, 2017 Matt Tudball (University of Toronto) ECO375H5 September 14, 2017 1 / 25 What Is Stata? Stata is
Getting and Cleaning Data. Biostatistics
 Getting and Cleaning Data Biostatistics 140.776 Getting and Cleaning Data Getting data: APIs and web scraping Cleaning data: Tidy data Transforming data: Regular expressions Getting Data Web site Nature
PhotoSpread. Quick User s Manual. Stanford University
 PS PhotoSpread Quick User s Manual Stanford University PhotoSpread Quick Introduction Guide 1.1 Introduction 1.2 Starting the application 1.3 The main application windows 1.4 Load Photos into a cell 1.5
IMPORTING DATA IN R. Introduction read.csv
 IMPORTING DATA IN R Introduction read.csv Importing data in R? 5 types Flat files Data from Excel Databases Web Statistical software Flat Files states.csv Comma Separated Values state,capital,pop_mill,area_sqm
Reference Guide. Adding a Generic File Store - Importing From a Local or Network ShipWorks Page 1 of 21
 Reference Guide Adding a Generic File Store - Importing From a Local or Network Folder Page 1 of 21 Adding a Generic File Store TABLE OF CONTENTS Background First Things First The Process Creating the
Introduction to R. Dataset Basics. March 2018
 Introduction to R March 2018 1. Preliminaries.... a) Suggested packages for importing/exporting data.... b) FAQ: How to find the path of your dataset (or whatever). 2. Import/Export Data........ a) R (.Rdata)
Oracle Big Data Cloud Service, Oracle Storage Cloud Service, Oracle Database Cloud Service
 Demo Introduction Keywords: Oracle Big Data Cloud Service, Oracle Storage Cloud Service, Oracle Database Cloud Service Goal of Demo: Oracle Big Data Preparation Cloud Services can ingest data from various
Creating consistent content pages
 Creating consistent content pages Content pages link from the electronic portfolio s home page. Using the ideas from the class discussion, determine the consistent elements of your content pages and plan
Introduction to R. 1 Introduction 2. 2 What You Need 2
 Introduction to R Dave Armstrong University of Wisconsin-Milwaukee Department of Political Science e: armstrod@uwm.edu w: http://www.quantoid.net/teachuw/uwmpsych Contents 1 Introduction 2 2 What You Need
Tutorial to use R with the export data of Compound Discoverer to. platform. Uwe Kunkel 2018/01/10
 Tutorial to use R with the export data of Compound Discoverer to obtain input files for the FOR-IDENT platform Uwe Kunkel 2018/01/10 1 1. Step: export data from CD Go to the results page of your CD study
Data Management Project Using Software to Carry Out Data Analysis Tasks
 Data Management Project Using Software to Carry Out Data Analysis Tasks This activity involves two parts: Part A deals with finding values for: Mean, Median, Mode, Range, Standard Deviation, Max and Min
LECTURE NOTES FOR ECO231 COMPUTER APPLICATIONS I. Part Two. Introduction to R Programming. RStudio. November Written by. N.
 LECTURE NOTES FOR ECO231 COMPUTER APPLICATIONS I Part Two Introduction to R Programming RStudio November 2016 Written by N.Nilgün Çokça Introduction to R Programming 5 Installing R & RStudio 5 The R Studio
Data Input/Output. Introduction to R for Public Health Researchers
 Data Input/Output Introduction to R for Public Health Researchers Common new user mistakes we have seen 1. Working directory problems: trying to read files that R "can't find" RStudio can help, and so
Generating a Custom Bill of Materials
 Generating a Custom Bill of Materials Old Content - visit altium.com/documentation Modified by on 6-Nov-2013 This tutorial describes how to use the Report Manager to set up a Bill of Materials (BOM) report.
Minitab Notes for Activity 1
 Minitab Notes for Activity 1 Creating the Worksheet 1. Label the columns as team, heat, and time. 2. Have Minitab automatically enter the team data for you. a. Choose Calc / Make Patterned Data / Simple
A brief introduction to R
 A brief introduction to R Cavan Reilly September 29, 2017 Table of contents Background R objects Operations on objects Factors Input and Output Figures Missing Data Random Numbers Control structures Background
GETTING STARTED. A Step-by-Step Guide to Using MarketSight
 GETTING STARTED A Step-by-Step Guide to Using MarketSight Analyze any dataset Run crosstabs Test statistical significance Create charts and dashboards Share results online Introduction MarketSight is a
STAT 571A Advanced Statistical Regression Analysis. Introduction to R NOTES
 STAT 571A Advanced Statistical Regression Analysis Introduction to R NOTES 2015 University of Arizona Statistics GIDP. All rights reserved, except where previous rights exist. No part of this material
Intermediate Programming in R Session 1: Data. Olivia Lau, PhD
 Intermediate Programming in R Session 1: Data Olivia Lau, PhD Outline About Me About You Course Overview and Logistics R Data Types R Data Structures Importing Data Recoding Data 2 About Me Using and programming
Bulk Provisioning Overview
 CHAPTER 8 Bulk provisioning functionality in the Cisco Voice Provisioning Tool allows you to add or modify a large number of users or a large number of phones/device profiles (and the corresponding configuration
Computer lab 2 Course: Introduction to R for Biologists
 Computer lab 2 Course: Introduction to R for Biologists April 23, 2012 1 Scripting As you have seen, you often want to run a sequence of commands several times, perhaps with small changes. An efficient
Multi-Sponsor Environment. SAS Clinical Trial Data Transparency User Guide
 Multi-Sponsor Environment SAS Clinical Trial Data Transparency User Guide Version 6.0 01 December 2017 Contents Contents 1 Overview...1 2 Setting up Your Account...3 2.1 Completing the Initial Email and
Solo 4.6 Release Notes
 June9, 2017 (Updated to include Solo 4.6.4 changes) Solo 4.6 Release Notes This release contains a number of new features, as well as enhancements to the user interface and overall performance. Together
Getting Started With. A Step-by-Step Guide to Using WorldAPP Analytics to Analyze Survey Data, Create Charts, & Share Results Online
 Getting Started With A Step-by-Step Guide to Using WorldAPP Analytics to Analyze Survey, Create Charts, & Share Results Online Variables Crosstabs Charts PowerPoint Tables Introduction WorldAPP Analytics
University of Wollongong School of Mathematics and Applied Statistics. STAT231 Probability and Random Variables Introductory Laboratory
 1 R and RStudio University of Wollongong School of Mathematics and Applied Statistics STAT231 Probability and Random Variables 2014 Introductory Laboratory RStudio is a powerful statistical analysis package.
Figure 3.20: Visualize the Titanic Dataset
 80 Chapter 3. Data Mining with Azure Machine Learning Studio Figure 3.20: Visualize the Titanic Dataset 3. After verifying the output, we will cast categorical values to the corresponding columns. To begin,
The MAXQDA Stats Data Editor
 The Data Editor The Data Editor The MAXQDA Stats Data Editor displays the cases in the rows and the variables in the columns. Each case is therefore in a separate line. The following figure shows the Data
An Introduction to R 1.3 Some important practical matters when working with R
 An Introduction to R 1.3 Some important practical matters when working with R Dan Navarro (daniel.navarro@adelaide.edu.au) School of Psychology, University of Adelaide ua.edu.au/ccs/people/dan DSTO R Workshop,
Author: Leonore Findsen, Qi Wang, Sarah H. Sellke, Jeremy Troisi
 0. Downloading Data from the Book Website 1. Go to http://bcs.whfreeman.com/ips8e 2. Click on Data Sets 3. Click on Data Sets: PC Text 4. Click on Click here to download. 5. Right Click PC Text and choose
Use mail merge to create and print letters and other documents
 Use mail merge to create and print letters and other documents Contents Use mail merge to create and print letters and other documents... 1 Set up the main document... 1 Connect the document to a data
Depending on the computer you find yourself in front of, here s what you ll need to do to open SPSS.
 1 SPSS 13.0 for Windows Introductory Assignment Material covered: Creating a new SPSS data file, variable labels, value labels, saving data files, opening an existing SPSS data file, generating frequency
GOOGLE SHEETS TUTORIAL
 GOOGLE SHEETS TUTORIAL STM TRAINING PROGRAM BY BREANA NARINE (Instructional Design Assistant) Google Sheets Tutorial Google Sheet is an online service provided by Google where you are able to create new
RClimTool USER MANUAL
 RClimTool USER MANUAL By Lizeth Llanos Herrera, student Statistics This tool is designed to support, process automation and analysis of climatic series within the agreement of CIAT-MADR. It is not intended
Example how not to do it: JMP in a nutshell 1 HR, 17 Apr Subject Gender Condition Turn Reactiontime. A1 male filler
 JMP in a nutshell 1 HR, 17 Apr 2018 The software JMP Pro 14 is installed on the Macs of the Phonetics Institute. Private versions can be bought from
Solution to Tumor growth in mice
 Solution to Tumor growth in mice Exercise 1 1. Import the data to R Data is in the file tumorvols.csv which can be read with the read.csv2 function. For a succesful import you need to tell R where exactly
Where s the spreadsheet?
 Reading in Data Where s the spreadsheet? Statistical packages normally have a spreadsheet R has a minimal-but-usable spreadsheet More emphasis on data generated/curated externally Very powerful data import
23 - Report & Export
 23 - Report & Export Contents 23 - REPORT & EXPORT... 1 SMART PUBLISHER... 1 Opening Smart Publisher... 1 Smart Publisher Settings... 2 The Finished Report... 5 Alias Names for Codes... 6 The Word Template
EXST 7014, Lab 1: Review of R Programming Basics and Simple Linear Regression
 EXST 7014, Lab 1: Review of R Programming Basics and Simple Linear Regression OBJECTIVES 1. Prepare a scatter plot of the dependent variable on the independent variable 2. Do a simple linear regression
Chapter 3: Data Description Calculate Mean, Median, Mode, Range, Variation, Standard Deviation, Quartiles, standard scores; construct Boxplots.
 MINITAB Guide PREFACE Preface This guide is used as part of the Elementary Statistics class (Course Number 227) offered at Los Angeles Mission College. It is structured to follow the contents of the textbook
Introduction to R Software
 1. Introduction R is a free software environment for statistical computing and graphics. It is almost perfectly compatible with S-plus. The only thing you need to do is download the software from the internet
Lab 1 Introduction to R
 Lab 1 Introduction to R Date: August 23, 2011 Assignment and Report Due Date: August 30, 2011 Goal: The purpose of this lab is to get R running on your machines and to get you familiar with the basics
2007, 2008 FileMaker, Inc. All rights reserved.
 Bento User s Guide 2007, 2008 FileMaker, Inc. All rights reserved. FileMaker, Inc. 5201 Patrick Henry Drive Santa Clara, California 95054 FileMaker, the file folder logo, Bento and the Bento logo are either
SPSS Statistics 21.0 GA Fix List. Release notes. Abstract
 SPSS Statistics 21.0 GA Fix List Release notes Abstract A comprehensive list of defect corrections for SPSS Statistics 21 GA. Details of the fixes are listed below. If you have questions about a particular
BIOSTATISTICS LABORATORY PART 1: INTRODUCTION TO DATA ANALYIS WITH STATA: EXPLORING AND SUMMARIZING DATA
 BIOSTATISTICS LABORATORY PART 1: INTRODUCTION TO DATA ANALYIS WITH STATA: EXPLORING AND SUMMARIZING DATA Learning objectives: Getting data ready for analysis: 1) Learn several methods of exploring the
SAS Data Explorer 2.1: User s Guide
 SAS Data Explorer 2.1: User s Guide Working with SAS Data Explorer Understanding SAS Data Explorer SAS Data Explorer and the Choose Data Window SAS Data Explorer enables you to copy data to memory on SAS
SISG/SISMID Module 3
 SISG/SISMID Module 3 Introduction to R Ken Rice Tim Thornton University of Washington Seattle, July 2018 Introduction: Course Aims This is a first course in R. We aim to cover; Reading in, summarizing
Talend Data Preparation - Quick Examples
 Talend Data Preparation - Quick Examples 2 Contents Concepts and Principles...4 What is a dataset?... 4 What is a function?... 4 What is a preparation?... 4 What is a recipe?...4 Using charts... 5 Chart
R: A Gentle Introduction. Vega Bharadwaj George Mason University Data Services
 R: A Gentle Introduction Vega Bharadwaj George Mason University Data Services Part I: Why R? What do YOU know about R and why do you want to learn it? Reasons to use R Free and open-source User-created
Introduction to Minitab 1
 Introduction to Minitab 1 We begin by first starting Minitab. You may choose to either 1. click on the Minitab icon in the corner of your screen 2. go to the lower left and hit Start, then from All Programs,
2. Click File and then select Import from the menu above the toolbar. 3. From the Import window click the Create File to Import button:
 Totality 4 Import How to Import data into Totality 4. Totality 4 will allow you to import data from an Excel spreadsheet or CSV (comma separated values). You must have Microsoft Excel installed in order
More Skills 12 Create Web Queries and Clear Hyperlinks
 CHAPTER 9 Excel More Skills 12 Create Web Queries and Clear Hyperlinks Web queries are requests that are sent to web pages to retrieve and display data in Excel workbooks. Web queries work best when retrieving
Setup Mount the //geobase/geo4315 server and add a new Lab2 folder in your user folder.
 L AB 2 L AB M2 ICROSOFT E XCEL O FFICE W ORD, E XCEL & POWERP OINT XCEL & P For this lab, you will practice importing datasets into an Excel worksheet using different types of formatting. First, you will