IBM High Performance Computing Toolkit
|
|
|
- Andrew Elliott
- 6 years ago
- Views:
Transcription

 IBM, India Software")
1 IBM High Performance Computing Toolkit Pidad D'Souza IBM, India Software Labs
2 Top 500 : Application areas (November 2011) Systems Performance Source : 2 2
3 IBM HPC Toolkit Integrated Picture and dimensions Eclipse Parallel Tools Paltform (PTP) Automated Performance Tuning - HPCS Performance analysis - HPC Tools C/C++ Fortran PAMI XL/VAC GNU Intel IB / HFI AIX Linux RHEL SLES Prorgramming Languages / Models Compilers / Networking Message Passing Interface (MPI) Operating Systems Compute hardware 3 Profile Trace Visualize PGAS UPC OpenCL IBM PE MPICH OpenMPI 32 bit 64 bit Applic ations Power x86 BG GPU 3


4 IBM HPC Toolkit 4 An integrated framework to assist application performance tuning 4

5 The Performance Pie Performance Dimensions CPU Performance MPI Performance Threading Performance I/O Performance 5 5

6 IBM HPC Toolkit usability and features IBM System p, Blue Gene L/P, System x, Hybrid AIX and Linux 6 Operates on the application binary and generate results in terms of source level symbols, with full source code traceback capability Presents the results in an easy to use and intuitive GUI Can be used as: A collection of command line, visualization utilities A plug-in into the Eclipse IDE As a collection of libraries which are used with the application 6


7 IBM HPC Toolkit Components 7 HPM Visualization Hardware Performance Monitoring Eclipse Plug-in, PeekPerf, Xprof MPI openmp MIO Profiling MPI calls Profiling openmp directives I/O analysis and optimization 7


8 Using the IBM HPC Toolkit HPM, OpenMP, MPI, MIO One or more performance metrics can be chosen for a desired region of code 8 Binary Instrumentation or Profile Library calls Running the instrumented binary produces profiling results Eclipse Plug-In, PeekPerf, Xprof Rendering runtime state within a visualization of the workflow control flow 8
 Facilitates low-level performance analysis and tuning Updated at each cycle and low overhead 9 9")
9 CPU Performance HPM module Utilizes Performance Counters (special purpose registers built into the processor to store the counts of hardware-related activities) Facilitates low-level performance analysis and tuning Updated at each cycle and low overhead 9 9
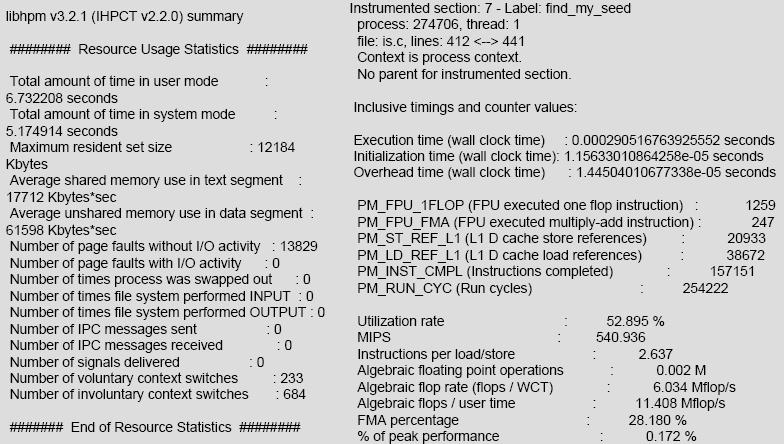
10 CPU Performance 10 10

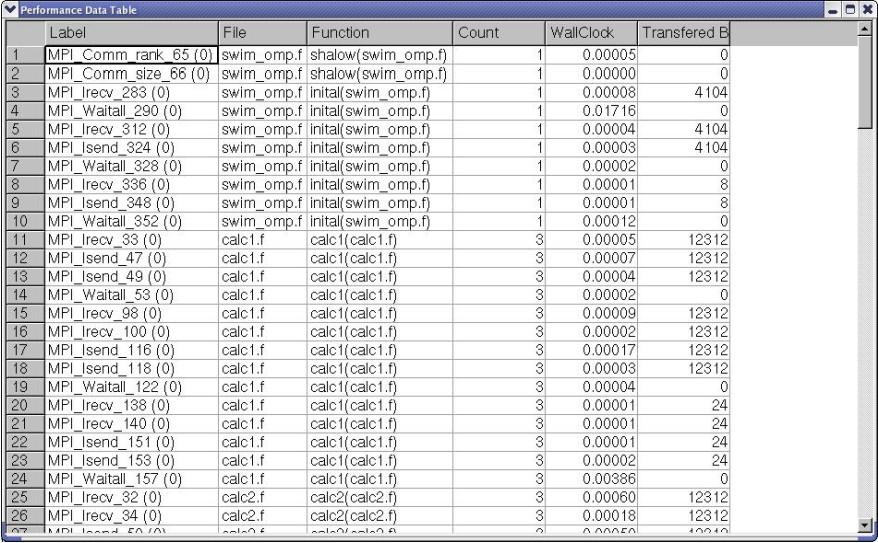
11 MPI Profiling Profiles MPI calls using the PMPI interface Start / stop timer PMPI equivalent function 11 11

12 MPI Profiling 12 12

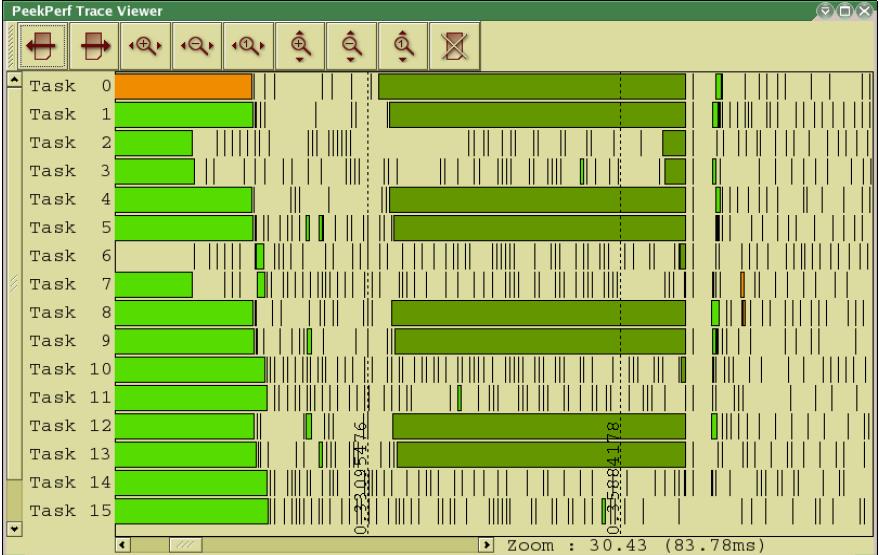
13 MPI Trace Captures timestamped data for MPI calls Provides a colour-coded trace of execution Provides source traceback Useful in identifying load-balancing issues 13 13

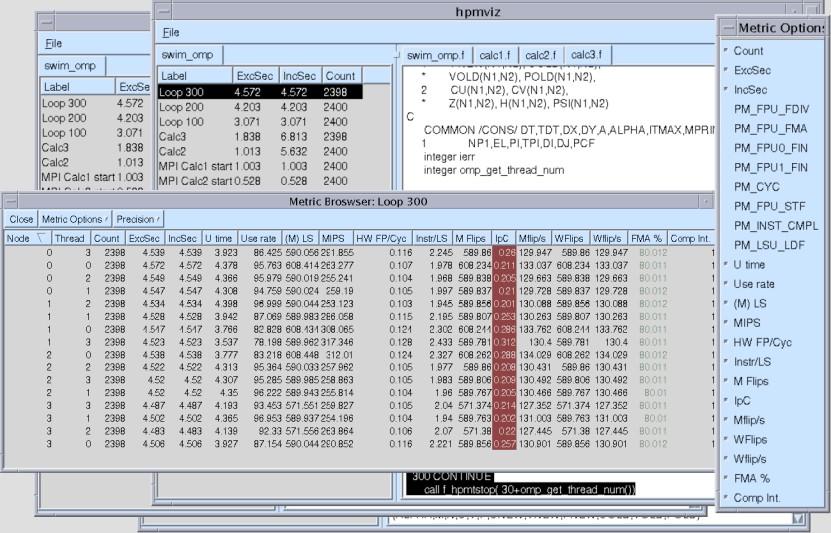
14 OpenMP profiling Uses the POMP OpenMP Monitoring Interface Groups of events identified for profiling: OpenMP constructs and directives/pragmas OpenMP API calls User functions and regions Generates profile describing overheads and time spent by each thread in: Parallel regions OpenMP loops inside a parallel region User defined functions Profile data is presented in the form of an XML file => can be visualized with visualization utilities 14 14

15 OpenMP profiling 15 15


16 Modular I/O Application level optimization for I/O Facilitates analysis and tuning of the I/O at the application level When an application exhibits the I/O pattern of sequential reading of large files, MIO Detects the behavior Provides source code traceback 16 16
17 IBM HPC Toolkit Work flow HPM HPM CC/ /C++ C++/Fortran /Fortran Binary Binary MPI MPI OpenMP OpenMP GUI GUI (Eclipse/ (Eclipse/Peekperf Peekperf Xprofiler) Xprofiler) CC/ /C++ C++/ /Fortran Fortran Instrumented Instrumented binary binary MIO MIO Visualization Visualization 17
18 Visualization Eclipse Plug-in Xprofiler PeekPerf 18 18


19 PeekPerf Control centre of the HPC Toolkit Standalone executable 19 19

20 PeekPerf 20 20


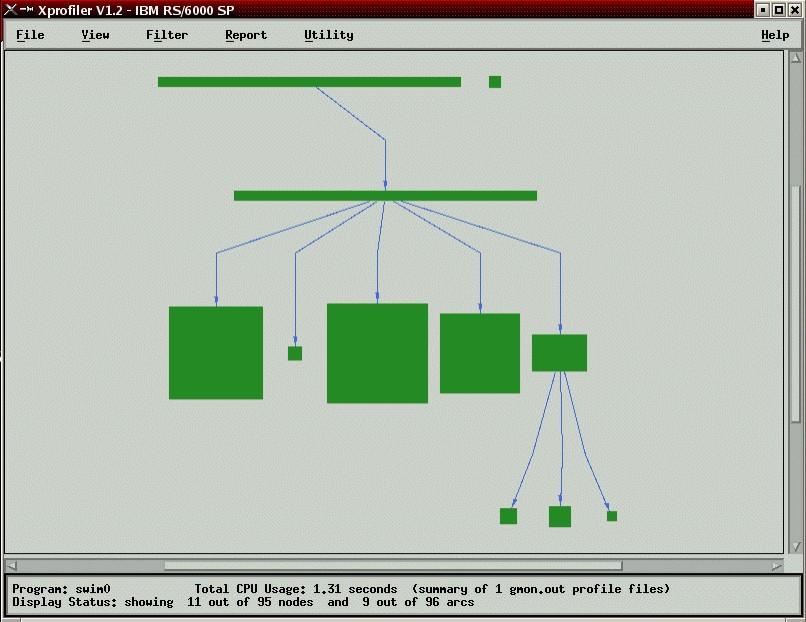
21 Xprofiler CPU time profiling data Visualization of profiled data Profile description : Flat Profile Call Graph Profile Function Index Function Call Summary Library Statistics 21 21
 22 22")
22 Xprofiler Disassembler View Source code window displays source code with time profile (in ticks=0.01 sec) 22 22

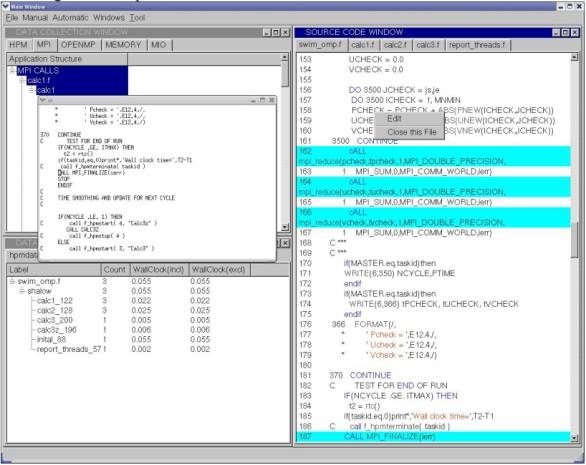
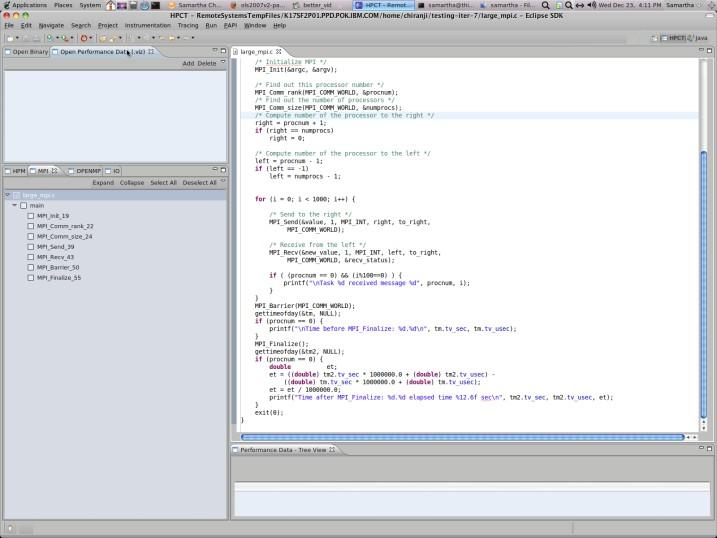
23 IBM HPC Toolkit Eclipse plug-in 23 Binary instrumentation with the Eclipse Plug-in 23

24 IBM HPC Toolkit Eclipse plug-in 24 Source level traceback of performance information 24

25 IBM HPC Toolkit Eclipse plug-in 25 25

26 IBM HPC Toolkit Eclipse plug-in Visualization of IBM HPCT in Eclipse Plug-in 26 26

27 IBM HPC Toolkit in a nutshell 27 27
28 Direction of Migration Eclipse Parallel Tools Platform (PTP) Eclipse PTP Framework Programming models: MPI / LAPI LAPI / PNSD Common Runtime PGAS Languages: xlupc Parallel Tools Platform: CAF (dependent on Fortran 2008* ) Parallel Language Development Tools (PLDT) HPC Toolkit Performance Tools Framework IBM Parallel Debugger POE Runtime Other MPI runtime HPCS Toolkit Scalable / Plugable Communication Infrastructure Parallel Runtime Parallel Monitoring Parallel Debugger Power Clusters: x86 Clusters: Power Clusters: BlueGene P5, P6, P7 Intel/AMD 28 Base Tools Platform: Language sensitive editor CDT C/C++ Development Tools Fortran Development Tools * Launch and Managed Build System Hybrid Clusters: Accelerator 28
29 Summary The IBM HPC Toolkit provides an integrated framework for performance analysis Support iterative analysis and automation of the performance tuning process The standardized software layers make it easy to plug in new performance analysis tools Operates on the binary and yet provide reports in terms of source-level symbols Provides multiple layers that the user can exploit (from low-level instrumentations to high-level performance analysis) for beginners to black-belts Full source code traceback capability Dynamically activate/deactivate data collection and change what information to collect 29 29
30 Thank You 31/01/12 30
Scalability issues : HPC Applications & Performance Tools
 High Performance Computing Systems and Technology Group Scalability issues : HPC Applications & Performance Tools Chiranjib Sur HPC @ India Systems and Technology Lab chiranjib.sur@in.ibm.com Top 500 :
Developing Scientific Applications with the IBM Parallel Environment Developer Edition
 Developing Scientific Applications with the IBM Parallel Environment Developer Edition Greg Watson, IBM grw@us.ibm.com Christoph Pospiech, IBM christoph.pospiech@de.ibm.com ScicomP 13 May 2013 Portions
Eclipse-PTP: An Integrated Environment for the Development of Parallel Applications
 Eclipse-PTP: An Integrated Environment for the Development of Parallel Applications Greg Watson (grw@us.ibm.com) Craig Rasmussen (rasmusen@lanl.gov) Beth Tibbitts (tibbitts@us.ibm.com) Parallel Tools Workshop,
ETFw and adding a Simple Custom GUI Control
 ETFw and adding a Simple Custom GUI Control Brian D. Watt bwatt@us.ibm.com IBM Austin TX 2012 NCSA Eclipse PTP User-Developer Workshop September 18-20, 2012 IBM Contents Eclipse 4.2 with PTP 6.0 IBM Plugins
Debugging CUDA Applications with Allinea DDT. Ian Lumb Sr. Systems Engineer, Allinea Software Inc.
 Debugging CUDA Applications with Allinea DDT Ian Lumb Sr. Systems Engineer, Allinea Software Inc. ilumb@allinea.com GTC 2013, San Jose, March 20, 2013 Embracing GPUs GPUs a rival to traditional processors
A Characterization of Shared Data Access Patterns in UPC Programs
 IBM T.J. Watson Research Center A Characterization of Shared Data Access Patterns in UPC Programs Christopher Barton, Calin Cascaval, Jose Nelson Amaral LCPC `06 November 2, 2006 Outline Motivation Overview
Integrating Parallel Application Development with Performance Analysis in Periscope
 Technische Universität München Integrating Parallel Application Development with Performance Analysis in Periscope V. Petkov, M. Gerndt Technische Universität München 19 April 2010 Atlanta, GA, USA Motivation
PTP - PLDT Parallel Language Development Tools Overview, Status & Plans
 PTP - PLDT Parallel Language Development Tools Overview, Status & Plans Beth Tibbitts tibbitts@us.ibm.com High Productivity Tools Group, IBM Research "This material is based upon work supported by the
Performance Analysis of Parallel Scientific Applications In Eclipse
 Performance Analysis of Parallel Scientific Applications In Eclipse EclipseCon 2015 Wyatt Spear, University of Oregon wspear@cs.uoregon.edu Supercomputing Big systems solving big problems Performance gains
Allinea Unified Environment
 Allinea Unified Environment Allinea s unified tools for debugging and profiling HPC Codes Beau Paisley Allinea Software bpaisley@allinea.com 720.583.0380 Today s Challenge Q: What is the impact of current
Analyzing the Performance of IWAVE on a Cluster using HPCToolkit
 Analyzing the Performance of IWAVE on a Cluster using HPCToolkit John Mellor-Crummey and Laksono Adhianto Department of Computer Science Rice University {johnmc,laksono}@rice.edu TRIP Meeting March 30,
Scalasca support for Intel Xeon Phi. Brian Wylie & Wolfgang Frings Jülich Supercomputing Centre Forschungszentrum Jülich, Germany
 Scalasca support for Intel Xeon Phi Brian Wylie & Wolfgang Frings Jülich Supercomputing Centre Forschungszentrum Jülich, Germany Overview Scalasca performance analysis toolset support for MPI & OpenMP
The Eclipse Parallel Tools Platform Project
 The Eclipse Parallel Tools Platform Project EclipseCon 2005 LAUR-05-0574 Parallel Development Tools State of the Art Command-line compilers for Fortran and C/C++ Sometimes wrapped in a GUI Editors are
HPC Toolkit. View MPI Trace Data
 IBM HPC Toolkit View MPI Trace Data! Timeline view of MPI function calls! MPI Function calls color coded matching list of right! Exclude functions from trace by clicking checkboxes! Zoom in and out using
Performance Analysis on Blue Gene/P
 Performance Analysis on Blue Gene/P Tulin Kaman Department of Applied Mathematics and Statistics Stony Brook University From microprocessor to the full Blue Gene P/system IBM XL Compilers The commands
Tools and Methodology for Ensuring HPC Programs Correctness and Performance. Beau Paisley
 Tools and Methodology for Ensuring HPC Programs Correctness and Performance Beau Paisley bpaisley@allinea.com About Allinea Over 15 years of business focused on parallel programming development tools Strong
Scalable Debugging with TotalView on Blue Gene. John DelSignore, CTO TotalView Technologies
 Scalable Debugging with TotalView on Blue Gene John DelSignore, CTO TotalView Technologies Agenda TotalView on Blue Gene A little history Current status Recent TotalView improvements ReplayEngine (reverse
The Eclipse Parallel Tools Platform
 May 1, 2012 Toward an Integrated Development Environment for Improved Software Engineering on Crays Agenda 1. What is the Eclipse Parallel Tools Platform (PTP) 2. Tour of features available in Eclipse/PTP
Addressing the Increasing Challenges of Debugging on Accelerated HPC Systems. Ed Hinkel Senior Sales Engineer
 Addressing the Increasing Challenges of Debugging on Accelerated HPC Systems Ed Hinkel Senior Sales Engineer Agenda Overview - Rogue Wave & TotalView GPU Debugging with TotalView Nvdia CUDA Intel Phi 2
Automatic Tuning of HPC Applications with Periscope. Michael Gerndt, Michael Firbach, Isaias Compres Technische Universität München
 Automatic Tuning of HPC Applications with Periscope Michael Gerndt, Michael Firbach, Isaias Compres Technische Universität München Agenda 15:00 15:30 Introduction to the Periscope Tuning Framework (PTF)
GPU Debugging Made Easy. David Lecomber CTO, Allinea Software
 GPU Debugging Made Easy David Lecomber CTO, Allinea Software david@allinea.com Allinea Software HPC development tools company Leading in HPC software tools market Wide customer base Blue-chip engineering,
Hands-on Workshop on How To Debug Codes at the Institute
 Hands-on Workshop on How To Debug Codes at the Institute H. Birali Runesha, Shuxia Zhang and Ben Lynch (612) 626 0802 (help) help@msi.umn.edu October 13, 2005 Outline Debuggers at the Institute Totalview
Porting Applications to Blue Gene/P
 Porting Applications to Blue Gene/P Dr. Christoph Pospiech pospiech@de.ibm.com 05/17/2010 Agenda What beast is this? Compile - link go! MPI subtleties Help! It doesn't work (the way I want)! Blue Gene/P
Profiling with TAU. Le Yan. User Services LSU 2/15/2012
 Profiling with TAU Le Yan User Services HPC @ LSU Feb 13-16, 2012 1 Three Steps of Code Development Debugging Make sure the code runs and yields correct results Profiling Analyze the code to identify performance
Splotch: High Performance Visualization using MPI, OpenMP and CUDA
 Splotch: High Performance Visualization using MPI, OpenMP and CUDA Klaus Dolag (Munich University Observatory) Martin Reinecke (MPA, Garching) Claudio Gheller (CSCS, Switzerland), Marzia Rivi (CINECA,
Performance Analysis for Large Scale Simulation Codes with Periscope
 Performance Analysis for Large Scale Simulation Codes with Periscope M. Gerndt, Y. Oleynik, C. Pospiech, D. Gudu Technische Universität München IBM Deutschland GmbH May 2011 Outline Motivation Periscope
ClearSpeed Visual Profiler
 ClearSpeed Visual Profiler Copyright 2007 ClearSpeed Technology plc. All rights reserved. 12 November 2007 www.clearspeed.com 1 Profiling Application Code Why use a profiler? Program analysis tools are
Intel VTune Amplifier XE
 Intel VTune Amplifier XE Vladimir Tsymbal Performance, Analysis and Threading Lab 1 Agenda Intel VTune Amplifier XE Overview Features Data collectors Analysis types Key Concepts Collecting performance
BSC Tools Hands-On. Judit Giménez, Lau Mercadal Barcelona Supercomputing Center
 BSC Tools Hands-On Judit Giménez, Lau Mercadal (lau.mercadal@bsc.es) Barcelona Supercomputing Center 2 VIRTUAL INSTITUTE HIGH PRODUCTIVITY SUPERCOMPUTING Extrae Extrae features Parallel programming models
Carlo Cavazzoni, HPC department, CINECA
 Introduction to Shared memory architectures Carlo Cavazzoni, HPC department, CINECA Modern Parallel Architectures Two basic architectural scheme: Distributed Memory Shared Memory Now most computers have
[Scalasca] Tool Integrations
![[Scalasca] Tool Integrations](/thumbs/95/125562042.jpg "[Scalasca] Tool Integrations") Mitglied der Helmholtz-Gemeinschaft [Scalasca] Tool Integrations Aug 2011 Bernd Mohr CScADS Performance Tools Workshop Lake Tahoe Contents Current integration of various direct measurement tools Paraver
Mitglied der Helmholtz-Gemeinschaft [Scalasca] Tool Integrations Aug 2011 Bernd Mohr CScADS Performance Tools Workshop Lake Tahoe Contents Current integration of various direct measurement tools Paraver
Performance Analysis with Periscope
 Performance Analysis with Periscope M. Gerndt, V. Petkov, Y. Oleynik, S. Benedict Technische Universität München periscope@lrr.in.tum.de October 2010 Outline Motivation Periscope overview Periscope performance
Profiling with TAU. Le Yan. 6/6/2012 LONI Parallel Programming Workshop
 Profiling with TAU Le Yan 6/6/2012 LONI Parallel Programming Workshop 2012 1 Three Steps of Code Development Debugging Make sure the code runs and yields correct results Profiling Analyze the code to identify
Performance Cockpit: An Extensible GUI Platform for Performance Tools
 Performance Cockpit: An Extensible GUI Platform for Performance Tools Tianchao Li and Michael Gerndt Institut für Informatik, Technische Universität München, Boltzmannstr. 3, D-85748 Garching bei Mu nchen,
MatCL - OpenCL MATLAB Interface
 MatCL - OpenCL MATLAB Interface MatCL - OpenCL MATLAB Interface Slide 1 MatCL - OpenCL MATLAB Interface OpenCL toolkit for Mathworks MATLAB/SIMULINK Compile & Run OpenCL Kernels Handles OpenCL memory management
AutoTune Workshop. Michael Gerndt Technische Universität München
 AutoTune Workshop Michael Gerndt Technische Universität München AutoTune Project Automatic Online Tuning of HPC Applications High PERFORMANCE Computing HPC application developers Compute centers: Energy
The Cray Programming Environment. An Introduction
 The Cray Programming Environment An Introduction Vision Cray systems are designed to be High Productivity as well as High Performance Computers The Cray Programming Environment (PE) provides a simple consistent
Intel VTune Performance Analyzer 9.1 for Windows* In-Depth
 Intel VTune Performance Analyzer 9.1 for Windows* In-Depth Contents Deliver Faster Code...................................... 3 Optimize Multicore Performance...3 Highlights...............................................
Tool for Analysing and Checking MPI Applications
 Tool for Analysing and Checking MPI Applications April 30, 2010 1 CONTENTS CONTENTS Contents 1 Introduction 3 1.1 What is Marmot?........................... 3 1.2 Design of Marmot..........................
AMD ACCELERATING TECHNOLOGIES FOR EXASCALE COMPUTING FELLOW 3 OCTOBER 2016
 AMD ACCELERATING TECHNOLOGIES FOR EXASCALE COMPUTING BILL.BRANTLEY@AMD.COM, FELLOW 3 OCTOBER 2016 AMD S VISION FOR EXASCALE COMPUTING EMBRACING HETEROGENEITY CHAMPIONING OPEN SOLUTIONS ENABLING LEADERSHIP
Open Compute Stack (OpenCS) Overview. D.D. Nikolić Updated: 20 August 2018 DAE Tools Project,
 Overview. D.D. Nikolić Updated: 20 August 2018 DAE Tools Project,") Open Compute Stack (OpenCS) Overview D.D. Nikolić Updated: 20 August 2018 DAE Tools Project, http://www.daetools.com/opencs What is OpenCS? A framework for: Platform-independent model specification 1.
Open Compute Stack (OpenCS) Overview D.D. Nikolić Updated: 20 August 2018 DAE Tools Project, http://www.daetools.com/opencs What is OpenCS? A framework for: Platform-independent model specification 1.
Parallel Programming. Libraries and implementations
 Parallel Programming Libraries and implementations Reusing this material This work is licensed under a Creative Commons Attribution- NonCommercial-ShareAlike 4.0 International License. http://creativecommons.org/licenses/by-nc-sa/4.0/deed.en_us
Improving the Productivity of Scalable Application Development with TotalView May 18th, 2010
 Improving the Productivity of Scalable Application Development with TotalView May 18th, 2010 Chris Gottbrath Principal Product Manager Rogue Wave Major Product Offerings 2 TotalView Technologies Family
Module 7: Advanced Development
 Module 7: Advanced Development Objective Become familiar with other tools that help parallel application development Contents Parallel Language Development Tools: MPI, OpenMP, UPC Overview of UPC tools
Graphics Performance Analyzer for Android
 Graphics Performance Analyzer for Android 1 What you will learn from this slide deck Detailed optimization workflow of Graphics Performance Analyzer Android* System Analysis Only Please see subsequent
IBM PSSC Montpellier Customer Center. Content
 Content Profiling GNU Profiler (Gprof) Vprof Communications Tracing MPI Trace Library Hardware Performance Monitors Universal Performance Counters (UPC) HPM Library IBM System Blue Gene/P Specifics Personality
HPC Tools on Windows. Christian Terboven Center for Computing and Communication RWTH Aachen University.
 - Excerpt - Christian Terboven terboven@rz.rwth-aachen.de Center for Computing and Communication RWTH Aachen University PPCES March 25th, RWTH Aachen University Agenda o Intel Trace Analyzer and Collector
Automatic trace analysis with the Scalasca Trace Tools
 Automatic trace analysis with the Scalasca Trace Tools Ilya Zhukov Jülich Supercomputing Centre Property Automatic trace analysis Idea Automatic search for patterns of inefficient behaviour Classification
Introduction to Parallel Performance Engineering
 Introduction to Parallel Performance Engineering Markus Geimer, Brian Wylie Jülich Supercomputing Centre (with content used with permission from tutorials by Bernd Mohr/JSC and Luiz DeRose/Cray) Performance:
An Implementation of the POMP Performance Monitoring for OpenMP based on Dynamic Probes
 An Implementation of the POMP Performance Monitoring for OpenMP based on Dynamic Probes Luiz DeRose IBM Research ACTC Yorktown Heights, NY USA laderose@us.ibm.com Bernd Mohr Forschungszentrum Jülich ZAM
Overview. Timers. Profilers. HPM Toolkit
 Overview Timers Profilers HPM Toolkit 2 Timers Wide range of timers available on the HPCx system Varying precision portability language ease of use 3 Timers Timer Usage Wallclock/C PU Resolution Language
Code Auto-Tuning with the Periscope Tuning Framework
 Code Auto-Tuning with the Periscope Tuning Framework Renato Miceli, SENAI CIMATEC renato.miceli@fieb.org.br Isaías A. Comprés, TUM compresu@in.tum.de Project Participants Michael Gerndt, TUM Coordinator
Understanding Dynamic Parallelism
 Understanding Dynamic Parallelism Know your code and know yourself Presenter: Mark O Connor, VP Product Management Agenda Introduction and Background Fixing a Dynamic Parallelism Bug Understanding Dynamic
Compute Node Linux (CNL) The Evolution of a Compute OS
 The Evolution of a Compute OS") Compute Node Linux (CNL) The Evolution of a Compute OS Overview CNL The original scheme plan, goals, requirements Status of CNL Plans Features and directions Futures May 08 Cray Inc. Proprietary Slide
Compute Node Linux (CNL) The Evolution of a Compute OS Overview CNL The original scheme plan, goals, requirements Status of CNL Plans Features and directions Futures May 08 Cray Inc. Proprietary Slide
The Arm Technology Ecosystem: Current Products and Future Outlook
 The Arm Technology Ecosystem: Current Products and Future Outlook Dan Ernst, PhD Advanced Technology Cray, Inc. Why is an Ecosystem Important? An Ecosystem is a collection of common material Developed
HPC on Windows. Visual Studio 2010 and ISV Software
 HPC on Windows Visual Studio 2010 and ISV Software Christian Terboven 19.03.2012 / Aachen, Germany Stand: 16.03.2012 Version 2.3 Rechen- und Kommunikationszentrum (RZ) Agenda
Parallel Programming. Libraries and Implementations
 Parallel Programming Libraries and Implementations Reusing this material This work is licensed under a Creative Commons Attribution- NonCommercial-ShareAlike 4.0 International License. http://creativecommons.org/licenses/by-nc-sa/4.0/deed.en_us
Eliminate Threading Errors to Improve Program Stability
 Introduction This guide will illustrate how the thread checking capabilities in Intel Parallel Studio XE can be used to find crucial threading defects early in the development cycle. It provides detailed
CUDA Development Using NVIDIA Nsight, Eclipse Edition. David Goodwin
 CUDA Development Using NVIDIA Nsight, Eclipse Edition David Goodwin NVIDIA Nsight Eclipse Edition CUDA Integrated Development Environment Project Management Edit Build Debug Profile SC'12 2 Powered By
Intel Parallel Studio XE 2015
 2015 Create faster code faster with this comprehensive parallel software development suite. Faster code: Boost applications performance that scales on today s and next-gen processors Create code faster:
NEW DEVELOPER TOOLS FEATURES IN CUDA 8.0. Sanjiv Satoor
 NEW DEVELOPER TOOLS FEATURES IN CUDA 8.0 Sanjiv Satoor CUDA TOOLS 2 NVIDIA NSIGHT Homogeneous application development for CPU+GPU compute platforms CUDA-Aware Editor CUDA Debugger CPU+GPU CUDA Profiler
Improving the Eclipse Parallel Tools Platform in Support of Earth Sciences High Performance Computing
 Improving the Eclipse Parallel Tools Platform in Support of Earth Sciences High Performance Computing Jay Alameda National Center for Supercomputing Applications, University of Illinois at Urbana-Champaign
VAMPIR & VAMPIRTRACE INTRODUCTION AND OVERVIEW
 VAMPIR & VAMPIRTRACE INTRODUCTION AND OVERVIEW 8th VI-HPS Tuning Workshop at RWTH Aachen September, 2011 Tobias Hilbrich and Joachim Protze Slides by: Andreas Knüpfer, Jens Doleschal, ZIH, Technische Universität
Performance analysis with Periscope
 Performance analysis with Periscope M. Gerndt, V. Petkov, Y. Oleynik, S. Benedict Technische Universität petkovve@in.tum.de March 2010 Outline Motivation Periscope (PSC) Periscope performance analysis
The PAPI Cross-Platform Interface to Hardware Performance Counters
 The PAPI Cross-Platform Interface to Hardware Performance Counters Kevin London, Shirley Moore, Philip Mucci, and Keith Seymour University of Tennessee-Knoxville {london, shirley, mucci, seymour}@cs.utk.edu
Parametric Studies in Eclipse with TAU and PerfExplorer
 Parametric Studies in Eclipse with TAU and PerfExplorer Kevin A. Huck, Wyatt Spear, Allen D. Malony, Sameer Shende and Alan Morris Performance Research Laboratory Department of Computer and Information
Module 3: Installing Eclipse
 Module 3: Installing Eclipse Objective To learn how to Eclipse To Eclipse on your laptop This is an optional module Contents Software prerequisites Installing Eclipse Installing CDT and PTP LACSI 2006
OpenACC/CUDA/OpenMP... 1 Languages and Libraries... 3 Multi-GPU support... 4 How OpenACC Works... 4
 OpenACC Course Class #1 Q&A Contents OpenACC/CUDA/OpenMP... 1 Languages and Libraries... 3 Multi-GPU support... 4 How OpenACC Works... 4 OpenACC/CUDA/OpenMP Q: Is OpenACC an NVIDIA standard or is it accepted
Eliminate Memory Errors to Improve Program Stability
 Introduction INTEL PARALLEL STUDIO XE EVALUATION GUIDE This guide will illustrate how Intel Parallel Studio XE memory checking capabilities can find crucial memory defects early in the development cycle.
Performance Analysis and Debugging Tools
 Performance Analysis and Debugging Tools Performance analysis and debugging intimately connected since they both involve monitoring of the software execution. Just different goals: Debugging -- achieve
Mitglied der Helmholtz-Gemeinschaft. Eclipse Parallel Tools Platform (PTP)
") Mitglied der Helmholtz-Gemeinschaft Eclipse Parallel Tools Platform (PTP) April 25, 2013 Carsten Karbach Content 1 Parallel Tools Platform (PTP) 2 Eclipse Plug-In Development April 25, 2013 Carsten Karbach
Mitglied der Helmholtz-Gemeinschaft Eclipse Parallel Tools Platform (PTP) April 25, 2013 Carsten Karbach Content 1 Parallel Tools Platform (PTP) 2 Eclipse Plug-In Development April 25, 2013 Carsten Karbach
Using Intel VTune Amplifier XE for High Performance Computing
 Using Intel VTune Amplifier XE for High Performance Computing Vladimir Tsymbal Performance, Analysis and Threading Lab 1 The Majority of all HPC-Systems are Clusters Interconnect I/O I/O... I/O I/O Message
SCALASCA parallel performance analyses of SPEC MPI2007 applications
 Mitglied der Helmholtz-Gemeinschaft SCALASCA parallel performance analyses of SPEC MPI2007 applications 2008-05-22 Zoltán Szebenyi Jülich Supercomputing Centre, Forschungszentrum Jülich Aachen Institute
Bright Cluster Manager Advanced HPC cluster management made easy. Martijn de Vries CTO Bright Computing
 Bright Cluster Manager Advanced HPC cluster management made easy Martijn de Vries CTO Bright Computing About Bright Computing Bright Computing 1. Develops and supports Bright Cluster Manager for HPC systems
Critically Missing Pieces on Accelerators: A Performance Tools Perspective
 Critically Missing Pieces on Accelerators: A Performance Tools Perspective, Karthik Murthy, Mike Fagan, and John Mellor-Crummey Rice University SC 2013 Denver, CO November 20, 2013 What Is Missing in GPUs?
Parallel Programming Libraries and implementations
 Parallel Programming Libraries and implementations Partners Funding Reusing this material This work is licensed under a Creative Commons Attribution- NonCommercial-ShareAlike 4.0 International License.
Performance Tools. Tulin Kaman. Department of Applied Mathematics and Statistics
 Performance Tools Tulin Kaman Department of Applied Mathematics and Statistics Stony Brook/BNL New York Center for Computational Science tkaman@ams.sunysb.edu Aug 23, 2012 Do you have information on exactly
Performance analysis basics
 Performance analysis basics Christian Iwainsky Iwainsky@rz.rwth-aachen.de 25.3.2010 1 Overview 1. Motivation 2. Performance analysis basics 3. Measurement Techniques 2 Why bother with performance analysis
VIProf: A Vertically Integrated Full-System Profiler
 VIProf: A Vertically Integrated Full-System Profiler NGS Workshop, April 2007 Hussam Mousa Chandra Krintz Lamia Youseff Rich Wolski RACELab Research Dynamic software adaptation As program behavior or resource
Tools and techniques for optimization and debugging. Fabio Affinito October 2015
 Tools and techniques for optimization and debugging Fabio Affinito October 2015 Profiling Why? Parallel or serial codes are usually quite complex and it is difficult to understand what is the most time
HPC Middle East. KFUPM HPC Workshop April Mohamed Mekias HPC Solutions Consultant. Agenda
 KFUPM HPC Workshop April 29-30 2015 Mohamed Mekias HPC Solutions Consultant Agenda 1 Agenda-Day 1 HPC Overview What is a cluster? Shared v.s. Distributed Parallel v.s. Massively Parallel Interconnects
Module 4: Working with MPI
 Module 4: Working with MPI Objective Learn how to develop, build and launch a parallel (MPI) program on a remote parallel machine Contents Remote project setup Building with Makefiles MPI assistance features
OP2 FOR MANY-CORE ARCHITECTURES
 OP2 FOR MANY-CORE ARCHITECTURES G.R. Mudalige, M.B. Giles, Oxford e-research Centre, University of Oxford gihan.mudalige@oerc.ox.ac.uk 27 th Jan 2012 1 AGENDA OP2 Current Progress Future work for OP2 EPSRC
MPI History. MPI versions MPI-2 MPICH2
 MPI versions MPI History Standardization started (1992) MPI-1 completed (1.0) (May 1994) Clarifications (1.1) (June 1995) MPI-2 (started: 1995, finished: 1997) MPI-2 book 1999 MPICH 1.2.4 partial implemention
I/O Monitoring at JSC, SIONlib & Resiliency
 Mitglied der Helmholtz-Gemeinschaft I/O Monitoring at JSC, SIONlib & Resiliency Update: I/O Infrastructure @ JSC Update: Monitoring with LLview (I/O, Memory, Load) I/O Workloads on Jureca SIONlib: Task-Local
ACCELERATING THE PRODUCTION OF SYNTHETIC SEISMOGRAMS BY A MULTICORE PROCESSOR CLUSTER WITH MULTIPLE GPUS
 ACCELERATING THE PRODUCTION OF SYNTHETIC SEISMOGRAMS BY A MULTICORE PROCESSOR CLUSTER WITH MULTIPLE GPUS Ferdinando Alessi Annalisa Massini Roberto Basili INGV Introduction The simulation of wave propagation
Large Scale Debugging
 Large Scale Debugging Project Meeting Report - December 2015 Didier Nadeau Under the supervision of Michel Dagenais Distributed Open Reliable Systems Analysis Lab École Polytechnique de Montréal Table
VIRTUAL INSTITUTE HIGH PRODUCTIVITY SUPERCOMPUTING. BSC Tools Hands-On. Germán Llort, Judit Giménez. Barcelona Supercomputing Center
 BSC Tools Hands-On Germán Llort, Judit Giménez Barcelona Supercomputing Center 2 VIRTUAL INSTITUTE HIGH PRODUCTIVITY SUPERCOMPUTING Getting a trace with Extrae Extrae features Platforms Intel, Cray, BlueGene,
Improving the Eclipse Parallel Tools Platform to Create an Effective Workbench for High Performance Computing
 Improving the Eclipse Parallel Tools Platform to Create an Effective Workbench for High Performance Computing Jay Alameda National Center for Supercomputing Applications 1 st CHANGES Workshop, Jülich 5
PROGRAMOVÁNÍ V C++ CVIČENÍ. Michal Brabec
 PROGRAMOVÁNÍ V C++ CVIČENÍ Michal Brabec PARALLELISM CATEGORIES CPU? SSE Multiprocessor SIMT - GPU 2 / 17 PARALLELISM V C++ Weak support in the language itself, powerful libraries Many different parallelization
A Strategy for Addressing the Needs of Advanced Scientific Computing Using Eclipse as a Parallel Tools Platform 1
 A Strategy for Addressing the Needs of Advanced Scientific Computing Using Eclipse as a Parallel Tools Platform Gregory R. Watson Craig E. Rasmussen Los Alamos National Laboratory P.O. Box 1663, MS B287
Portable Power/Performance Benchmarking and Analysis with WattProf
 Portable Power/Performance Benchmarking and Analysis with WattProf Amir Farzad, Boyana Norris University of Oregon Mohammad Rashti RNET Technologies, Inc. Motivation Energy efficiency is becoming increasingly
Objective. Contents. To learn how to install Eclipse and PTP
 Module 2: Installation Objective To learn how to install Eclipse and PTP Contents System Prerequisites Eclipse Download and Installation PTP Installation from an Update Site Installation Confirmation Module
OpenACC Course. Office Hour #2 Q&A
 OpenACC Course Office Hour #2 Q&A Q1: How many threads does each GPU core have? A: GPU cores execute arithmetic instructions. Each core can execute one single precision floating point instruction per cycle
Debugging Programs Accelerated with Intel Xeon Phi Coprocessors
 Debugging Programs Accelerated with Intel Xeon Phi Coprocessors A White Paper by Rogue Wave Software. Rogue Wave Software 5500 Flatiron Parkway, Suite 200 Boulder, CO 80301, USA www.roguewave.com Debugging
Trends in HPC (hardware complexity and software challenges)
") Trends in HPC (hardware complexity and software challenges) Mike Giles Oxford e-research Centre Mathematical Institute MIT seminar March 13th, 2013 Mike Giles (Oxford) HPC Trends March 13th, 2013 1 / 18
Trends in HPC (hardware complexity and software challenges) Mike Giles Oxford e-research Centre Mathematical Institute MIT seminar March 13th, 2013 Mike Giles (Oxford) HPC Trends March 13th, 2013 1 / 18
MPI Performance Engineering through the Integration of MVAPICH and TAU
 MPI Performance Engineering through the Integration of MVAPICH and TAU Allen D. Malony Department of Computer and Information Science University of Oregon Acknowledgement Research work presented in this
Objective. We will study software systems that permit applications programs to exploit the power of modern high-performance computers.
 CS 612 Software Design for High-performance Architectures 1 computers. CS 412 is desirable but not high-performance essential. Course Organization Lecturer:Paul Stodghill, stodghil@cs.cornell.edu, Rhodes
OpenACC Support in Score-P and Vampir
 Center for Information Services and High Performance Computing (ZIH) OpenACC Support in Score-P and Vampir Hands-On for the Taurus GPU Cluster February 2016 Robert Dietrich (robert.dietrich@tu-dresden.de)
FVM - How to program the Multi-Core FVM instead of MPI
 FVM - How to program the Multi-Core FVM instead of MPI DLR, 15. October 2009 Dr. Mirko Rahn Competence Center High Performance Computing and Visualization Fraunhofer Institut for Industrial Mathematics