Debugging with Totalview. Martin Čuma Center for High Performance Computing University of Utah
|
|
|
- Frederick Sharp
- 6 years ago
- Views:
Transcription

1 Debugging with Totalview Martin Čuma Center for High Performance Computing University of Utah
2 Overview Totalview introduction. Basic operation. Serial debugging. Parallel debugging. OpenMP MPI Memory debugging. Some other useful information 3/13/ Slide 2
3 Totalview in a nutshell source and machine level debugger command line and graphic interface serial and parallel debugging support supports remote debugging runs on variety of platforms 3/13/ Slide 3

4 Totalview windows 3/13/ Slide 4
5 Totalview basic operations Data examination view data in the variable windows change the values of variables modify display of the variables visualize data Action points breakpoints and barriers (static or conditional) watchpoints evaluation of expressions 3/13/ Slide 5
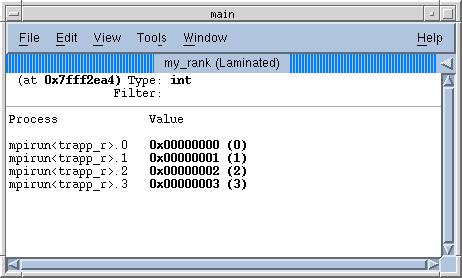
6 Multiprocess debugging Automatic attachment of child processes Create process groups Share breakpoints among processes Process barrier breakpoints Process group single-stepping Laminate variables Display MPI message queue state 3/13/ Slide 6
7 How to use Totalview 1. Compile binary with debugging information flag -g g77 g test.f o test if use fork() or execve(), link g77 g L/ /totalview/linux-x86-64/lib ldbfork test.f o test 2. Run Totalview TV + executable totalview executable TV + core file totalview executable core_file 3/13/ Slide 7
8 How to use Totalview run TV and attach the executable -start TV - menu New Program Window - fill in executable file name run TV and attach running program -start TV - menu New Program Window - pullout Attach to an Existing Process - choose process ID and fill in executable file name 3. Totalview operation left mouse button - select right mouse button - menu left mouse button double click - dive 3/13/ Slide 8
9 Example 1 Serial code CUSP DFT plane wave atomic simulation atomic nuclei interact classically electrons described by wavefunctions - plane waves interaction between w.f.'s and nuclei define the system potential and kinetic energy iterate electronic and nuclear energy to self consistency to achieve ground state Implementation 10+ Fortran source code files simple Makefile w/ flags -g -byteswapio 3/13/ Slide 9
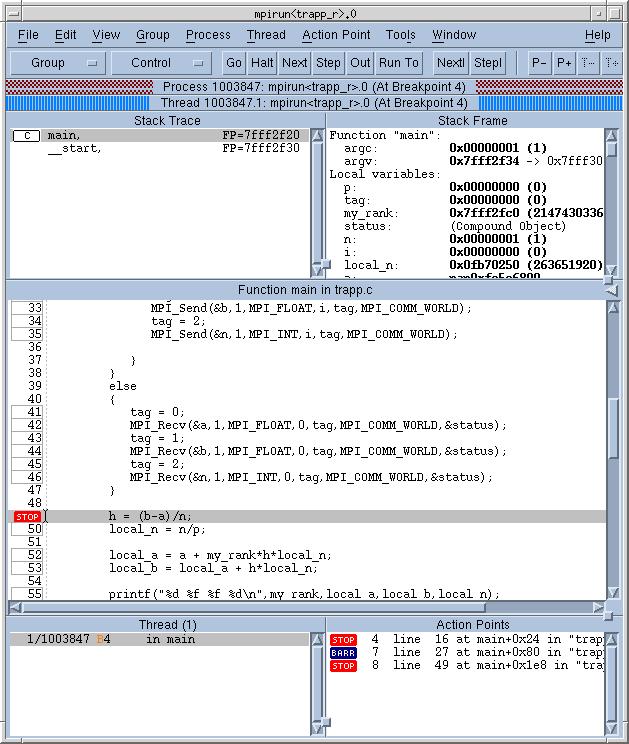
10 Process view window Stack trace procedure hierarchy Stack frame variables display Source code code + process navigation Threads list in case of multithreaded application Action points list of breakpoints, barriers, 3/13/ Slide 10
11 Running the debugger Menu Go/Halt/Next/Step/Hold or shortcuts Possible actions (thread,process/group): go (g/g) halt (h/h) step (source line) (s/s) step (instruction) (i/i) next (source line) (n/n) next (instruction) (x/x) run (to selection) (r/r) return (out of function) (o/o) 3/13/ Slide 11
12 Action points Breakpoints and barriers toggle location with left mouse (shift for barrier) right-click Properties for options Evaluation points set conditional breakpoints conditionally patch out code Watchpoints watch for change in a memory location 3/13/ Slide 12
13 Data examination Variable view dive (right mouse) on any variable change data type select an array slice, e.g. (3:3,:) filter array values, e.g..ne. 0 Variable visualization menu Visualize only up to 2D arrays 3/13/ Slide 13
14 Example 2 OpenMP code Compilation Arches: pathf90 openmp test.f -g o test.exe pgf90 mp test.f -g o test.exe ifort openmp test.f -g o test.exe gcc4 fopenmp test.c -g o test.exe Running set OMP_NUM_THREADS Example saxpy routine simple vector-scalar product 3/13/ Slide 14
15 OpenMP specific debugging TV automatically attaches all threads put breakpoint to OpenMP parallel section to debug threads variable lamination - show values from all threads in one window does not always work barrier points shift-left click ambiguous action points select all 3/13/ Slide 15
16 Job submitter code Example 3 MPI/OpenMP code one MPI process master distributes work other MPI processes slaves do the work Implementation master reads job database and sends work information to slaves master runs two threads via OpenMP, one distributes the work, the other runs the work slave processes the information and runs the work (serially via fork() and execve() functions) 3/13/ Slide 16
17 Example 3 scheme Proces 0 - worker Proces 1 - master Thread 0 - master Thread 1 - worker Ask for work Do work via fork()/execv() Distribute work Ask for work Do work via fork()/execv() Master reads database with available jobs, and sends work requests to available workers 3/13/ Slide 17
18 MPICH2 on interactive nodes good enough for most parallel problems source /uufs/arches/sys/pkg/mpich2/std_pgi/etc/mpich2.csh mpicc submit.o g -o submit Running Start MPD daemon on the interactive node mpdboot n 1 if have problems, create ~/.mpd.conf file Run: open Totalview (totalview), then in New Program Window enter: program name MPICH2 for parallel sysem number of processors Example 3 MPI code Arches 3/13/ Slide 18
19 Example 3 MPI code Arches Running on compute nodes use larger number of processors or other MPI than MPICH2 is needed pgcc -g -mp -I/uufs/arches/sys/pkg/mpich/std/include submit.c pgcc submit.o -L/uufs/arches/sys/pkg/mpich/std/lib lmpich -o submit Running on compute nodes (large # of processors) contact CHPC to get ssh access to the nodes interactive PBS: qsub -I l nodes=2,walltime=2:00:00 hostname -i ssh to node name obtained above 3/13/ Slide 19

20 Example 3 MPI code Arches Running on interactive nodes run: /uufs/arches/sys/pkg/mpich/std/bin/mpirun tv np 2 machinefile $PBS_NODEFILE./submit modify path for the tdsvr Totalview server: Menu File Properties Launch strings /uufs/arches/sys/pkg/totalview/std/bin/tdvsvr Set a breakpoint after MPI_Init and select Go Select No or Yes at the next dialog, does not matter since we already have a breakpoint set Debug and enjoy 3/13/ Slide 20


21 MPI specific debugging Process synchronization program groups Barrier points Message queue state graph and display 3/13/ Slide 21
22 Memory debugging display memory status paint allocated and deallocated blocks find memory leaks identify dangling pointers enable with Tools > Memory Debugger > Enable memory debugging checkbox 3/13/ Slide 22
23 Some useful resources TotalviewTech webpage Location of Totalview Arches:/uufs/arches/sys/pkg/totalview/std Some group desktops: inquire at CHPC Documentation /13/ Slide 23
24 Totalview Student Edition Free for students Limited to one computer, 4 processes To sign up, mcuma@chpc.utah.edu: name university ID anticipated year of graduation More details 3/13/ Slide 24
25 Code checkers compilers check for syntax errors some compiler flags help too (-C) memory checking tools - many errors are due to bad memory management valgrind easy to use purify harder to use 3/13/ Slide 25
26 Thread checking Good for finding OpenMP errors race conditions privatization Intel thread checker (ITC) OpenMP pthreads 3/13/ Slide 26
27 Using ITC Source ITC environment source /uufs/arches/sys/pkg/itc/std/tcheck/bin/32e/tcheckvars.csh Compile with tcheck -g ifort -openmp -tcheck -g trap.f Run tcheck tcheck_cl./a.out More info /threadchecker/linux/ 3/13/ Slide 27
28 Future Presentations Mathematical libraries at the CHPC Chemistry packages (Anita Orendt) Using Gaussian (Anita Orendt) Performance analysis with TAU/Vampir Introduction to OpenMP MPI-IO Mixed MPI/OpenMP programming Intermediate MPI??? 3/13/ Slide 28
Introduction to debugging. Martin Čuma Center for High Performance Computing University of Utah
 Introduction to debugging Martin Čuma Center for High Performance Computing University of Utah m.cuma@utah.edu Overview Program errors Simple debugging Graphical debugging DDT and Totalview Intel tools
TotalView. Debugging Tool Presentation. Josip Jakić
 TotalView Debugging Tool Presentation Josip Jakić josipjakic@ipb.ac.rs Agenda Introduction Getting started with TotalView Primary windows Basic functions Further functions Debugging parallel programs Topics
Introduction to Parallel Programming. Martin Čuma Center for High Performance Computing University of Utah
 Introduction to Parallel Programming Martin Čuma Center for High Performance Computing University of Utah mcuma@chpc.utah.edu Overview Types of parallel computers. Parallel programming options. How to
Debugging with TotalView
 Debugging with TotalView Le Yan HPC Consultant User Services Goals Learn how to start TotalView on Linux clusters Get familiar with TotalView graphic user interface Learn basic debugging functions of TotalView
HPCC - Hrothgar. Getting Started User Guide TotalView. High Performance Computing Center Texas Tech University
 HPCC - Hrothgar Getting Started User Guide TotalView High Performance Computing Center Texas Tech University HPCC - Hrothgar 2 Table of Contents *This user guide is under development... 3 1. Introduction...
Introduction to Parallel Programming. Martin Čuma Center for High Performance Computing University of Utah
 Introduction to Parallel Programming Martin Čuma Center for High Performance Computing University of Utah m.cuma@utah.edu Overview Types of parallel computers. Parallel programming options. How to write
Debugging with TotalView
 Debugging with TotalView Dieter an Mey Center for Computing and Communication Aachen University of Technology anmey@rz.rwth-aachen.de 1 TotalView, Dieter an Mey, SunHPC 2006 Debugging on Sun dbx line mode
TotalView. Users Guide. August 2001 Version 5.0
 TotalView Users Guide August 2001 Version 5.0 Copyright 1999 2001 by Etnus LLC. All rights reserved. Copyright 1998 1999 by Etnus Inc. All rights reserved. Copyright 1996 1998 by Dolphin Interconnect Solutions,
Welcome. HRSK Practical on Debugging, Zellescher Weg 12 Willers-Bau A106 Tel
 Center for Information Services and High Performance Computing (ZIH) Welcome HRSK Practical on Debugging, 03.04.2009 Zellescher Weg 12 Willers-Bau A106 Tel. +49 351-463 - 31945 Matthias Lieber (matthias.lieber@tu-dresden.de)
Parallel Debugging with TotalView BSC-CNS
 Parallel Debugging with TotalView BSC-CNS AGENDA What debugging means? Debugging Tools in the RES Allinea DDT as alternative (RogueWave Software) What is TotalView Compiling Your Program Starting totalview
Debugging with GDB and DDT
 Debugging with GDB and DDT Ramses van Zon SciNet HPC Consortium University of Toronto June 28, 2012 1/41 Ontario HPC Summerschool 2012 Central Edition: Toronto Outline Debugging Basics Debugging with the
Debugging, benchmarking, tuning i.e. software development tools. Martin Čuma Center for High Performance Computing University of Utah
 Debugging, benchmarking, tuning i.e. software development tools Martin Čuma Center for High Performance Computing University of Utah m.cuma@utah.edu SW development tools Development environments Compilers
Hands-on Workshop on How To Debug Codes at the Institute
 Hands-on Workshop on How To Debug Codes at the Institute H. Birali Runesha, Shuxia Zhang and Ben Lynch (612) 626 0802 (help) help@msi.umn.edu October 13, 2005 Outline Debuggers at the Institute Totalview
SGI Altix Getting Correct Code Reiner Vogelsang SGI GmbH
 SGI Altix Getting Correct Code Reiner Vogelsang SGI GmbH reiner@sgi.com Module Objectives After completing the module, you will able to Find caveats and hidden errors in application codes Handle debuggers
Compiling applications for the Cray XC
 Compiling applications for the Cray XC Compiler Driver Wrappers (1) All applications that will run in parallel on the Cray XC should be compiled with the standard language wrappers. The compiler drivers
Improving the Productivity of Scalable Application Development with TotalView May 18th, 2010
 Improving the Productivity of Scalable Application Development with TotalView May 18th, 2010 Chris Gottbrath Principal Product Manager Rogue Wave Major Product Offerings 2 TotalView Technologies Family
Debugging Intel Xeon Phi KNC Tutorial
 Debugging Intel Xeon Phi KNC Tutorial Last revised on: 10/7/16 07:37 Overview: The Intel Xeon Phi Coprocessor 2 Debug Library Requirements 2 Debugging Host-Side Applications that Use the Intel Offload
TotalView. User Guide. June 2004 Version 6.5
 TotalView User Guide June 2004 Version 6.5 Copyright 1999 2004 by Etnus LLC. All rights reserved. Copyright 1998 1999 by Etnus, Inc. Copyright 1996 1998 by Dolphin Interconnect Solutions, Inc. Copyright
Parallel Debugging. ª Objective. ª Contents. ª Learn the basics of debugging parallel programs
 ª Objective ª Learn the basics of debugging parallel programs ª Contents ª Launching a debug session ª The Parallel Debug Perspective ª Controlling sets of processes ª Controlling individual processes
Debugging OpenMP Programs
 Debugging OpenMP Programs Dieter an Mey Center for Computing and Communication Aachen University anmey@rz.rwth-aachen.de aachen.de 1 Debugging OpenMP Programs General Hints dbx Sun IDE Debugger TotalView
Implementation of Parallelization
 Implementation of Parallelization OpenMP, PThreads and MPI Jascha Schewtschenko Institute of Cosmology and Gravitation, University of Portsmouth May 9, 2018 JAS (ICG, Portsmouth) Implementation of Parallelization
Introduction to OpenMP. Lecture 2: OpenMP fundamentals
 Introduction to OpenMP Lecture 2: OpenMP fundamentals Overview 2 Basic Concepts in OpenMP History of OpenMP Compiling and running OpenMP programs What is OpenMP? 3 OpenMP is an API designed for programming
Amdahl s Law. AMath 483/583 Lecture 13 April 25, Amdahl s Law. Amdahl s Law. Today: Amdahl s law Speed up, strong and weak scaling OpenMP
 AMath 483/583 Lecture 13 April 25, 2011 Amdahl s Law Today: Amdahl s law Speed up, strong and weak scaling OpenMP Typically only part of a computation can be parallelized. Suppose 50% of the computation
EE/CSCI 451 Introduction to Parallel and Distributed Computation. Discussion #4 2/3/2017 University of Southern California
 EE/CSCI 451 Introduction to Parallel and Distributed Computation Discussion #4 2/3/2017 University of Southern California 1 USC HPCC Access Compile Submit job OpenMP Today s topic What is OpenMP OpenMP
Introduction to OpenMP
 Introduction to OpenMP Lecture 2: OpenMP fundamentals Overview Basic Concepts in OpenMP History of OpenMP Compiling and running OpenMP programs 2 1 What is OpenMP? OpenMP is an API designed for programming
Hybrid MPI/OpenMP parallelization. Recall: MPI uses processes for parallelism. Each process has its own, separate address space.
 Hybrid MPI/OpenMP parallelization Recall: MPI uses processes for parallelism. Each process has its own, separate address space. Thread parallelism (such as OpenMP or Pthreads) can provide additional parallelism
DDT: A visual, parallel debugger on Ra
 DDT: A visual, parallel debugger on Ra David M. Larue dlarue@mines.edu High Performance & Research Computing Campus Computing, Communications, and Information Technologies Colorado School of Mines March,
Debugging with GDB and DDT
 Debugging with GDB and DDT Ramses van Zon SciNet HPC Consortium University of Toronto June 13, 2014 1/41 Ontario HPC Summerschool 2014 Central Edition: Toronto Outline Debugging Basics Debugging with the
ECMWF Workshop on High Performance Computing in Meteorology. 3 rd November Dean Stewart
 ECMWF Workshop on High Performance Computing in Meteorology 3 rd November 2010 Dean Stewart Agenda Company Overview Rogue Wave Product Overview IMSL Fortran TotalView Debugger Acumem ThreadSpotter 1 Copyright
High Performance Beowulf Cluster Environment User Manual
 High Performance Beowulf Cluster Environment User Manual Version 3.1c 2 This guide is intended for cluster users who want a quick introduction to the Compusys Beowulf Cluster Environment. It explains how
TotalView. User Guide. September 2003 Version 6.3
 TotalView User Guide September 2003 Version 6.3 Copyright 1999 2003 by Etnus LLC. All rights reserved. Copyright 1998 1999 by Etnus, Inc. Copyright 1996 1998 by Dolphin Interconnect Solutions, Inc. Copyright
Introduction to GALILEO
 November 27, 2016 Introduction to GALILEO Parallel & production environment Mirko Cestari m.cestari@cineca.it Alessandro Marani a.marani@cineca.it SuperComputing Applications and Innovation Department
Guillimin HPC Users Meeting July 14, 2016
 Guillimin HPC Users Meeting July 14, 2016 guillimin@calculquebec.ca McGill University / Calcul Québec / Compute Canada Montréal, QC Canada Outline Compute Canada News System Status Software Updates Training
PROGRAMMING MODEL EXAMPLES
 ( Cray Inc 2015) PROGRAMMING MODEL EXAMPLES DEMONSTRATION EXAMPLES OF VARIOUS PROGRAMMING MODELS OVERVIEW Building an application to use multiple processors (cores, cpus, nodes) can be done in various
Cray RS Programming Environment
 Cray RS Programming Environment Gail Alverson Cray Inc. Cray Proprietary Red Storm Red Storm is a supercomputer system leveraging over 10,000 AMD Opteron processors connected by an innovative high speed,
Parallel Processing Top manufacturer of multiprocessing video & imaging solutions.
 1 of 10 3/3/2005 10:51 AM Linux Magazine March 2004 C++ Parallel Increase application performance without changing your source code. Parallel Processing Top manufacturer of multiprocessing video & imaging
HPC on Windows. Visual Studio 2010 and ISV Software
 HPC on Windows Visual Studio 2010 and ISV Software Christian Terboven 19.03.2012 / Aachen, Germany Stand: 16.03.2012 Version 2.3 Rechen- und Kommunikationszentrum (RZ) Agenda
Parallel Computing: Overview
 Parallel Computing: Overview Jemmy Hu SHARCNET University of Waterloo March 1, 2007 Contents What is Parallel Computing? Why use Parallel Computing? Flynn's Classical Taxonomy Parallel Computer Memory
TotalView Users Guide. version 8.8
 TotalView Users Guide version 8.8 Copyright 2007 2010 by TotalView Technologies. All rights reserved Copyright 1998 2007 by Etnus LLC. All rights reserved. Copyright 1996 1998 by Dolphin Interconnect Solutions,
Debugging. P.Dagna, M.Cremonesi. May 2015
 Debugging P.Dagna, M.Cremonesi May 2015 Introduction Oneofthemostwidelyusedmethodstofindoutthereasonofa strange behavior in a program is the insertion of printf or write statements in the supposed critical
TotalView. Graphic User Interface Commands Guide. version 8.0
 TotalView Graphic User Interface Commands Guide version 8.0 Copyright 1998 2006 by Etnus LLC. All rights reserved. Copyright 1996 1998 by Dolphin Interconnect Solutions, Inc. Copyright 1993 1996 by BBN
Eliminate Threading Errors to Improve Program Stability
 Introduction This guide will illustrate how the thread checking capabilities in Intel Parallel Studio XE can be used to find crucial threading defects early in the development cycle. It provides detailed
Why Combine OpenMP and MPI
 Why Combine OpenMP and MPI OpenMP might not require copies of data structures Can have some interesting designs that overlap computation and communication Overcome the limits of small processor counts
Module 4: Working with MPI
 Module 4: Working with MPI Objective Learn how to develop, build and launch a parallel (MPI) program on a remote parallel machine Contents Remote project setup Building with Makefiles MPI assistance features
Addressing the Increasing Challenges of Debugging on Accelerated HPC Systems. Ed Hinkel Senior Sales Engineer
 Addressing the Increasing Challenges of Debugging on Accelerated HPC Systems Ed Hinkel Senior Sales Engineer Agenda Overview - Rogue Wave & TotalView GPU Debugging with TotalView Nvdia CUDA Intel Phi 2
Introduction to PICO Parallel & Production Enviroment
 Introduction to PICO Parallel & Production Enviroment Mirko Cestari m.cestari@cineca.it Alessandro Marani a.marani@cineca.it Domenico Guida d.guida@cineca.it Nicola Spallanzani n.spallanzani@cineca.it
PRACE Autumn School Basic Programming Models
 PRACE Autumn School 2010 Basic Programming Models Basic Programming Models - Outline Introduction Key concepts Architectures Programming models Programming languages Compilers Operating system & libraries
Debugging. John Lockman Texas Advanced Computing Center
 Debugging John Lockman Texas Advanced Computing Center Debugging Outline GDB Basic use Attaching to a running job DDT Identify MPI problems using Message Queues Catch memory errors PTP For the extremely
Orna Agmon Ben-Yehuda. OpenMP Usage. March 15, 2009 OpenMP Usage Slide 1
 OpenMP Usage Orna Agmon Ben-Yehuda March 15, 2009 OpenMP Usage Slide 1 What is this talk about? Dilemmas I encountered when transforming legacy code using openmp Tricks I found to make my life easier The
OpenMP Programming. Prof. Thomas Sterling. High Performance Computing: Concepts, Methods & Means
 High Performance Computing: Concepts, Methods & Means OpenMP Programming Prof. Thomas Sterling Department of Computer Science Louisiana State University February 8 th, 2007 Topics Introduction Overview
The Distributed Debugging Tool
 The Distributed Debugging Tool Userguide - PAGE 1 - - PAGE 2 - Contents Contents... 3 1. Introduction... 7 2. Installation... 8 Licence Files... 8 Floating Licences... 9 Getting Help... 10 3. Starting
Le Yan Louisiana Optical Network Initiative. 8/3/2009 Scaling to Petascale Virtual Summer School
 Parallel Debugging Techniques Le Yan Louisiana Optical Network Initiative 8/3/2009 Scaling to Petascale Virtual Summer School Outline Overview of parallel debugging Challenges Tools Strategies Gtf Get
Shared memory programming model OpenMP TMA4280 Introduction to Supercomputing
 Shared memory programming model OpenMP TMA4280 Introduction to Supercomputing NTNU, IMF February 16. 2018 1 Recap: Distributed memory programming model Parallelism with MPI. An MPI execution is started
Facing the challenges of. New Approaches To Debugging Complex Codes! Ed Hinkel, Sales Engineer Rogue Wave Software
 Facing the challenges of or New Approaches To Debugging Complex Codes! Ed Hinkel, Sales Engineer Rogue Wave Software Agenda Introduction Rogue Wave! TotalView! Approaching the Debugging Challenge! 1 TVScript
Introduction to GALILEO
 Introduction to GALILEO Parallel & production environment Mirko Cestari m.cestari@cineca.it Alessandro Marani a.marani@cineca.it Alessandro Grottesi a.grottesi@cineca.it SuperComputing Applications and
Combining OpenMP and MPI
 Combining OpenMP and MPI Timothy H. Kaiser,Ph.D.. tkaiser@mines.edu 1 Overview Discuss why we combine MPI and OpenMP Intel Compiler Portland Group Compiler Run Scripts Challenge: What works for Stommel
Lecture 4: OpenMP Open Multi-Processing
 CS 4230: Parallel Programming Lecture 4: OpenMP Open Multi-Processing January 23, 2017 01/23/2017 CS4230 1 Outline OpenMP another approach for thread parallel programming Fork-Join execution model OpenMP
Introduction to Parallel Programming
 Introduction to Parallel Programming Overview Parallel programming allows the user to use multiple cpus concurrently Reasons for parallel execution: shorten execution time by spreading the computational
OpenMP - Introduction
 OpenMP - Introduction Süha TUNA Bilişim Enstitüsü UHeM Yaz Çalıştayı - 21.06.2012 Outline What is OpenMP? Introduction (Code Structure, Directives, Threads etc.) Limitations Data Scope Clauses Shared,
Table of Contents. Table of Contents Job Manager for remote execution of QuantumATK scripts. A single remote machine
 Table of Contents Table of Contents Job Manager for remote execution of QuantumATK scripts A single remote machine Settings Environment Resources Notifications Diagnostics Save and test the new machine
Multithreading in C with OpenMP
 Multithreading in C with OpenMP ICS432 - Spring 2017 Concurrent and High-Performance Programming Henri Casanova (henric@hawaii.edu) Pthreads are good and bad! Multi-threaded programming in C with Pthreads
STARTING THE DDT DEBUGGER ON MIO, AUN, & MC2. (Mouse over to the left to see thumbnails of all of the slides)
") STARTING THE DDT DEBUGGER ON MIO, AUN, & MC2 (Mouse over to the left to see thumbnails of all of the slides) ALLINEA DDT Allinea DDT is a powerful, easy-to-use graphical debugger capable of debugging a
STARTING THE DDT DEBUGGER ON MIO, AUN, & MC2 (Mouse over to the left to see thumbnails of all of the slides) ALLINEA DDT Allinea DDT is a powerful, easy-to-use graphical debugger capable of debugging a
Getting Started with TotalView on Beacon
 Getting Started with TotalView on Beacon 1) ssh X uname@beacon.nics.utk.edu (sets x forwarding so you can use the GUI) 2) qsub X I A UT- AACE- BEACON (sets x forwarding in the interactive job) 3) compile
Effective Use of CCV Resources
 Effective Use of CCV Resources Mark Howison User Services & Support This talk... Assumes you have some familiarity with a Unix shell Provides examples and best practices for typical usage of CCV systems
Scientific Computing
 Lecture on Scientific Computing Dr. Kersten Schmidt Lecture 20 Technische Universität Berlin Institut für Mathematik Wintersemester 2014/2015 Syllabus Linear Regression, Fast Fourier transform Modelling
Tech Computer Center Documentation
 Tech Computer Center Documentation Release 0 TCC Doc February 17, 2014 Contents 1 TCC s User Documentation 1 1.1 TCC SGI Altix ICE Cluster User s Guide................................ 1 i ii CHAPTER 1
Introduction to OpenMP
 Presentation Introduction to OpenMP Martin Cuma Center for High Performance Computing University of Utah mcuma@chpc.utah.edu September 9, 2004 http://www.chpc.utah.edu 4/13/2006 http://www.chpc.utah.edu
Eliminate Memory Errors to Improve Program Stability
 Introduction INTEL PARALLEL STUDIO XE EVALUATION GUIDE This guide will illustrate how Intel Parallel Studio XE memory checking capabilities can find crucial memory defects early in the development cycle.
Data and File Structures Laboratory
 Tools: GDB, Valgrind Assistant Professor Machine Intelligence Unit Indian Statistical Institute, Kolkata August, 2018 1 GDB 2 Valgrind A programmer s experience Case I int x = 10, y = 25; x = x++ + y++;
Shared Memory Programming Model
 Shared Memory Programming Model Ahmed El-Mahdy and Waleed Lotfy What is a shared memory system? Activity! Consider the board as a shared memory Consider a sheet of paper in front of you as a local cache
Debugging Programs Accelerated with Intel Xeon Phi Coprocessors
 Debugging Programs Accelerated with Intel Xeon Phi Coprocessors A White Paper by Rogue Wave Software. Rogue Wave Software 5500 Flatiron Parkway, Suite 200 Boulder, CO 80301, USA www.roguewave.com Debugging
Eliminate Threading Errors to Improve Program Stability
 Eliminate Threading Errors to Improve Program Stability This guide will illustrate how the thread checking capabilities in Parallel Studio can be used to find crucial threading defects early in the development
Introduction to HPC Numerical libraries on FERMI and PLX
 Introduction to HPC Numerical libraries on FERMI and PLX HPC Numerical Libraries 11-12-13 March 2013 a.marani@cineca.it WELCOME!! The goal of this course is to show you how to get advantage of some of
TotalView Training. Developing parallel, data-intensive applications is hard. We make it easier. Copyright 2012 Rogue Wave Software, Inc.
 TotalView Training Developing parallel, data-intensive applications is hard. We make it easier. 1 Agenda Introduction Startup Remote Display Debugging UI Navigation and Process Control Action Points Data
Parallelising Scientific Codes Using OpenMP. Wadud Miah Research Computing Group
 Parallelising Scientific Codes Using OpenMP Wadud Miah Research Computing Group Software Performance Lifecycle Scientific Programming Early scientific codes were mainly sequential and were executed on
Introduction to OpenMP. OpenMP basics OpenMP directives, clauses, and library routines
 Introduction to OpenMP Introduction OpenMP basics OpenMP directives, clauses, and library routines What is OpenMP? What does OpenMP stands for? What does OpenMP stands for? Open specifications for Multi
GPU Debugging Made Easy. David Lecomber CTO, Allinea Software
 GPU Debugging Made Easy David Lecomber CTO, Allinea Software david@allinea.com Allinea Software HPC development tools company Leading in HPC software tools market Wide customer base Blue-chip engineering,
Debugging process. The debugging process can be divided into four main steps: 1. Start your program, specifying anything that might affect its
 Debugging Introduction One of the most widely used methods to find out the reason of a strange behavior in a program is the insertion of printf or write statements in the supposed critical area. However
Parallel Debugging. Matthias Müller, Pavel Neytchev, Rainer Keller, Bettina Krammer
 Parallel Debugging Matthias Müller, Pavel Neytchev, Rainer Keller, Bettina Krammer University of Stuttgart High-Performance Computing-Center Stuttgart (HLRS) www.hlrs.de Höchstleistungsrechenzentrum Stuttgart
TotalView Release Notes
 Platform Changes The following new platforms are now supported by TotalView: NVIDIA CUDA 5.0 and 5.5 Mac OS X Mavericks (10.9) Ubuntu 12.04, 12.10 and 13.04 Fedora 19 The following platforms are no longer
Introduction to CINECA HPC Environment
 Introduction to CINECA HPC Environment 23nd Summer School on Parallel Computing 19-30 May 2014 m.cestari@cineca.it, i.baccarelli@cineca.it Goals You will learn: The basic overview of CINECA HPC systems
CMSC 714 Lecture 4 OpenMP and UPC. Chau-Wen Tseng (from A. Sussman)
") CMSC 714 Lecture 4 OpenMP and UPC Chau-Wen Tseng (from A. Sussman) Programming Model Overview Message passing (MPI, PVM) Separate address spaces Explicit messages to access shared data Send / receive (MPI
CMSC 714 Lecture 4 OpenMP and UPC Chau-Wen Tseng (from A. Sussman) Programming Model Overview Message passing (MPI, PVM) Separate address spaces Explicit messages to access shared data Send / receive (MPI
CS 261 Fall Mike Lam, Professor. Threads
 CS 261 Fall 2017 Mike Lam, Professor Threads Parallel computing Goal: concurrent or parallel computing Take advantage of multiple hardware units to solve multiple problems simultaneously Motivations: Maintain
Concurrency, Thread. Dongkun Shin, SKKU
 Concurrency, Thread 1 Thread Classic view a single point of execution within a program a single PC where instructions are being fetched from and executed), Multi-threaded program Has more than one point
Combining OpenMP and MPI. Timothy H. Kaiser,Ph.D..
 Combining OpenMP and MPI Timothy H. Kaiser,Ph.D.. tkaiser@mines.edu 1 Overview Discuss why we combine MPI and OpenMP Intel Compiler Portland Group Compiler Run Scripts Challenge: What works for Stommel
Programming Environment 4/11/2015
 Programming Environment 4/11/2015 1 Vision Cray systems are designed to be High Productivity as well as High Performance Computers The Cray Programming Environment (PE) provides a simple consistent interface
COMP4510 Introduction to Parallel Computation. Shared Memory and OpenMP. Outline (cont d) Shared Memory and OpenMP
 Shared Memory and OpenMP") COMP4510 Introduction to Parallel Computation Shared Memory and OpenMP Thanks to Jon Aronsson (UofM HPC consultant) for some of the material in these notes. Outline (cont d) Shared Memory and OpenMP Including
COMP4510 Introduction to Parallel Computation Shared Memory and OpenMP Thanks to Jon Aronsson (UofM HPC consultant) for some of the material in these notes. Outline (cont d) Shared Memory and OpenMP Including
Chapter 4: Threads. Operating System Concepts 9 th Edit9on
 Chapter 4: Threads Operating System Concepts 9 th Edit9on Silberschatz, Galvin and Gagne 2013 Chapter 4: Threads 1. Overview 2. Multicore Programming 3. Multithreading Models 4. Thread Libraries 5. Implicit
Our new HPC-Cluster An overview
 Our new HPC-Cluster An overview Christian Hagen Universität Regensburg Regensburg, 15.05.2009 Outline 1 Layout 2 Hardware 3 Software 4 Getting an account 5 Compiling 6 Queueing system 7 Parallelization
Practical Introduction to
 1 2 Outline of the workshop Practical Introduction to What is ScaleMP? When do we need it? How do we run codes on the ScaleMP node on the ScaleMP Guillimin cluster? How to run programs efficiently on ScaleMP?
GDB-UPC for GCC-UPC SMP runtime. GDB-UPC features. GDB features. Multiprocessing support in GDB. GDB UPC for SMP runtime Intrepid Technology, Inc.
 GDB-UPC for GCC-UPC SMP runtime Author: Nenad Vukicevic nenad@intrepid.com The goal of the GDB-UPC project is to enable debugging of programs that use GCC-UPC s SMP based runtime running on a single computing
Introductory OpenMP June 2008
 5: http://people.sc.fsu.edu/ jburkardt/presentations/ fdi 2008 lecture5.pdf... John Information Technology Department Virginia Tech... FDI Summer Track V: Parallel Programming 10-12 June 2008 Introduction
The Eclipse Parallel Tools Platform
 May 1, 2012 Toward an Integrated Development Environment for Improved Software Engineering on Crays Agenda 1. What is the Eclipse Parallel Tools Platform (PTP) 2. Tour of features available in Eclipse/PTP
!OMP #pragma opm _OPENMP
 Advanced OpenMP Lecture 12: Tips, tricks and gotchas Directives Mistyping the sentinel (e.g.!omp or #pragma opm ) typically raises no error message. Be careful! The macro _OPENMP is defined if code is
DDT Debugging Techniques
 DDT Debugging Techniques Carlos Rosales carlos@tacc.utexas.edu Scaling to Petascale 2010 July 7, 2010 Debugging Parallel Programs Usual problems Memory access issues Special cases not accounted for in
OpenMP Introduction. CS 590: High Performance Computing. OpenMP. A standard for shared-memory parallel programming. MP = multiprocessing
 CS 590: High Performance Computing OpenMP Introduction Fengguang Song Department of Computer Science IUPUI OpenMP A standard for shared-memory parallel programming. MP = multiprocessing Designed for systems
Debugging and Optimizing Programs Accelerated with Intel Xeon Phi Coprocessors
 Debugging and Optimizing Programs Accelerated with Intel Xeon Phi Coprocessors Chris Gottbrath Rogue Wave Software Boulder, CO Chris.Gottbrath@roguewave.com Abstract Intel Xeon Phi coprocessors present
Shared Memory programming paradigm: openmp
 IPM School of Physics Workshop on High Performance Computing - HPC08 Shared Memory programming paradigm: openmp Luca Heltai Stefano Cozzini SISSA - Democritos/INFM