XDS560 Trace. Technology Showcase. Daniel Rinkes Texas Instruments
|
|
|
- Bennett Cain
- 6 years ago
- Views:
Transcription

1 XDS560 Trace Technology Showcase Daniel Rinkes Texas Instruments
2 Agenda AET / XDS560 Trace Overview Interrupt Profiling Statistical Profiling Thread Aware Profiling Thread Aware Dynamic Call Graph
3 Agenda AET / XDS560 Trace Overview Interrupt Profiling Statistical Profiling Thread Aware Profiling Thread Aware Dynamic Call Graph
4 What is XDS560Trace? XDS560 Trace is a combination of hardware and software that allows non-intrusive logging of CPU Program and Data Bus activity Data is gathered and compressed on the target, and passed up to the XDS560 Trace Pod via an additional 15 EMU Pins (Currently uses up to 12 total) The data is then decompressed on the host and displayed for the user. Visibility into CPU Register Values/Reads/Writes Visibility into EDMA Activity Multi Core XDS560 Trace is Not
5 Trace Architecture DATA ADDRESS BUSSES CPU DATA BUSSES PROGRAM BUS Trace & AET Jobs Comparators Compressor Cycle counter DSP XDS560T POD Additional JTAG Emulation Pins Current Buffer Size: 224K Future: 64 MB XDS560T POD RECORDING UNIT To/from host PC
6 OK so what is AET Advanced Event Triggering (AET) On-Chip programmable logic that can be programmed to generate triggers based on application events or combinations of application events
7 AET Hardware Overview
8 AET Job Examples Trace PC whenever the PC is between location A and B (PC Trace in Range) Trace all writes to memory location 0x (Data Trace) Halt whenever the application executes the instruction at location 0x801000, but only after it has executed the instruction at 0x (Hardware Breakpoint qualified by a Sequencer State) Halt when the value 0x is written to location 0x (Halt on Data Write qualified by value)


9 Required Software and Hardware 60 Pin emulation header Target must support Trace (Full-Gem) Blackhawk USB 560 XDS560T Trace Pod/Cable CCS 3.30 or higher
10 XDS560 Trace Use Cases Debugging Branch to uninitialized memory Invalid Writes to specific locations in memory Order of execution Interrupts Disabled
11 XDS560 Trace Use Cases - 2 Profiling & Application Analysis Find the most cycle intensive functions in an application Display a Cycle Accurate Thread Execution Graph Provide Function Profile information in a thread specific context All in a matter of minutes
12 Profiling Advantages Over Traditional Methods Memory/Cache/Peripheral Effects all inherently considered Real-Time, Cycle Accurate, and Completely Non-Intrusive to the application It s fast results in minutes
13 Agenda AET / XDS560 Trace Overview Interrupt Profiling Statistical Profiling Thread Aware Profiling Thread Aware Dynamic Call Graph
14 Interrupt Profiling Overview Graphically display interrupt cycle accurate interrupt servicing frequency Capture Program Address and Timestamp whenever the PC is within the Interrupt Vector Table Generate a cycle accurate picture of when each interrupt starts executing

15 Trace Log PC Cycles 0x00897C x00897C x00897C x00897C6C x00897C x00897C x00897C x00897C7C Cycle Count


16 Raw Trace Data Data Captured Processed Data
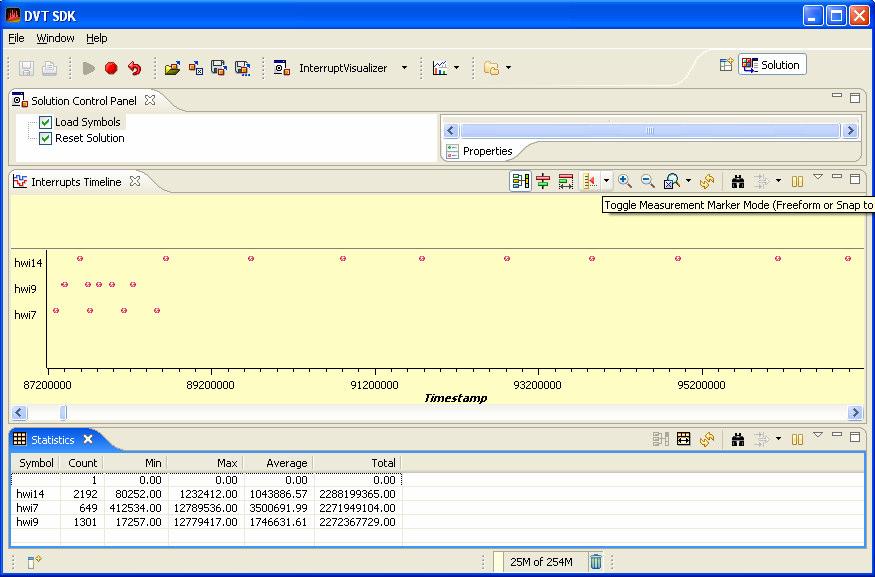
17 Results

18 Results - 2
19 Agenda AET / XDS560 Trace Overview Interrupt Profiling Statistical Profiling Thread Aware Profiling Thread Aware Dynamic Call Graph
20 Statistical Profiling GOAL Get a quick overall view of which functions in an application consume the most cycles Sampling every Program Counter in an application quickly consumes Trace Buffer Bandwidth, preventing analysis of the entire application We can eliminate this problem by only capturing a statistical sample of application execution
21 Fxn1 Fxn2 Fxn3 Fxn4 Fxn5 Fxn6 Statistical Profiling Overview The Program Address is sampled at regular intervals Statistical Analysis is performed on the captured samples As in any statistical analysis, the determinations made on the statistical sample can be related to the general population
22 Statistical Profiling - 2 AET contains all of the hardware needed to capture trace samples at a specified interval Interval should be carefully chose so as not to coincide with a periodic function Application instrumentation can switch AET off in locations that are not of interest

23 Statistical Profiling - Results Comma Separated Value Format Sorted from most intensive functions to least
24 Agenda AET / XDS560 Trace Overview Statistical Profiling Interrupt Profiling Thread Aware Profiling Thread Aware Dynamic Call Graph
25 Thread Aware Profiling GOAL Generate a cycle accurate execution graph of a Thread/Task based application Time (cycles)
26 Solution Instrument the task/thread switch function to write the task/thread ID to a well known location (global variable) Operating systems typically provide hooks to insert functions in this location Trace all of the writes to that location, and get a timestamp with each.
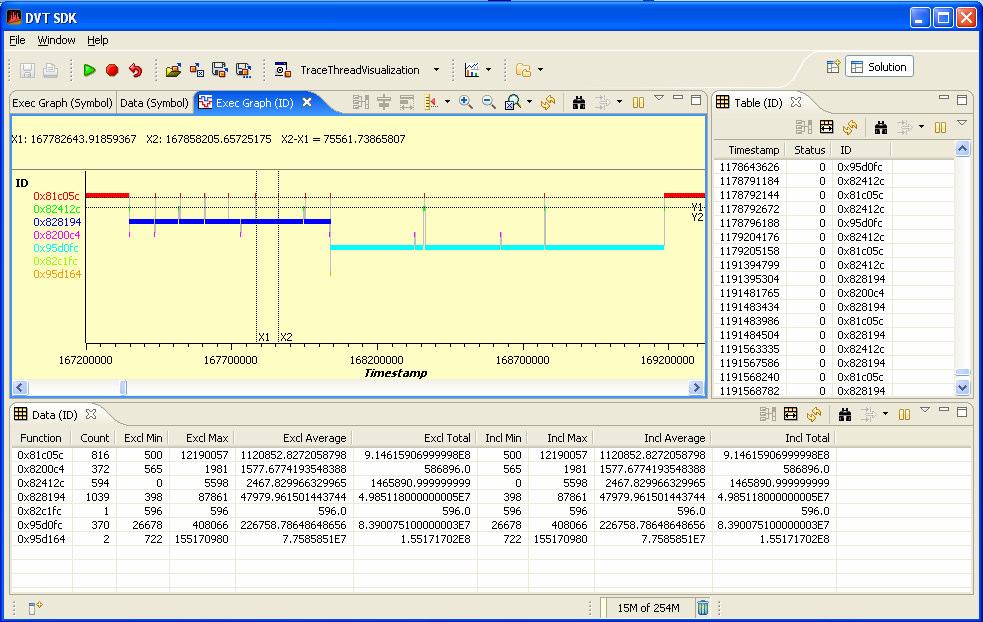
27 Results
28 Agenda AET / XDS560 Trace Overview Statistical Profiling Interrupt Profiling Thread Aware Profiling Thread Aware Dynamic Call Graph
29 65 Thread Aware Dynamic Call Graph 200 GOAL Display a Thread Based representation of actual function execution in an application
30 Capturing the Data Thread/Task Hook function writes address of task Function Entry/Exit points instrumented with Mark 0/ Mark 1 instructions* Mark 0 inlined at each function entry point Mark 1 inlined at each function exit point Trace captures each of these locations with timestamp * CGT enables function hooks

31 Graphical Displays become impractical as the number of functions increase Presentation At right is a sample call graph displayed by the Guess graphing package

32 Modeled after Unix GPROF Each Thread separated into it s own subsection Each function section contains only immediate callers and callees GPROF Like Format
33 A Closer Look Lines Primary for a Functions Line - describes Callees Callers the function which the entry is about and gives the overall statistics for this function
34 Future Display Tree View Thread: 0x _DEC_tcp2DeintUnpunctsoft3 _DEC_tcp2QuantizeSoft Callers Callees _DEC_tcp2PreProc _varianceestim Calls = 388/388 _COM_spoolTsk Exclusive Cycles = _COM_spoolPost _DEC_tcp2EdmaIsr
35 Questions?
XDS560 Trace. Advanced Use Cases for Profiling. Daniel Rinkes Texas Instruments
 XDS560 Trace Advanced Use Cases for Profiling Daniel Rinkes Texas Instruments Agenda AET / XDS560Trace Overview Interrupt Profiling Statistical Profiling Thread Aware Profiling Thread Aware Dynamic Call
file://c:\documents and Settings\degrysep\Local Settings\Temp\~hh607E.htm
 Page 1 of 18 Trace Tutorial Overview The objective of this tutorial is to acquaint you with the basic use of the Trace System software. The Trace System software includes the following: The Trace Control
April 4, 2001: Debugging Your C24x DSP Design Using Code Composer Studio Real-Time Monitor
 1 This presentation was part of TI s Monthly TMS320 DSP Technology Webcast Series April 4, 2001: Debugging Your C24x DSP Design Using Code Composer Studio Real-Time Monitor To view this 1-hour 1 webcast
SMT107 User Manual User Manual (QCF42); Version 3.0, 8/11/00; Sundance Multiprocessor Technology Ltd. 1999
; Version 3.0, 8/11/00; Sundance Multiprocessor Technology Ltd. 1999") SMT107 User Manual User Manual (QCF42); Version 3.0, 8/11/00; Sundance Multiprocessor Technology Ltd. 1999 Version 1.2 Page 2 of 16 SMT107 User Manual Revision History Date Comments Engineer Version 20/04/01
SMT107 User Manual User Manual (QCF42); Version 3.0, 8/11/00; Sundance Multiprocessor Technology Ltd. 1999 Version 1.2 Page 2 of 16 SMT107 User Manual Revision History Date Comments Engineer Version 20/04/01
Using ARM ETB with TI CCS. CCS 3.3 with SR9 on TMS320DM6446
 Using ARM ETB with TI CCS CCS 3.3 with SR9 on TMS320DM6446 1 ETB Usage Brief Tutorial 1. Setup CCS setup configuration to include the ETB. 2. Connect to the target (including the ETB) 3. Select the ETB
XDS200 ISO Operating Guide
 XDS200 ISO Operating Guide Wintech Dig ital System Technology Co., Ltd www.wintechdigital.com 1 About This Manual IMPORTANT INFORMATION This Installation Guide is for the Wintech Digital XDS200 ISO JTAG
Advanced Debugging using the Ashling MPC5500 tools
 Ashling Product Brief APB200 Advanced Debugging using the Ashling MPC5500 tools 1. Contents 1. Contents 1 2. Introduction 1 3. Break on Data Access 1 4. Tracing Accesses to a Variable 3 4.1 Cycle accurate
KeyStone Training. Keystone Architecture Debug
 Keytone Training Keystone Architecture Debug Debug Overview As devices get more complicated and more IP is integrated into the device (oc) there is a requirement to provide sufficient hooks in the silicon
XDS560V2 Installation Guide
 XDS560V2 Installation Guide Wintech Digital System Co., Ltd http://www.wintechdigital.com 1 About This Manual IMPORTANT INFORMATION This Installation Guide is for the Wintech Digital XDS560v2 JTAG Emulator
Managing Complex Trace Filtering and Triggering Capabilities of CoreSight. Jens Braunes pls Development Tools
 Managing Complex Trace Filtering and Triggering Capabilities of CoreSight Jens Braunes pls Development Tools Outline 2 Benefits and challenges of on-chip trace The evolution of embedded systems and the
UAD2 + Universal Access Device2 plus
 UAD2 + Universal Access Device2 plus The access to the whole choice of C166, XC166, XC2000, XE166, C166CBC, C166S V2, TriCore, PowerPC, ST30, STR7, ARM7, ARM9, ARM11, XScale, SH-2A derivatives is supported
Tracking the Virtual World
 Tracking the Virtual World Synopsys: For many years the JTAG interface has been used for ARM-based SoC debugging. With this JTAG style debugging, the developer has been granted the ability to debug software
4 DEBUGGING. In This Chapter. Figure 2-0. Table 2-0. Listing 2-0.
 4 DEBUGGING Figure 2-0. Table 2-0. Listing 2-0. In This Chapter This chapter contains the following topics: Debug Sessions on page 4-2 Code Behavior Analysis Tools on page 4-8 DSP Program Execution Operations
This chapter introduces how to use the emulator of TOPICE quickly.
 Quick Starting Summarization This chapter introduces how to use the emulator of TOPICE quickly. Compiling Source and Debugging Creating a New Project Select main menu Project, then choose the submenu New
EB-51 Low-Cost Emulator
 EB-51 Low-Cost Emulator Development Tool for 80C51 Microcontrollers FEATURES Emulates 80C51 Microcontrollers and Derivatives Real-Time Operation up to 40 MHz 3.3V or 5V Voltage Operation Source-Level Debugger
Performance analysis basics
 Performance analysis basics Christian Iwainsky Iwainsky@rz.rwth-aachen.de 25.3.2010 1 Overview 1. Motivation 2. Performance analysis basics 3. Measurement Techniques 2 Why bother with performance analysis
PSIM Tutorial. How to Use SCI for Real-Time Monitoring in F2833x Target. February Powersim Inc.
 PSIM Tutorial How to Use SCI for Real-Time Monitoring in F2833x Target February 2013-1 - With the SimCoder Module and the F2833x Hardware Target, PSIM can generate ready-to-run codes for DSP boards that
Speeding AM335x Programmable Realtime Unit (PRU) Application Development Through Improved Debug Tools
 Application Development Through Improved Debug Tools") Speeding AM335x Programmable Realtime Unit (PRU) Application Development Through Improved Debug Tools The hardware modules and descriptions referred to in this document are *NOT SUPPORTED* by Texas Instruments
Speeding AM335x Programmable Realtime Unit (PRU) Application Development Through Improved Debug Tools The hardware modules and descriptions referred to in this document are *NOT SUPPORTED* by Texas Instruments
System Debug. This material exempt per Department of Commerce license exception TSU Xilinx, Inc. All Rights Reserved
 System Debug This material exempt per Department of Commerce license exception TSU Objectives After completing this module, you will be able to: Describe GNU Debugger (GDB) functionality Describe Xilinx
Support for RISC-V. Lauterbach GmbH. Bob Kupyn Lauterbach Markus Goehrle - Lauterbach GmbH
 Company Lauterbach Profile Debug Support for RISC-V Lauterbach GmbH Bob Kupyn Lauterbach USA @2016 Markus Goehrle - Lauterbach GmbH Leading Manufacturer of Microprocessor Development Tools Founded in 1979
NEW CEIBO DEBUGGER. Menus and Commands
 NEW CEIBO DEBUGGER Menus and Commands Ceibo Debugger Menus and Commands D.1. Introduction CEIBO DEBUGGER is the latest software available from Ceibo and can be used with most of Ceibo emulators. You will
Blackhawk USB560v2 Operating Mode Details and Instructions
 Blackhawk USB560v2 Operating Mode Details and Instructions Table of Contents Table of Figures... 2 Blackhawk USB560v2 Operating Mode Details and Instructions... 3 Operating Modes... 3 Normal Mode... 3
TDS510USB-C2K Emulator Installation Guide
 TDS510USB-C2K Emulator Installation Guide Wintech Digital Systems Technology Corp. http://www.wintechdigital.com IMPORTANT INFORMATION About This Manual This Installation Guide is for the TDS510USB-C2K
Enterprise Architect. User Guide Series. Profiling
 Enterprise Architect User Guide Series Profiling Investigating application performance? The Sparx Systems Enterprise Architect Profiler finds the actions and their functions that are consuming the application,
Enterprise Architect. User Guide Series. Profiling. Author: Sparx Systems. Date: 10/05/2018. Version: 1.0 CREATED WITH
 Enterprise Architect User Guide Series Profiling Author: Sparx Systems Date: 10/05/2018 Version: 1.0 CREATED WITH Table of Contents Profiling 3 System Requirements 8 Getting Started 9 Call Graph 11 Stack
Enabling safer embedded systems
 Advanced AUTOSAR Profiling and Run-Time Optimization incorporating Operating System, RTE and Network Communication. Enabling safer embedded systems Using Trace for Run-Time Analysis of an AUTOSAR Application
KeyStone Training. Keystone Device Tooling
 KeyStone Training Keystone Device Tooling Agenda Code Composer Studio v4 Keystone Architecture Simulator Multicore Application Deployment OpenMP Initiative Code Composer Studio v4 Code Composer Studio
Homework 9: Software Design Considerations
 Homework 9: Software Design Considerations Team Code Name: Mind Readers Group No. 2 Team Member Completing This Homework: Richard Schuman E-mail Address of Team Member: _rschuman_ @ purdue.edu Evaluation:
PSIM Tutorial. How to Use SPI in F2833x Target. February Powersim Inc.
 PSIM Tutorial How to Use SPI in F2833x Target February 2013-1 - Powersim Inc. With the SimCoder Module and the F2833x Hardware Target, PSIM can generate ready-to-run codes for DSP boards that use TI F2833x
All information, including contact information, is available on our web site Feel free also to explore our alternative products.
 _ V1.3 POD Hardware Reference Zilog Z180 POD rev. C Ordering code IC81012-20 Thank you for purchasing this product from isystem. This product has been carefully crafted to satisfy your needs. Should any
Configuring Code Composer Studio for OMAP Debugging
 Application Report SPRA807 - November 2001 Configuring Code Composer Studio for OMAP Debugging Harry Thompson Software Development Systems/Customer Support ABSTRACT The OMAP Code Composer Studio (CCStudio)
Keil uvision development story (Adapted from (Valvano, 2014a))
)") Introduction uvision has powerful tools for debugging and developing C and Assembly code. For debugging a code, one can either simulate it on the IDE s simulator or execute the code directly on ta Keil
Introduction uvision has powerful tools for debugging and developing C and Assembly code. For debugging a code, one can either simulate it on the IDE s simulator or execute the code directly on ta Keil
Tracing mfence White Paper
 Tracing mfence White Paper Doug Deao Texas Instruments @Copyright Texas Instruments 2013. All rights reserved Document History Revision Modifications 0.4 Added Alert Appendix to the end of the document.
Olimex Field Update Kit
 Olimex Field Update Kit Table of Contents Overview... 2 To download the field update software... 2 To install the HQLoader software... 2 To install the USB to Serial Converter driver... 2 To install the
The PCMCIA DSP Card: An All-in-One Communications System
 The PCMCIA DSP Card: An All-in-One Communications System Application Report Raj Chirayil Digital Signal Processing Applications Semiconductor Group SPRA145 October 1994 Printed on Recycled Paper IMPORTANT
Verifying big.little using the Palladium XP. Deepak Venkatesan Murtaza Johar ARM India
 Verifying big.little using the Palladium XP Deepak Venkatesan Murtaza Johar ARM India 1 Agenda PART 1 big.little overview What is big.little? ARM Functional verification methodology System Validation System
RTOS Debugger for ChibiOS/RT
 RTOS Debugger for ChibiOS/RT TRACE32 Online Help TRACE32 Directory TRACE32 Index TRACE32 Documents... RTOS Debuggers... RTOS Debugger for ChibiOS/RT... 1 Overview... 3 Brief Overview of Documents for New
Blackhawk USB560v2 System Trace Emulator. Installation Guide
 Blackhawk USB560v2 System Trace Emulator Installation Guide USB560v2-IG-01 APRIL 2012 Blackhawk USB560v2 System Trace Emulator Installation Guide IMPORTANT IMFORMATION 2012 EWA Technologies, Inc. All rights
UCD3138. JTAG Configuration. Using CCS 6
 UCD3138 JTAG MANUAL UCD3138 JTAG Configuration Using CCS 6 TI NDA Preliminary Document October 6 2014 PRODUCT PREVIEW information concerns products in the formative or design phase of development. Characteristic
CodeWarrior Development Studio for QorIQ LS series - ARM V8 ISA, Tracing and Analysis User Guide
 NXP Semiconductors Document Number: CWARMv8TAUG Reference Manual Rev. 11.3.0, 12/2017 CodeWarrior Development Studio for QorIQ LS series - ARM V8 ISA, Tracing and Analysis User Guide Contents Contents
Renesas 78K/78K0R/RL78 Family In-Circuit Emulation
 _ Technical Notes V9.12.225 Renesas 78K/78K0R/RL78 Family In-Circuit Emulation This document is intended to be used together with the CPU reference manual provided by the silicon vendor. This document
Design and Implementation of a FPGA-based Pipelined Microcontroller
 Design and Implementation of a FPGA-based Pipelined Microcontroller Rainer Bermbach, Martin Kupfer University of Applied Sciences Braunschweig / Wolfenbüttel Germany Embedded World 2009, Nürnberg, 03.03.09
ICE/FIRE Analyzer Programming Dialog
 ICE/FIRE Analyzer Programming Dialog TRACE32 Online Help TRACE32 Directory TRACE32 Index TRACE32 Documents... FIRE In-Circuit Emulator... ICE Analyzer System... FIRE Analyzer Programming... ICE/FIRE Analyzer
Performance Tools for Technical Computing
 Christian Terboven terboven@rz.rwth-aachen.de Center for Computing and Communication RWTH Aachen University Intel Software Conference 2010 April 13th, Barcelona, Spain Agenda o Motivation and Methodology
Debugging in AVR32 Studio
 Embedded Systems for Mechatronics 1, MF2042 Tutorial Debugging in AVR32 Studio version 2011 10 04 Debugging in AVR32 Studio Debugging is a very powerful tool if you want to have a deeper look into your
DOMAIN TECHNOLOGIES INC. Users Guide Version 2.0 SB-USB2. Emulator
 INC. Users Guide Version 2.0 SB-USB2 Emulator Table of Contents 1 INTRODUCTION... 3 1.1 Features... 3 1.2 Package Contents... 4 1.3 Related Components... 4 2 INSTALLATION... 4 3 INTEGRATION WITH LSI LOGIC
POD 51EH C541U 12 EA ALE PSEN XH0 XH1 XH2 XH3 XH4 XH5 XH6 XH7 XL7 XL6 XL5 XL4 XL3 XL2 XL1 XL0. Figure 1. POD 51EH C541U 12
 6 7.. P P POD 5EH C54U RST R PWD Y IDL Y EML G MON Y MERR R JP JP T JP7 ANB FLF EMUL XH0 XH XH XH XH4 XH5 XH6 XH7 EA ALE PSEN T XS MCU XS T 7 6 5 4 0 D P P P D M JP0 XL7 XL6 XL5 XL4 XL XL XL XL0 FULL USL
Software Design Challenges for heterogenic SOC's
 Software Design Challenges for heterogenic SOC's René Janssen, Product manager Logic Technology 1 Agenda 1. Advantages of heterogenous devices 2. How to manage inter-processor communication 3. Example
Lesson 2: Using the Performance Console
 Lesson 2 Lesson 2: Using the Performance Console Using the Performance Console 19-13 Windows XP Professional provides two tools for monitoring resource usage: the System Monitor snap-in and the Performance
picojava I Java Processor Core DATA SHEET DESCRIPTION
 picojava I DATA SHEET DESCRIPTION picojava I is a uniquely designed processor core which natively executes Java bytecodes as defined by the Java Virtual Machine (JVM). Most processors require the JVM to
TI TMS320C6000 DSP Online Seminar
 TI TMS320C6000 DSP Online Seminar Agenda Introduce to C6000 DSP Family C6000 CPU Architecture Peripheral Overview Development Tools express DSP Q & A Agenda Introduce to C6000 DSP Family C6000 CPU Architecture
Simplifying the Development and Debug of 8572-Based SMP Embedded Systems. Wind River Workbench Development Tools
 Simplifying the Development and Debug of 8572-Based SMP Embedded Systems Wind River Workbench Development Tools Agenda Introducing multicore systems Debugging challenges of multicore systems Development
TRACE32 Getting Started... ICD In-Circuit Debugger Getting Started... ICD Introduction... 1
 ICD Introduction TRACE32 Online Help TRACE32 Directory TRACE32 Index TRACE32 Getting Started... ICD In-Circuit Debugger Getting Started... ICD Introduction... 1 Introduction... 2 What is an In-Circuit
ARM Cortex-M and RTOSs Are Meant for Each Other
 ARM Cortex-M and RTOSs Are Meant for Each Other FEBRUARY 2018 JEAN J. LABROSSE Introduction Author µc/os series of software and books Numerous articles and blogs Lecturer Conferences Training Entrepreneur
Input/Output Systems
 Input/Output Systems CSCI 315 Operating Systems Design Department of Computer Science Notice: The slides for this lecture have been largely based on those from an earlier edition of the course text Operating
MPLAB SIM. MPLAB IDE Software Simulation Engine Microchip Technology Incorporated MPLAB SIM Software Simulation Engine
 MPLAB SIM MPLAB IDE Software Simulation Engine 2004 Microchip Technology Incorporated MPLAB SIM Software Simulation Engine Slide 1 Welcome to this web seminar on MPLAB SIM, the software simulator that
TMS320C674x/OMAP-L1x Processor General-Purpose Input/Output (GPIO) User's Guide
 User's Guide") TMS320C674x/OMAP-L1x Processor General-Purpose Input/Output (GPIO) User's Guide Literature Number: SPRUFL8B June 2010 2 Preface... 7 1 Introduction... 9 1.1 Purpose of the Peripheral... 9 1.2 Features...
TMS320C674x/OMAP-L1x Processor General-Purpose Input/Output (GPIO) User's Guide Literature Number: SPRUFL8B June 2010 2 Preface... 7 1 Introduction... 9 1.1 Purpose of the Peripheral... 9 1.2 Features...
_ V1.1. Motorola 6809 B POD rev. C. POD Hardware Reference
 _ V1.1 POD Hardware Reference Motorola 6809 B POD rev. C Ordering code IC81060 Thank you for purchasing this product from isystem. This product has been carefully crafted to satisfy your needs. Should
RTOS Debugger for ThreadX
 RTOS Debugger for ThreadX TRACE32 Online Help TRACE32 Directory TRACE32 Index TRACE32 Documents... RTOS Debuggers... RTOS Debugger for ThreadX... 1 Overview... 3 Brief Overview of Documents for New Users...
Introduction. This tutorial introduces the following SingleStep features:
 Introduction This tutorial introduces the following SingleStep features: Starting a debug session. Watching variables. Setting breakpoints. Modifying breakpoints. Stepping through a program. Changing variables
The World Leader in High Performance Signal Processing Solutions. Development Tools.
 The World Leader in High Performance Signal Processing Solutions Development Tools 2004 China.dsp@analog.com What is CROSSCORE? Analog Devices DSP Development Tools CROSSCORE Components VisualDSP++ Emulators
Distributed Debugging API for ORBs and Services. Request for Proposal, test/ Dale Parson, Distinguished Member of Technical Staff
 Lucent CORBA Seminar 1999 Distributed Debugging API for ORBs and Services Request for Proposal, test/99-08-02 September 28, 1999 Dale Parson, Distinguished Member of Technical Staff Bell Labs, Microelectronics
Employing Multi-FPGA Debug Techniques
 Employing Multi-FPGA Debug Techniques White Paper Traditional FPGA Debugging Methods Debugging in FPGAs has been difficult since day one. Unlike simulation where designers can see any signal at any time,
All information, including contact information, is available on our web site Feel free also to explore our alternative products.
 _ V1.1 POD Hardware Reference Intel 80186 EA POD POD rev. D Ordering code IC20011-1 Thank you for purchasing this product from isystem. This product has been carefully crafted to satisfy your needs. Should
BASICS OF THE RENESAS SYNERGY PLATFORM
 BASICS OF THE RENESAS SYNERGY PLATFORM TM Richard Oed 2018.11 02 CHAPTER 11 EVENT ANALYSIS WITH TRACEX CONTENTS 11 EVENT ANALYSIS WITH TRACEX 03 11.1 An Introduction to TraceX 03 11.2 Built-in Views and
Efficient and Large Scale Program Flow Tracing in Linux. Alexander Shishkin, Intel
 Efficient and Large Scale Program Flow Tracing in Linux Alexander Shishkin, Intel 16.09.2013 Overview Program flow tracing - What is it? - What is it good for? Intel Processor Trace - Features / capabilities
RTE-V850E/GP1-IE USER'S MANUAL (REV.1.01) RealTimeEvaluator
 RealTimeEvaluator") RTE-V850E/GP1-IE USER'S MANUAL (REV.1.01) RealTimeEvaluator REVISION HISTORY Rev. 1.00 June 20, 2002 Rev. 1.01 November 15, 2002 First edition Revising following chapters * "Measured value of execution
RTE-V850E/GP1-IE USER'S MANUAL (REV.1.01) RealTimeEvaluator REVISION HISTORY Rev. 1.00 June 20, 2002 Rev. 1.01 November 15, 2002 First edition Revising following chapters * "Measured value of execution
FPGA Adaptive Software Debug and Performance Analysis
 white paper Intel Adaptive Software Debug and Performance Analysis Authors Javier Orensanz Director of Product Management, System Design Division ARM Stefano Zammattio Product Manager Intel Corporation
Addressing the Increasing Challenges of Debugging on Accelerated HPC Systems. Ed Hinkel Senior Sales Engineer
 Addressing the Increasing Challenges of Debugging on Accelerated HPC Systems Ed Hinkel Senior Sales Engineer Agenda Overview - Rogue Wave & TotalView GPU Debugging with TotalView Nvdia CUDA Intel Phi 2
DoCD IP Core. DCD on Chip Debug System v. 6.02
 2018 DoCD IP Core DCD on Chip Debug System v. 6.02 C O M P A N Y O V E R V I E W Digital Core Design is a leading IP Core provider and a System-on-Chip design house. The company was founded in 1999 and
University of Massachusetts Amherst Computer Systems Lab 1 (ECE 354) LAB 1 Reference Manual
 LAB 1 Reference Manual") University of Massachusetts Amherst Computer Systems Lab 1 (ECE 354) LAB 1 Reference Manual Lab 1: Using NIOS II processor for code execution on FPGA Objectives: 1. Understand the typical design flow in
University of Massachusetts Amherst Computer Systems Lab 1 (ECE 354) LAB 1 Reference Manual Lab 1: Using NIOS II processor for code execution on FPGA Objectives: 1. Understand the typical design flow in
Lab 4- Introduction to C-based Embedded Design Using Code Composer Studio, and the TI 6713 DSK
 DSP Programming Lab 4 for TI 6713 DSP Eval Board Lab 4- Introduction to C-based Embedded Design Using Code Composer Studio, and the TI 6713 DSK This lab takes a detour from model based design in order
Differences Between the EOnCE and OnCE Ports
 Freescale Semiconductor Application Note AN2073 Rev. 1, 1/2005 Differences Between the EOnCE and OnCE Ports By Barbara Johnson In the DSP56300 core, the on-chip emulation (OnCE TM ) port enables programmers
XDS560v2 LC Traveler JTAG Emulator Technical Reference
 XDS560v2 LC Traveler JTAG Emulator Technical Reference 2011 DSP Development Systems XDS560v2 LC Traveler JTAG Emulator Technical Reference 515325-0001 Rev. A December 2011 SPECTRUM DIGITAL, INC. 12502
TRACE32. Product Overview
 TRACE32 Product Overview Preprocessor Product Portfolio Lauterbach is the world s leading manufacturer of complete, modular microprocessor development tools with 35 years experience in the field of embedded
Optimizing Emulator Utilization by Russ Klein, Program Director, Mentor Graphics
 Optimizing Emulator Utilization by Russ Klein, Program Director, Mentor Graphics INTRODUCTION Emulators, like Mentor Graphics Veloce, are able to run designs in RTL orders of magnitude faster than logic
Development Tools. 8-Bit Development Tools. Development Tools. AVR Development Tools
 Development Tools AVR Development Tools This section describes some of the development tools that are available for the 8-bit AVR family. Atmel AVR Assembler Atmel AVR Simulator IAR ANSI C-Compiler, Assembler,
Application Report. Chuck Brokish Senior Member, Technical Staff... Field Design and Applications ABSTRACT
 Application Report SPRA439C October 2005 Emulation Fundamentals for TI's DSP Solutions Chuck Brokish Senior Member, Technical Staff... Field Design and Applications ABSTRACT In software development, perhaps
CodeWarrior Development Studio for QorIQ LS series - ARM V8 ISA, Tracing and Analysis User Guide
 NXP Semiconductors Document Number: CWARMv8TAUG Reference Manual Rev. 11.2.2, 10/2016 CodeWarrior Development Studio for QorIQ LS series - ARM V8 ISA, Tracing and Analysis User Guide Introduction About
Embedded Systems Programming
 Embedded Systems Programming ES Development Environment (Module 3) Yann-Hang Lee Arizona State University yhlee@asu.edu (480) 727-7507 Summer 2014 Embedded System Development Need a real-time (embedded)
Freescale S12X Family In-Circuit Emulation
 _ Technical Notes V9.9.86 Freescale S12X Family In-Circuit Emulation Contents Contents... 1 1 Introduction... 2 1.1 Differences from a standard environment... 2 1.2 Common Guidelines... 2 1.3 Port Replacement
_ V Intel 8085 Family In-Circuit Emulation. Contents. Technical Notes
 _ V9.12. 225 Technical Notes Intel 8085 Family In-Circuit Emulation This document is intended to be used together with the CPU reference manual provided by the silicon vendor. This document assumes knowledge
Performance Profiling
 Performance Profiling Minsoo Ryu Real-Time Computing and Communications Lab. Hanyang University msryu@hanyang.ac.kr Outline History Understanding Profiling Understanding Performance Understanding Performance
F28335 ControlCard Lab1
 F28335 ControlCard Lab1 Toggle LED LD2 (GPIO31) and LD3 (GPIO34) 1. Project Dependencies The project expects the following support files: Support files of controlsuite installed in: C:\TI\controlSUITE\device_support\f2833x\v132
RM4 - Cortex-M7 implementation
 Formation Cortex-M7 implementation: This course covers the Cortex-M7 V7E-M compliant CPU - Processeurs ARM: ARM Cores RM4 - Cortex-M7 implementation This course covers the Cortex-M7 V7E-M compliant CPU
On-Chip Debugging of Multicore Systems
 Nov 1, 2008 On-Chip Debugging of Multicore Systems PN115 Jeffrey Ho AP Technical Marketing, Networking Systems Division of Freescale Semiconductor, Inc. All other product or service names are the property
RTOS Debugger for RTX-ARM
 RTOS Debugger for RTX-ARM TRACE32 Online Help TRACE32 Directory TRACE32 Index TRACE32 Documents... RTOS Debuggers... RTOS Debugger for RTX-ARM... 1 Overview... 2 Brief Overview of Documents for New Users...
As CCS starts up, a splash screen similar to one shown below will appear.
 APPENDIX A. CODE COMPOSER STUDIO (CCS) v5.1: A BRIEF TUTORIAL FOR THE OMAP-L138 A.1 Introduction Code Composer Studio (CCS) is Texas Instruments integrated development environment (IDE) for developing
ΕΛΠ 605: Προχωρηµένη Αρχιτεκτονική Υπολογιστών. Εργαστήριο Αρ. 4. Linux Monitoring Utilities (perf,top,mpstat ps, free) and gdb dissasembler, gnuplot
 and gdb dissasembler, gnuplot") ΕΛΠ 605: Προχωρηµένη Αρχιτεκτονική Υπολογιστών Εργαστήριο Αρ. 4 Linux Monitoring Utilities (perf,top,mpstat ps, free) and gdb dissasembler, gnuplot Lecturer: Zacharias Hadjilambrou Σελ. 1 Realtime monitoring
ΕΛΠ 605: Προχωρηµένη Αρχιτεκτονική Υπολογιστών Εργαστήριο Αρ. 4 Linux Monitoring Utilities (perf,top,mpstat ps, free) and gdb dissasembler, gnuplot Lecturer: Zacharias Hadjilambrou Σελ. 1 Realtime monitoring
Profiling Nios II Systems
 February 2006, ver. 1.2 Application Note 391 Introduction This application note describes a variety of ways to measure the performance of a Nios II system with three tools: the GNU profiler, called nios2-elf-gprof,
Contents. Cortex M On-Chip Emulation. Technical Notes V
 _ Technical Notes V9.12.225 Cortex M On-Chip Emulation Contents Contents 1 1 Introduction 2 2 Access Breakpoints 3 3 Trace 5 4 NXP LPC 5 4.1 Boot and Memory Remapping 5 4.2 LPC17xx Startup 5 4.1 LPC11A02/04
SMP/BIOS Overview. Nov 18, 2014
 SMP/BIOS Overview Nov 18, 2014!!! SMP/BIOS is currently supported only on Cortex-M3/M4 (Ducati/Benelli) subsystems and Cortex-A15 (Vayu/K2/Omap5) subsystems!!! Agenda SMP/BIOS Overview What is SMP/BIOS?
Stanislav Bratanov; Roman Belenov; Ludmila Pakhomova 4/27/2015
 Stanislav Bratanov; Roman Belenov; Ludmila Pakhomova 4/27/2015 What is Intel Processor Trace? Intel Processor Trace (Intel PT) provides hardware a means to trace branching, transaction, and timing information
A design of real-time image processing platform based on TMS320C6678
 Advanced Materials Research Online: 2014-06-25 ISSN: 1662-8985, Vols. 971-973, pp 1454-1458 doi:10.4028/www.scientific.net/amr.971-973.1454 2014 Trans Tech Publications, Switzerland A design of real-time
Lab 1. OMAP5912 Starter Kit (OSK5912)
") Lab 1. OMAP5912 Starter Kit (OSK5912) Developing DSP Applications 1. Overview In addition to having an ARM926EJ-S core, the OMAP5912 processor has a C55x DSP core. The DSP core can be used by the ARM to
Lab 1. OMAP5912 Starter Kit (OSK5912) Developing DSP Applications 1. Overview In addition to having an ARM926EJ-S core, the OMAP5912 processor has a C55x DSP core. The DSP core can be used by the ARM to
SMP/BIOS Overview. March 19, 2015
 SMP/BIOS Overview March 19, 2015!!! SMP/BIOS is currently supported only on Cortex-M3/M4 (Ducati/Benelli) subsystems and Cortex-A15 (DRA7xx/K2/Omap5) subsystems!!! Agenda SMP/BIOS Overview What is SMP/BIOS?
Code Composer TM. Quick Start Guide
 Code Composer TM Quick Start Guide Before You Begin Check for old versions of Code Composer (CC) on your system Uninstall all old CC applications Delete old path statements and environment variables in
Application Note for EVP
 Sundance Multiprocessor Technology Limited Application Note Form : QCF32 Date : 11 Februay 2009 Unit / Module Description: SMT111-SMT372T-SMT946 Unit / Module Number: Document Issue Number: 1.0 Issue Date:
XMC4800 EtherCAT APP SSC Firmware Update Slave Example. Getting Started Version 3.0
 XMC4800 EtherCAT APP SSC Firmware Update Slave Example Getting Started Version 3.0 1 2 3 4 5 6 7 Overview and requirements Setup Short overview boot modes Architecture Implementation of the application
Computer Organization: A Programmer's Perspective
 Profiling Oren Kapah orenkapah.ac@gmail.com Profiling: Performance Analysis Performance Analysis ( Profiling ) Understanding the run-time behavior of programs What parts are executed, when, for how long