10. The Barcodes and dynamic images example explained The chart example explained The running totals example explained
|
|
|
- Mitchell Gardner
- 6 years ago
- Views:
Transcription
1 J4L FO Designer 2.1
2 Table of contents 1. Introduction...4 Requirements...4 Setup & startup...5 Delivered files The user interface...9 The properties view...10 XML Schema folder...12 The XML test files folder...13 The editor view...15 The toolbox bar...18 Working with the database...19 Versioning system...22 SVN plugin...24 The XPath editor...27 The help system Working with the user interface...30 Creating, deleting, importing and exporting...30 Operations on files...34 Selecting objects...35 Operation on objects...35 Operations on areas...36 The preferences dialog Structure of the template...39 Page masters...39 Areas...42 Background colors and images...48 The background area...49 Columns and rows markers...50 Drawing lines with columns and rows markers...53 Properties of the objects...53 Properties of the template...53 Properties of the areas...53 Properties of a text field...54 Properties of a combo box...55 Properties of a picture...55 Properties of a line...56 Properties of a www links...56 Properties of a free code objects Executing the template to create PDF files...60 FOP web server (servlet)...60 Java objects to PDF conversion...62 Sending the PDF as an attachment...63 Adding a digital signature to the PDF file Learn by doing: tutorial...66 The examples in the database...66 Hands on example The invoice IDOC example explained...74 how to work without a schema file...76 Use of second level detail areas...77 Use of conditions in the XPath...78 Use of combo boxes "Group by" example...80 Group footers The two columns example...83
3 10. The Barcodes and dynamic images example explained The chart example explained The running totals example explained PDF interactive forms...94 Introduction...94 Form objects...94 Text field...95 Combo box...95 Checkbox...95 Button...96 Filling in the form...96 Form submission...98 Input form example Flavours Advanced functionalities Understanding the generated code for areas Introduction to Variables and Keys Adding your own code Advanced examples FAQS How to prevent NaN values in numeric fields How to enable the designer console How to debug Oracle APEX requests How to enable Oracle APEX logging on Glassfish How to create a user defined xpath function How to add new fonts to J4L FO Designer How to add new fonts to Oracle ORDS How does the designer deal with namespaces How does support for international character sets work How to add my own xslfo attributes to the fields How to add page numbers and page total count Troubleshooting Permission error while creating a PDF or saving a report Third party licenses Contact...124
4 1. Introduction The J4L FO Designer is a graphical tool for designing XSL-FO documents. XSL-FO is a language for formatting XML data and one of the most popular uses is for converting "technical" XML files to user friendly PDF files. This tool uses the Apache FOP package for executing the XSL-FO documents and therefore it is specially suitable for Java environments. The FO Designer will help you in the task of creating PDF files from XML files. There is no need for you to learn the XSL-FO language. Even if you are familiar with the XSL-FO language, the designer provides you with a user friendly graphical tool for increased productivity Furthermore the designer provides an integrated environment for: Designing the PDF files in a WYSIWYG manner. Loading and modifying XML files for the testing. Running tests and checking the output with one click. When working with the designer you will be handling up to 6 different files: 1. The input XML file (also called XML document in this guide) which needs to be converted to PDF 2. The XML schema file, with extension *.xsd (optional) which defines the structure of the XML document. In the schema file you have a list of all possible elements contained in the input XML document. So, from the schema you can select fields to be placed on the PDF file. 3. The XRE file (also called document template or report in this guide) which stores the layout of the desired output, this is what you see in the designer and is used at design time only. 4. The XSL-FO document. The XSL-FO output is generated by the designer and used at runtime by Apache FOP to convert your XML file to PDF. 5. The FO output ( FO tab) which is the result of applying the text XML file to the XSLFO document.. 6. The output PDF file. Requirements FO Designer requires: Java 1.6 or later (included) Adobe reader to view the generated PDF files Apache FOP (included in the delivery). See also third party licenses section. J4L FOP Server ( or J4L WAR file deployed on your web server IF you use any of these proprietary extensions: 1. charts 2. barcodes 3. generate interactive PDF forms 4. use digital signature 5. J4L XSL functions in the Xpaths

5 Setup & startup Installation Unzip the downloaded ZIP file in a empty directory. Start up Start the file fodesigner.exe, the welcome page will be displayed. After start the following directories will be created: UserHomeDirectory/FO/db : the database that will be copied from the installation directory/db. UserHomeDirectory/FO/Workspace: this is the working directory where all the projects and files will be stored.


6 Click on the Start working icon to open the workbench: Creating the first report: Use the File New menu item Select FO Report Project


7 Enter a report name: and finish:
8 the created project will consist of the report file (xre) and 2 folders: the Schemas folder where you can load the XML schema and the XML test files where you can copy files for testing your report. Files can be copied from windows explorer into the project using copy and paste. Note the project name and the template file (xre) which always have the same name. Delivered files The delivery includes the following files and directories: db: database directory. Examples included in the database: several examples including schema, xml files and template for the designer employees: example for the tutorial section in this guide, including grouping and cover page example. apex: a simple Oracle APEX example apex_order: a purchase order document based on Oracle APEX idoc_invoice: SAP IDOC invoice example, explained later in this directory. o xcbl_order: reference example for this guide. chart: example report with charts. form: interactive form barcodes: example report with barcodes. JavaClass_to_PDF: shows how to convert java classes to PDF certs: certificate files for testing the digital signature web: file for deployment to web server as servlet
 is the Project explorer where the reports and the test files are located View 2 (left-bottom)")
 is located the report editor. Next to it (4) is the tools palette.")
9 2. The user interface The main window of the designer is divided in 3 areas: 1. On the left side there are 2 views: View 1 (left-top) is the Project explorer where the reports and the test files are located View 2 (left-bottom) is the object outline of the currently open report. The outline provides an overview of the structure and content of the report. 2. On the middle view (3) is located the report editor. Next to it (4) is the tools palette. Note if the palette is not visible you need to click on this icon: 3. On the right view (4) the properties of the selected object will be displayed.

10 The properties view The properties view on the right side of the window will display the properties of the selected object grouped by section. The selected object can be: the report the master the area the report fields Areas and fields can be selected in the editor. For example you select an area by selecting the ruler (blue or grey header) or the (white) area background. You can also select the area in the outline view. you select an object and view the properties by click on the field:

11 Report and master properties can only be displayed by selecting them in the Outline view.

12 XML Schema folder In the schema folder of the project you can load the schema for the report. In the XML schema you have a tree structure which contains all possible elements of the input XML document.the schema file will be needed for the XPATH editor. You need to load the schema into the folder by using the Settings tab of the editor and the load schema button.


13 The XML test files folder This folder contains the XML file that can be used for testing the report there can be one or several file in the folder. You can add files in windows by using copy and paste from windows explorer. In order to use a file for testing the report you need to select the file in the report editor, setting tab.

14 Loaded files can be edited by double clicking on them: Note however, the designer will not check the validity of the XML nodes you create or import, that is, you can create nodes that are not part of the schema or you can create them in the wrong sequence or position.

15 The editor view By double clicking on the xre file in the project you open the report editor: 1. The ruler region. Click on this to display the properties of the area in the properties view. The ruler contains the name of the area and the XML node element that has been assigned to the area: 2. The work panel itself. In this panel you place the fields and other objects of the template. In order to add an object you select one of the tools from the palette and drag it the position of the work area where you want to add the object.
.")

16 4. To resize an area (the height of it) you can click on the area background and move the area anchors up and down. 5. The editor has 3 additions tabs the XSLT Code: will display the generated xsl code. This is the code that will be exported. the FO code: will display the generated FO (code). That is the result of applying the XML test file to the XSLT code. Here you can see the code with the test data instead of Xpaths expressions. The settings tab is used to select the schema file and the active test file. Both the XSLT code and the FO Code will always hightight the currently selected object so you can check the generated code. In the example below the object ProductName has been selected. Selected code:

17 6. the tools palette next to the editor contains all the objects that can be placed in the report these are: Column marker Row marker text field. Drag this field to the area in order to create a new output text field. combobox object. Select this tool to add a combobox. A combobox is a list of pairs key/value. The value in the input XML document will be used as key to find the value in the list. The value will be output in the PDF document. image object. Select this tool to add an image to the template. line object. Select this tool to add an horizontal line. barcode object. Select this tool to add a 1D or 2D barcode. Note the designer includes the evaluation version of the barcoding components. This component requires the suite or enterprise license. chart object. Select this tool to add a chart to the report. Note the designer includes the evaluation version of the charting component. This component requires the suite or enterprise license. Link object. Use this object to add www links to your report. The value field can be a constant value or a XPath expression, it represents the www link. The "Link label" field will be the displayed value in the report, if empty the http link will be used. As example tasks.xre. Free code object. Use this object to place you own XSL-FO in the output of the report. Check box for input forms
18 action button for input forms The toolbox bar The actions available in the tool bar are: Create new report project Save report Undo and redo actions Delete, cut, copy and paste report objects Open database Database user administration (enterprise license only) Open report from database Open previous version of report from the database this button generates the XSL-FO output for the document. This output can then be used in your runtime environment, using Apache FOP. Note this button might be disabled in the evaluation version. save template to database (overwrite current version). save template to database and create new version this button generates a PDF file using the current template. This button requires that you have loaded a test XML document in the test data panel. After generating the PDF document you have the option to open it manually or let the designer open the PDF document for you this button generates a PDF file using the current template. This button requires that you have loaded a test XML document in the setting tab. After generating the PDF document it will be opened using the system s default reader. Generate the PDF file using a remote FOP server (J4L FOP Server or APEX Listener/Rest Data Services). See preferences window. Zoom editor work area Toogle report s grid

19 Working with the database You can work with the project on the file system however you can also use the database. If you are working in a enterprise environment it can be useful using a central database. By default FO Designer will use the local database (db subdirectory of the installation) however for team work you would probably use a central database (installed as part of the J4L FO Server). This can be setup it the Windows preferences dialog. A central database can be set in the enterprise version (license) only. use the button for connecting to the database, the default user and password for the local installation are admin/admin


20 Once connected to the database you will be able save your projects: The xre file will be saved in the database together with the currently selected schema (in the report`s settings page) XML test files must be saved separately using the context menu: Note files saved to the database have the database icon, the update of the icon is however not immediate :


21 The button should be used to retrieve projects in the database, the following screenshot shows the open report dialog: Finally the user administration button can be used in a team work environment

22 Versioning system The designer can keep track of the different versions of your templates by using a versioning system. Furthermore it keeps track of the modification date and the user that made the changes. You use this button to save your current template to the database and overwrite the current version. You use this other button to save the template to database creating a new version. Whenever you want to open a template, the system always proposes the last version. As in this example it proposes version 2 for the EmployeesGroupFooter template.

23 You can however open an previous version of the currently open template using the button. In the example below you would be opening version 1
 which is a generic tool for code management.")

24 SVN plugin A more powerful alternative to our central database is using Apache Subversion ( which is a generic tool for code management. If your enterprise is already using subversion, this section will show how to install the plugin for the FO Designer. 1. Download the file site zip from 2. Select Help Install new software 3. Select Add and create a new repository. The location should be the downloaded zip file (use the archive button)


25 4. Make sure you select these items: 5. Click next, accept the license and finish 6. Accept also the security warning


26 7. After restart there will be a new item in the windows menu: 8. In the SVN setup perspective the link to the central repository can be added (Contact your system administrator for details). Once added all SVN functionalities will be available. Some tutorials and videos are available under


27 The XPath editor The xpath editor is used for selecting XML nodes in several object properties in the designer. The XPath editor does not only allow the selection of an XML element but it also lists a set of functions that can be applied to the XML elements. When you use a schema file for the firs time, the system will ask you to select the root element are below: The Editor has 3 parts: 1. on the top you can select the XML node, double click on it to select it and add it to the output. 2. In the middle of the window you can select one of the available functions. The function will be added to the output only if you click the Insert button. Note: Most functions are standard XSL-FO and Apache FOP functions, other however are specific to the J4L Designer, those are the ones with the prefix j4lext. If you use any of these j4lext functions you must also use our runtime module to create the PDF files. It is also possible to create your own functions, see FAQ section. 3. At the bottom the output Xpath will be displayed.

28 When you select an XML node or you insert a function, there are 3 possible situations: 1. If the output is empty, the node or function will be added to the output field. 2. If the output is not empty but there is at least one <param> string in the output, the left most <param> will be replaced with the selected node or function. 3. If no <param> value exists, the editor will ask you if you want to overwrite the content of the output field.

 Product version and")
29 The help system The Help menu can be used for displaying the products documentation (Help Contents) or product version (About FO Designer item) Product version and license:


30 3. Working with the user interface This section highlights some common operations performed while developing a template: Creating, deleting, importing and exporting In the File menu you can find all the operations to be performed on projects, these are: 1. Create a new project. Use the New.. item. Select new FO Report Project and follow the steps in the wizard.


31 Enter a project name and press finish 2. Deleting a project: press DEL on the project folder, make sure you select the Delete project contents on disk checkbox 3. Importing a report. Use this to import single report files. A new project will be created using the file name.
. Select export and File system.")
32 4. Import a legacy report. These are.xrp files used in FO Designer 1.*. Same as above but using legacy files instead. 5. Save reports to the file system 6. Export and import complete projects (including XML and schema files). Select export and File system. If you select Archive File the project will be exported to a zip file.

33 Last, select the objects to be exported and press finish:
34 Operations on files You may use the context menu to delete, copy or rename files or whole projects however make sure that: If you copy a whole project make sure you rename the xre to the same name as the project name. Basically make sure the xre file has always the same name as the project. You many have only one xre file per project. If you need to copy the xre file, copy the whole project instead.

35 Selecting objects Objects in the areas can be selected in 3 ways: Single object selection: clicking on the object (the properties of the object will be shown automatically Multiple object selection: click on several objects while holding the SHIFT key pressed. The selected object can then be resized or moved all together using the mouse. Operation on objects There are other operations you can perform on the selected object by using the context menu (mouse s right click) The operations are not explained here in detail since they are self-explanatory and quite standard in many windows programs. Additionally to the operations listed the following operations can be performed by using the keyboard: copy: control key + C cut: control key + X paste: control key + V delete: <del> key
.")
36 Operations on areas The areas item in the main menu allows the following operations: Both operations work using the Outline view. Inserting an first level area: select the master on the outline view. The new area will be added as first level area. Inserting an area below an existing area: select the parent area in the outline, for example Detail the new area will be added below (as a subarea). In this example Detail area 3 has been added below Detail

37 The preferences dialog In the windows menu there are 3 items (4 if you install the SVN plugin): the reset perspective will replace all the view in the original position. This is useful if you have closed or moved some views by mistake and want to return to the original window layout. The Designer perspective will open the editor in case the Welcome or SVN setup perspectives are open. Preferences: in this dialog the settings described below are available
38 The settings are: Properties windows on left side: this is useful if you are working with small screens (laptop). In this case the properties of the object will be shown on the same position as the project explorer (as a new tab), saving therefore display space. Align to grid: align always new or moved object to the grid Grid: normal or fine XML namespace processing setup. Remove namespaces from XML test file before generting the PDF Oracle APEX encoding setup: select this option if you are working with Oracle APEX. Do not use however this option for the Oracle APEX Listener (ORDS) as print server. Activate digital signature. See section below. DE Server and DB Server port: this setup is required when working in teams and there is a central J4L FOP Server together with a central database. Printer server type: setup for remote PDF generation. Select one of the supported servers. Printer server URL: use for Oracle Apex ORDS 5.*: or for J4L FOP Server user: Note: for Apex ORDS to work you need to navigate to the /apex or /ords directory, locate the defaults.xml file and add the following code: <entry key="misc.enableoldfop">true</entry>
39 4. Structure of the template This section contains very valuable information to understand how the XML to PDF conversion takes place. First of all we will describe when and how areas are generated, then we will explain how the layout of the fields in the areas occur and last we will explain the meaning of the properties of each object involved in the template. Page masters In most cases your templates will have only one page master, that is, all pages look the same, they just contain different data. A page master describes the layout of a type of page and the areas it contains, including page header and page footer. What to do however if you want to have no page header and no page footer in the first page? in that case the first page would be using a different page master. This is for example the case when you want to have a cover page followed by the regular pages.


40 The example located in departmentempcoverpage.xre contains such a template. Each template can have up to 5 page masters that can be selected from the Outline view. Note the page master 1 must always be active but master 2 to 5 must be explicitly be activated, see "Master active" property in the screenshot below. In this example the first master contains just the title of the report as a cover page, while the master 2 contains the layout of the pages that contains the employee data.
41 Note the XML schema and test data are common to all page masters. All page masters share the same source data (XML data), they just create different pages with different layouts. If you run the provided template and generate the PDF, you will see the output is a PDF file with 3 pages, where the first page is the report cover page.
. The header of the detail area, it contain the labels of the columns in the detail area.")
42 Areas The following screenshot shows a PDF file which can be split in 5 areas: The header of the page (in this case it is empty). The header of the document (in this case the header of a purchase order). The header of the detail area, it contain the labels of the columns in the detail area. The detail area, in this case 2 repetitions (lines) of the detail area. The footer of the document (commonly used for showing totals). Additionally there is a page footer (not shown in this screenshot) which can contain, for example, the page number.

, the dependent (sub)areas will be generated.")
43 In the same way a normal business document contains this kind of areas the template you create in the FO designer contains also the following types of area: One template header and footer. Each PDF file will normally contain only one document header and one document footer, however it is possible to have several headers in one PDF file, for example if you are printing several invoices in one PDF file. One page header and footer. These areas are printer in each page. detail areas (optional). Area can have subareas. Each time an area is generated (added to the PDF file), the dependent (sub)areas will be generated. The template Header is the first area generated, afterwards all first level areas (those that are right below the master in the outline view) the XML node property specifies when the area must be generated. The XML node property contains an XPath expression which points to an element in the input XML file. The area will be generated if the element exists in the XML file, if several elements exist, several repetitions of the areas will be generated. If the XML Node property is left empty, the area will be generated only once. Detail areas may have a detail area header (as in area number 3 in the screenshot above), this header area however can be removed from the PDF output (see Visible checkbox below) The delivery includes a file called order.xre which is the template used to create the above PDF file. This template uses a XML purchase order (using the xcbl schema) as input file. The following screenshot provides and overview of the schema:

44 The root element is called Order, under this root element there is a OrderHeader element, a OrderDetail element and a OrderSummary element. In the following screenshot you see an overview of the template file. It contains the 6 areas we mentioned above: The document header (contains the purchase order header) and footer (contains the total values) The page header (is empty) and footer (contains the page number) The detail area (for the articles) and the columns header of the detail area.

. In this case the Detail area.")
45 When the template is executed: 1. The page header and footer will be added to each page 2. The Header area will be generated. If the XML node property is empty, the area will be generated only once, if it contains a XPath expression as in this case, it will be generated as often as elements are return by the XPath expression. In the example the header will be created once for each /Order element in the input XML file. 3. For each instance of the header, the dependent areas will be generated. These will be all first level areas (the ones right below the master in the outline view). In this case the Detail area. so we know the detail area will be generated after the header area, but how often? this on the XML node property (see arrow 1 in the screenshot). In this example we will create one repetition (line of the detail area) for each ItemDetail node in the input XML file. In other words, we will create one detail line for each item in the purchase order.


46 Last, as you see in the Visible property in the Detail Columns header this header which will be generated before the detail area and contain the labels of the columns. In this example each XML input file can contain only 1 purchase order, however let's suppose it does contain two /Order elements. In this case we would get two instances of the header area and of course we want the items belonging to the first order to be selected when the first header has been generated and the items belonging to the second order to be selected after the second header has been generated. That is why the XML node type property of the detail area has been set to relative. That means, select only the ItemDetail elements which belong to the /Order element being generated. If you for example set that value to absolute, you would be selecting all items in the XML file, not only those belonging to the current order. The same logic applies to the individual fields. Each field has a XPath property and XPath type property:
.")
47 In the screenshot above you can see the value for the description field will be selected from the ItemDescription element which is located somewhere below the ItemDetail element (which is the XML Node of the area). Since we want to select the item description of the current ItemDetail node, we set the XPath type to relative.

48 Background colors and images Areas can have background color or background images, the available options are: 1. Set the opaque property to Yes and select a background color 2. or set the opaque property to No and set a background image. The background image can be align horizontally and vertically by using the Background align properties. Select the image in the local system (back image field), for later execution on the server, fill in the Image dir. server. You can use the show b. Image flag for showing the image in the designer, if you remove this flag the image will still be created in the output but not shown in the designer

49 The background area The background area contains objects that will be placed on each page at a fixed location. The background area is located as last area in the Master object in the outline view: as with header areas you can remove the area from the output using the visibility flag in the area properties view. If you use the background area, make sure regular areas have the opaque property set to false otherwise they will be overlap the background area. You can see an example of a background area in tasks_background.xre.

 2.")
50 Columns and rows markers FO designer will always internally create a XSL-FO table (similar to a HTML table) and place each field or image in one cell in the table. In most cases this is done automatically however there are some situations where you explicitly have to define the columns and rows of the area as explained below. You use the Row and Column marker object of the palette and place them in the position where you want to have the row and column separation of the generated table The cases where you need to define the columns and rows separator yourself are: 1. if you have an object that expands several rows (for example an image) 2. if you want to paint a frame or line around the column, row or cell ( see the frame properties in the area's properties) 3. in case the automatic layout of fields does not produce the expected output, you may need to define the columns and rows yourself to have a better control how the objects will be aligned.


51 The following example illustrates case 1. The following screenshot shows a purchase order template with an image on the right side the output PDF is: the problem here is the image and the "Purchase order" text are placed on the top which is correct but all other fields and moved further down in the page. If you however define the rows and columns yourself like this:

.")
52 the output will look correct because you tell the designer the area has 2 rows, in the first one you have the "Purchase order" text and the image, furthermore the image occupies both rows. Note the rules for placing the column and row separators are: 1. Objects can span one or more rows, if they span more than 1 row, no other objects must be placed in the cells below it (as in the logo image object above) 2. Objects can span one or more columns. See for example, Name, address and City fields above, they occupy columns 1 and You can have several objects in one cell but they have to be place at different heights (top to bottom placement). Placing several objects in the same cell, from left to right will not produce the desired output. The following example illustrates case 3. If you remove the columns separator between the Number: label and the Number field like this: You have now 2 objects at the same height and the output will be incorrect (see below) because the designer is unable to put 2 object at the same Y position unless there is a column separator: Note: if you do not create any column, the designer will automatically (internally) do it for you, however if you define at least one column separator, the automatic mode will be disabled and in this case you have to place all columns separators (as shown in this last example).

53 Drawing lines with columns and rows markers Columns and row marker can be used for drawing vertical and horizontal lines. By clicking on the marker icon, the properties will be displayed. If the property Border is set to yes, the line will be painted. Properties of the objects Some properties of the object, like the position (X and Y) and size are self-explanatory, therefore they will not be listed here. Properties of the template Select the report object in the outline view to display the properties of the template. Date format: format of the dates in the input XML file. The default one is yyyymmdd"t"hh:mm:ss. This property is important if the template has to reformat the date fields (see format property in the field object). This is the input date format in tthe XML file. Orientation: horizontal for landscape and vertical for Portrait. Size: page size. It can be customor predefined. Margins: define the margins of the page. Name: name of the template, used for information purposes only. Documentation: free text for documentation purposes Properties of the areas Click on the area ruler or on the area in the outline view to display the area s properties: XML Node: if this element is empty, the area will be generated only once. If this area however contains a XPath expression, the area will be generated as many times as elements returned by the XPath.
54 XML Node Type: If absolute the XPath will be evaluated as you see it in the designer. If relative, the XPath will be relative to the current element (XML Node property) in the super area. XML Sort: enter an XPath if you want to sort the elements returned by the XML Node property. The XML Sort property is a XPath that returns a list of elements used as key for sorting. For example, you could set the XML Node to be the items in the purchase order as in our example /Order/OrderDetail/ListOfItemDetail/ItemDetail. The you could sort using the article number /Order/OrderDetail/ListOfItemDetail/ItemDetail/BaseItemDetail/ItemIdentifiers/PartNumber s/b uyerpartnumber/partnum/partid. XML Sort type: whether the sorting elements are numeric of alphanumeric values. XML Sort order: ascending or descending. XML Group by (3 fields): used for grouping values (see additional section of this topic) Local group: select this if the grouping shall not be propagated to the subareas. Set row height: this setting makes sure the area will have the same height as you define in the designer. If you remove this setting the area will shrink when there is no data in it. In some cases if you have conditional fields (using flavours) this can be useful to avoid empty spaces. Background: background color of the area Frame: select a value different from NONE to enable the area's frame. Possible values are: o AREA BORDER: paint only the border of the area o ONLY ROWS: paint only horizontal lines to separate area repetitions and rows within the area. o ONLY COLUMNS: paint only vertical lines to separate columns in the area (see column markers). o GRID: all above will be painted. Frame color: select the color with the color. Frame style: select one of the styles Frame width: select THIN, MEDIUM or THICK. Rows: see Columns and rows section. New page (page break): if true the area will be generated in a new page. Keep together (in detail areas only): if true the area will be printed in the next page when not all fields fit in the current page. Properties of a text field Click on the object to display its properties. constant: set it to true if this is a constant field (ie. a label). Note if a field has been declared as constant (as a label), the border will be black instead of blue, in this way you can easily recognize which fields contain variable data and which field are labels. value: constant value (instead of using a XPath). It will be used if the constant property is set to true or the XPath property is empty. XPath: path to the source XML element of this field. It can be any valid XPath expression, that is, it can contain conditions and functions. The employee tutorial contains an example how to use functions and the invoice IDOC example uses the condition technik extensively. XPath type: If absolute the XPath will be evaluated as you see it in the designer. If relative, the XPath will be relative to the current element (XML Node property) of the area. Align: text alginment
55 Background: select background color of the field. Background opaque: set it to true to activate the background color. Border: set it to true to activate the border of the field Border Color, Style and width: properties of the border. FO attributes: any xsl-fo attributes to add to the field. Note this might lead to errors if you use attributes not compatible with the one generated by the designer. Font: currently only the built-in fonts are supported (SansSerif, Courier, Times Roman and Symbol). Font color: self explanatory. Format: output format for dates and numbers. For numbers the format is: # denotes an optional digit. 0 denotes a digit.. decimal point., is the group separator for thousands. ; Pattern separator. The first pattern will be used for positive numbers and the second for negative numbers. % percentage sign For dates the format is: y: year M: month day of month H: hour (0-23) m: minute s: second further information can be found in the Java documentation of the SimpleDateFormat class. Rotation: use this field to rotate the text Preserve LF: set it to true to keep all spaces in the value.. Properties of a combo box Click on the object to display its properties (see also properties of a text field). Key List: a list or key/value pair. The element returned by the XPath will be used as key to find the value in the list. This value will be the output in the PDF File. Properties of a picture Click on the object to display its properties (see also properties of a text field). Image: path to the image. There are 3 types of images (Constant property): CONSTANT FILE. These are fixed image files which can be loaded into the report. They do not have to be available at runtime. See example "order.xrp" DYNAMIC FILE: these are images which are located on the file system but the name is calculated at runtime using a XPath expression. See example personcard.xrp. We recommend placing images below the working directory. That will be either in the FODesigner directory or in the server, below the J4LFOPServer directory.
56 FROM XML. These are images located inside the source XML file as a base64 image, they are also referenced with an XPath expression. See for example "order_logo.xml" and test file "OrderSample-ABC-Image.xml". Load image in FO file (for constant images): select to load a base64 representation of the image, otherwise the image will be read from the file system at runtime. Local image URL (for constant images): if the the above flag is not selected this will be the location of the image in your computer at design time. Server image URL (for constant images): if the the above flag is not selected this will be the location of the image in the server at runtime. Scale to Fit: scale the image to fit the size of the picture object in the template. Scaling: the default behaviour is to scale the image using "uniform" scaling which makes sure the aspect ratio of the image does not change. Use "non-uniform" if you want to scale the image without aspect ratio considerations. Constant: see Image property. Type: set automatically when the image is loaded. Properties of a line Line Width: width of the line. Style: type of line (dots, dashed...). Line length: (default 100%). You can define the length in % or in cm. Orientation: vertical or horizontal. Properties of a www links Link label: label displayed in the PDF file. If empty, the www address will be shown. Value: www value, either as a constant value or as a XPath expression..

57 Properties of a free code objects The free code objects are required when you need to add code to the xsl-fo output. This should be done only if you are familiar with the xsl-fo language. If the code is not correct the PDF generation will fail. The 2 main properties are: XSL-FO Code: use the editor to add code. Note you have to use the prefix fo: for fo elements and the prefix xsl: for xls elements. Location: of the code. The code can be handled as attributes of the current cell/row/table or as standalone code before the area or inside the current cell. Example 1 This simple code will add the work Hello to the output In the code tab you will see the code has been added to the output

58 And in the preview tab you can see the generated PDF :

: The output shows then")
59 Example 2 This code shows how to store the value of an input field into a variable. The variable will be set before the area is created in this way it can then be used by all sub areas. Select the property location table before We can then place a text field in another area to read and show the variable (note you use the sign $ following by the variable name): The output shows then the variable value:
60 5. Executing the template to create PDF files Once you have generated the XSL-FO file you can use Apache FOP for converting your XML files to PDF. However we provide the following class: com.java4less.xreport.fop.foprocessor which has a very simple interface: /** * generate PDF file for XML document xmlstream input XML document xsltstream XSL-FO file as created by the designer os output PDF file Exception */ public void process(inputstream xmlstream, InputStream xsltstream,outputstream os) throws Exception { for example: FOProcessor processor=new FOProcessor(); processor.process(new FileInputStream("Order.xml"), new FileInputStream("order.fo"), new FileOutputStream("report.pdf")); FOP web server (servlet) The delivery includes a WAR file which can be deployed on a web server. This includes a servlet that operates as follows: 1. It receives a HTTP request using the POST method. o The body of the request contains the XML document to be converted. o or the body contains a FORM and in the form there is a text field that contains the XML data. In this case the parameter DATAFIELD must provide the name of the field (see file Example.html) 2. In the URL of the servlet you provide the name of the XSL-FO file to be used for the conversion, using the TEMPLATE parameter. The template must be the name of the file and it must be placed in the default working directory of the server (it is also possible to provide
61 the file as a relative or absolute file name). As an alternative the file can be located within the war file in the WEB-INF/classes subdirectory or below it. 3. the servlet returns the PDF file The delivery includes the following files that you can use for testing: departmentemployees.fo.included inside the war file (directory WEB-INF/classes). the war file: web/j4lfopserver.war You can test the servlet by deploying the war file and then executing the URL: When you click on the button the following URL will be openned: TEMPLATE=departmentEmployees.fo&ENCODIN G=iso &DATAFIELD=S1 Where the file departmentemployees.fo is inside the war file encoding ISO is the encoding of the input data S1 is the name of the text field that contains the XML data. Note, if the DATAFIELD is missing, the servlet assumes the body of the HTTP request contains the XML payload.
62 Additionally the REMOVENS=YES parameter must be used if your input XML file contains namespace information. Java objects to PDF conversion This section describes how to convert Java objects to PDF. This description is based on the example contained in the JavaClass_to_PDF subdirectory of the delivery. This example simulates a sales Java application which works with purchase order objects. These purchase order objects are composed of 3 classes: com/java4less/examples/po/purchaseorderheader.java com/java4less/examples/po/buyerinformation.java com/java4less/examples/po/purchaseorderitem.java This application needs to provide a mean to print a purchase order document out of a Java purchase order object. As a solution this example proposes using Apache FOP for creating a PDF file which can be printed and using J4L FO Designer for designing the layout of the document. Since FOP requires an XML document as input, the Java objects will be first converted to XML using the JAXB (Java XML Binding) API. Note this means you require Java 1.5 with JAXB or Java 1.6. The steps to be performed are: 1. run JAXB schema tool to generate a XML schema for your Java classes. In our example the file generateschema.bat was used for that and the schema1.xsd file was generated 2. Use FO Designer to generate a document template using the schema. The created file is JavaPurchaseOrder.xrp. This file can be imported in FO Designer. 3. Use FO Designer to generate a FO file which will be used at runtime. The generated file is JavaPOExample.fo 4. At runtime you have to 1. create your Java objects 2. convert them to XML using JAXB 3. convert the XML to PDF using JavaPOExample.fo and Apache FOP You can see how this is done in the POTest.java file. The source code is aproximately: / 1. create order object PurchaseOrderHeader po=new PurchaseOrderHeader("1"); po.setbuyer(new BuyerInformation("John Solo","Street ABC 1","Manchester","AB 673","UK")); PurchaseOrderItem[] items={ new PurchaseOrderItem("X1","Printer Injet",1), new PurchaseOrderItem("R4","Optic mouse",1), new PurchaseOrderItem("M3","Ergo keyboard",1), new PurchaseOrderItem("X4","CDRW",10) }; po.setitems(items); // 2. create now XML representation of the order
63 JAXBContext jc = JAXBContext.newInstance(PurchaseOrderHeader.class); Marshaller marshaller=jc.createmarshaller(); ByteArrayOutputStream ba=new ByteArrayOutputStream(); marshaller.marshal(po,ba); / 3. create now the PDF output for the XML data FOProcessor processor=new FOProcessor(); processor.process(new ByteArrayInputStream(ba.toByteArray()), new FileInputStream("JavaPOExample.fo"), new FileOutputStream("JavaPOExample.pdf")); You can use the file POTest.bat for testing the delivered files. Sending the PDF as an attachment This option is currently available only for the APEX server, please check the APEX specific documentation. Adding a digital signature to the PDF file You can add a digital signature to the PDF files you generate. This signature ensures the integrity of your document and its authentication. In other words, the receiver of the document knows you have created that document (authentication) and no one has modified it (integrity). The signature created will use the algorithms RSA signature, SHA1 hash and PKCS7 encoding. The signature can be created in the design environment for testing purposes and of course also in the runtime environment. Please read the environment specific document (for example Apex) to learn how to activate the signature. The rest of this section describes how to test the digital signature in the designer and view it in Acrobat reader. In order to activate the digital signature you use the preferences window. In this window you activate the signature and select the p12 or pfx file which contains the private key used for the signature. Note our product contains a test certification authority (CA) and a test certificate in the certs subdirectory. You can use these for testing purposes.

 we have used for creating the test certificate.")
64 If you have enabled the signature in the settings window, each time you generate a PDF file with the PDF button, the designer will ask for the password of the p12 file. The password of the test file we provide is test. Note, if you click on the cancel button, the PDF file will be created without the signature. Once you open the created file, you will notice Acrobat reader warns you with the text "the signature has problems". The reason for this is, Acrobat does not know the certificate authority (CA) we have used for creating the test certificate. Looking at the signature closely in the signatures panel you will see: The PDF reader says the document has not been modified since the signature has been applied (integrity of the document).


65 The signer's identity is unknown since the reader does not know our test CA. If you however click on the certificate details link and add the CA certificate as a trusted certificate, you will see the reader now accepts the signature.

66 6. Learn by doing: tutorial The examples in the database Use the open database icon admin. to open the database. Use the default user admin and password Use the open report from database icon to access the examples

67 Hands on example In this tutorial we will take as input an XML document which contains the list of employees for each department. We want to create a PDF file with the list of departments and for each department the list of employees. We will start running the FO Designer and we get an empty template. 1. First we load the XSD departmentemployees.xsd. The result will be: as an alternative (if we do not have a XSD file), we can click on the create schema from XML button and load the XML document departmentemployees.xml. This would read the XML document and list of existing XML nodes, as a result it would create a kind of "virtual" schema. 2. As second step we copy and paste the XML test file in the XML test files folder departmentemployees.xml. As you can see this file contains 2 departments:


68 3. Our template will use 2 areas, the header area for the name of the department and the detail area for the employees. So first we will tell FO Designer we want to have a header area for each department in the XML document. So we click on the header area title button to display the properties of the area and we set XML node to /departments/department.


69 furthermore we set the New page property (in the control tab) to true because we want to have a new page for each department. 4. Now we do something similar with the detail area, we click on the detail are title button and set the XML Node to /departments/department/person, since we want to have a detail line for each employee, furthermore, you have to make sure the XML Node type is relative since we want to list only the employees of the current department. Note also we have set visibility flag in the detail heaer area to false because we will not use that area. 5. We will now add some fields to the header area. Click on the button and place the following fields in the header area: the only properties you must change are: value = List of employees font = size 18 font color=red 6. next you add 2 more fields the properties you have to set are: value property of the left field = Department: value property of the right field= empty


70 name property of the right field= DepartmentName XPath property of the right field= /departments/department/departmentname 7. Now we can test the template by clicking on the PDF button The output will be a PDF file with two pages: 8. As next step you can proceed adding the fields in the detail area: the three fields on the left have a black border because we have defined the constant property to true. For all these 3 fields you have to: drag the field tool and to the place in the area change the constant property to true and the value property to the value you see in the screenshot (Name:, Address: and Status:) Add 2 variable fields (the ones with blue borders) and select as Xpath /departments/department/person/name and /departments/department/person/address the third variable field is actually a combobox and must be defined like this: Drag the combo box tool to the area Set the XPath to /departments/department/person/status The Keys list must be defined as in this screenshot:

71 in this way the values A and I which are contained in the XML document will be replaced with the more descriptive values "Active" and "Inactive". 9. We can test the template by clicking on the PDF button

72 10. The ouput will now contain the detail information (persons): 11. we can also add a line to separate the persons, note we added in this screenshot a line object:
 function in the Xpath to counter the number of persons in the department.")
73 12. The output is now: 13. And last we will add a counter field in the template footer. This field has the following special handling: We have used the count() function in the Xpath to counter the number of persons in the department. We use the XPath type absolute which means the Xpath will be issued exactly as we enter it. The XPath itself references only the person node. The reason for this is, the footer is implicitly dependent on the header and the header is associated to the department node. It would also be correct to set the Xpath type to relative and the XPath to count(/departments/department/person). However the use of functions and the xpath type relative is in this version of the designer not supported.
74 7. The invoice IDOC example explained The example placed in the idoc_invoice subdirectory shows how you can create a user friendly PDF file from a SAP XML IDOC. This example has been based on the INVOIC01 format but it can be easily changed to be used with other IDOC types or versions. In this section we will highlight some common task like: How to work without a schema file. Use of conditions in the XPath Use of second level detail areas. Use of comboboxes The PDF ouput of the invoice will be:
 3.")
75 The report s invoiceidoc.xre layout is: The structure of the template is: 1. There is a Page header that contains the IDOC number 2. There is a Invoice header that contains the buyer information (bill to and delivered to) 3. after the invoice header there may be (optional) some comments to the invoice: Note the Detail 2 area has been associated to the /INVOIC01/IDOC/E1EDKT1/E1EDKT2/TDLINE node. There is one such node in the XML document for each comment line, so the area will be repeated for each comment line. If no comment lines exist, the area will not be created at all. The detail 2 area also has a detail 2 columns header area, this area will be created also only if at least one comment line exists. Furthermore the super area property of the Detail 2 area has been set to the header area. 4. after the comments there is a table header for the items in the invoice 5. The detail area will be repeated for each item in the invoice. Note the Detail area has been associated to the node /INVOIC01/IDOC/E1EDP01. This element exist for each item in the invoice. Furthermore the super area property of the Detail area has been set to the Header area.

76 6. for each item, there may be (optional) one or several comment lines. Note the Detail 1 area has been associated to the node /INVOIC01/IDOC/E1EDP01/E1EDPT1/E1EDPT2 which contains the item level comments. Furthermore the super area property of the Detail 1 has been set to the Detail area. 7. The invoice footer contains some totals information. In the same way as the invoice header, the footer does not have to be associated to any XML node in the XML document since both areas exits only (and always) once in each invoice. This therefore assumes the input XML document (IDOC) can contain only one invoice. 8. The page footer contains the legal information of the company issuing the invoice. how to work without a schema file In this example we do not have a XSD file that describes the IDOC invoice, therefore we click on the create schema from XML button in the settings tab of the report, select the INVOIC-out.xml file and we get a pseudo-schema (INVOIC-out.xsd) created from the test file:

77 Use of second level detail areas As already described in the structure of the template, this example contains a second level detail area called "detail 1". This area contains the comments associated to the items of the invoice. The key steps to achieve this are: An area (Detail 1) has been inserted below the Detail area The XML node property of Detail1 is pointing to the /INVOIC01/IDOC/E1EDP01/E1EDPT1/E1EDPT2 which contains the comments of the item. The XML node type is set to relative, since the super area is pointing to /INVOIC01/IDOC/E1EDP01, the XML node property will refer to the comments of the current line only.


78 Use of conditions in the XPath The bill to and delivered to information show a very common pattern in XML structures. The XML node /INVOIC01/IDOC/E1EDKA1/NAME1 contains the name of a company, but the meaning of the company is described by another node, namely the /INVOIC01/IDOC/E1EDKA1/PARVW. If the content of that node is RE, it means the data in the parent node refer to the bill to party. That is why the used Xpath is: /INVOIC01/IDOC/E1EDKA1[PARVW='RE']/NAME1 which means, select the NAME1 node in the /INVOIC01/IDOC/E1EDKA1 node that meets the condition PARVW='RE'.
![Note you have to type in the condition part of the Xpath in the bottom field of the XPath selector window. You can add condition in square brackets [ ] at any position of the XPath.](/docs-images/75/72150043/images/79-0.jpg "Use of combo boxes The first field in the invoice header is a good example for a combobox.")
79 Note you have to type in the condition part of the Xpath in the bottom field of the XPath selector window. You can add condition in square brackets [ ] at any position of the XPath. Use of combo boxes The first field in the invoice header is a good example for a combobox. The XML node /INVOIC01/IDOC/E1EDK14[QUALF='015']/ORGID can contain the values F2 or G2 which do not mean anything to a normal user. The combobox allows you to replace this codes with the descriptive values "invoice" and "credit note" which are the business meaning of those code.
.")

80 8."Group by" example In the database there is an example called departmentemployeesgrouping.xre. This example shows how to use the "group by" feature. The example takes as input a list of employees and groups them by status (in the test file there are 2 status, active and inactive). For grouping 2 areas are required, one group header and one group detail: The group header must contain the value use for grouping in the "XML group by" property. In this example the status element. You must also set the value for "XML Node", these are the nodes you will be grouping, in this case persons. Note, starting with version 2.1 it is possible to group by up to 3 fields.

81 In the group header you can output the value of the element you are grouping by (in this case status). Group detail areas have the following restrictions: the value for the XML Node property will be inherited from the header. the XML Group by property may not be used. Note nested groups are not supported. Group footers The example departmentemployeesgrouping_footer.xre shows how to create group footers. Group footers are used to show total fields of the values in the group for each value being grouped. In the example the group footer is used to show the total number of employees for each status. Group footers have to be implemented as follow: create a new area placed after the group detail area. In the example the footer area is the "detail 2" area. The footer area must have as "super area" the "group header". In our example the super area of "detail 2" is "detail 1" which is the group header. If you want to count or sum the fields of the current group you use an xpath expression like this one: count(/departments/department/person[status = current()/status]) this means, count all persons (/departments/department/person) whose status has the same value as the current's group status. Note we are grouping by status so when this is executed for the "active" employees status, it will count all employees whose status is "active". Let's assume each person has a child element called "salary", we could sum all salaries of the employees in the current status like this:
82 sum(/departments/department/person[status = current()/status]/salary) this means select the salary of all employee whose status is the same status as the current group and then sum all selected salaries.

83 9. The two columns example The example taskstwocolumns shows how to use Xpath to create a two columns report. The output will look like this: It is a list of tasks organized in 2 columns, with the task name and the employee assign to the task. The layout of the report is: there is a detail area which will contain 2 task bame fields (2 columns). Therefore the area will need to be repeated for every second task. The Xpath to achieve this is: ROWSET/ROW[position() mod 2 = 1] this will select every second ROW element in the XML In the area there are 2 TaskName field. The Xpath of the fields are: TASK_NAME : to select the TASK_NAME field in the current ROW node TASK_NAME/../following-sibling::ROW/TASK_NAME: to select the TASK_NAME field in the next ROW after the currently selected ROW (this will be the second column) The XPATH expression means: select current TASK_NAME use the /../ to select the parent node (the ROW node) following-sibling::row: will select the next ROW /TASK_NAME selects the field in the ROW

84 10. The Barcodes and dynamic images example explained The example personcard.xre in the database which shows how to: use barcodes dynamically select an image This example creates a personal card with the name and address of a person together with the photo and a barcode which encodes the name of the person. The input file is a XML file with a list of persons and their information, the schema of the XML file is very simple:

, so we use the xpath field and")
85 The card has been split in 4 columns, the first one contains the photo and the last one contains the barcodes. These are the 2 objects we are interested in. The image object could be a static image file if you enter a file name in the image field, however in this example we want to select a different image for each person (the photo), so we use the xpath field and enter the value concat('examples/barcodes/foto_',id,'.png').

86 This expression concatenates the 3 values: examples/barcodes/foto_ id of a person.png Since one of the persons has the id the result for that person will be examples/barcodes/foto_12345.jpg. So that is the file that will be used as photo for that person. Note we used the value id instead of /list/person/id in the concat function. Since the XMLNode of the detail area (the card) is /list/person, we have to use the value id to find the correct value for the current person.


87 The barcode is the second interesting object in this example. When you add a barcode to your document the barcode type selection window will popup. At this point you have to decide if it will be a 1D barcode (e.g. EAN or Code128) or a 2D barcode (Datamatrix, PDF417...).

88 Once the barcode is in your document you can distinguish 2 kind of properties: In the Data section you can find properties which are common to all barcodes types. These are: XPath: as with other objects this is the location in the XML document where the information for the barcode can be found. This is the information to be encoded in the barcode, in our example the name of the person. Binary base64: this is required if you are going to encode binary data. In this case the XML document must contain base64 encoded binary data and the xpath field must point to a XML node which contains Base64 encoded data. Process tilde: if true the tilde character (~) will be processed accordingly. Please refer to the specific barcode documentation (see link below). In the Format section the barcode type specific properties are located. In this Datamatrix example, you can see the datamatrix encoding and format properties. You can find more information about the barcode specific properties here
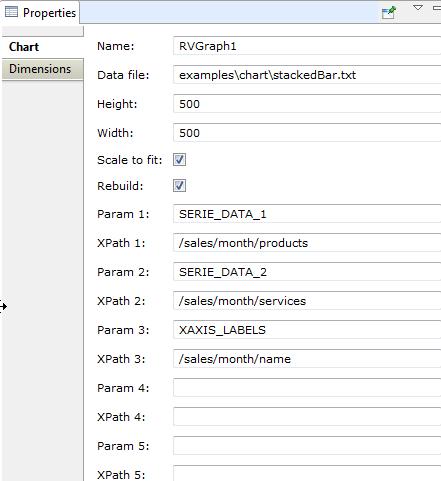
89 11. The chart example explained The directory examples\chart contains an example that shows how to use J4L RChart within the designer. The usage of RChart involves 2 steps: 1. First you have to design the chart independently of the FO Designer. The documentation for RChart is here: Optionally you can use the Visual Builder to design you chart. In any case the output of the chart designer process is a parameters file (see example\chart\stackedbar.txt) which contains the chart and some test data you have used during the development. We do not recommend to develop a new chart from scratch but take one of the existing example and modify it according to your needs. You can download the Rchart evaluation package and you will find many examples in the data\examples directory. 2. in the second step you create your report, add a chart object and specify the following properties (see screenshot below): the "Data File" field must point to the chart's parameter file the parameters of the data file whose values must be overwritten by the values from the XML file. You can enter up to 9 of these parameters. In the example the values for the parameters SERIE_DATA_1, SERIE_DATA_2 and XAXIS_LABELS will be read from the XML elements defined in the "XPath" fields (thus the test values for these parameters in the stackedbar.txt file, will be overridden).
90

91 12. The running totals example explained A very commoun requirement is to have a page footer with the subtotal of the items in the current and previous pages and a total amount at the end of the document. The running totals example located in examples\xcbl_order\order_subtotal.xrp shows how create the subtotal item at the end of each page. The output of this example is a 2 page document, in the first page the label "Subtotal" will be generated, together with the sum of all items in the page in the second page the text is "Total" and the value is the sum of all items in the document. to achieve this result, two items in the detail area must be selected, one will be the LineAmount field which needs to be summed up, and the other can be any field, in this case the article field has been taken: The LineAmount field has the property Use for Subtotal set to Yes and the subtotal type SUM will cause the values of this field to be summed up during the PDF generation.


92 The Article field will be used to create the "subtotal" and "total" labels. Note the subtotal type is now CONSTANT and the two constant value fields have been filled with the correct value.

93 To finish up the set up, the 2 fields in the page footer must reference the subtotal field in the detail section.
, however this requires that you use our FOP server since the generation of PDF forms is not part of the XSL-FO standard.")

94 13. PDF interactive forms Introduction Starting with version 1.5 you can create PDF forms using J4L FO Designer (Suite edition), however this requires that you use our FOP server since the generation of PDF forms is not part of the XSL-FO standard. You will find an introduction to the usage of and motivations for PDF forms at this page in our site. Note the generation of forms requires the suite or enterprise license and the use of J4L FOP Server. Form objects The highlighted objects in the toolbar can be used for data entry: Text fields.this object is also used in non-form PDF files to display data. Combo boxes. This object is also used in non-form PDF files to display data. Checkbox. This object can be used in forms only. Button (to submit or reset a form).this object can be used in forms only. Text fields and combo boxes are normally used to display data. In order to activate them for data entry the "Input field" property must be set to yes.

95 Input fields have a green border in the designer. Text field Text fields can be used to allow free entry of data. The following properties are available for these kind of input fields: Read only: It is possible to set the field to read only, this is useful to prefill fields which you later can read when the user has submitted the PDF form. The read only field can contain a user id which you would use to identity the form. Is hidden field. If true the field will not be displayed in the PDF reader but the field is still contained inthe PDF file. Mandatory: the field must contain a value Multiline: several lines of text can be entered in the field. Max length: maximum number of characters that can be entered The default value of the text field will be the constant one (see value property) or the one returned by the Xpath. Combo box This kind of fields offer a list of values the user can select. They behave in a similar way as text fields. Checkbox Checkboxes are input fields which can only contain the value true or false (selected or not selected).

96 Button Button objects are used to execute actions. The actions available at this time are: reset form to the default values. submit form. In this case you have to enter the url in the "Submit to URL" field. This can be: address URL, for example: A web server HTTP URL, for example The submit URL value can also be filled dynamically from the XML data using the Xpath. The submission format, HTML, XML or PDF Filling in the form There are several ways to submit the forms: submitting to a web server (as PDF, HTML or XML) (as PDF or XML) printing and sending paper sending the filled PDF file by any other means The option (4 or partly 2) that requires you to save the filled form to a PDF file has a potential issue. If you use Adobe Reader you will get an error like this one "You cannot saved data typed into this form". The reason for this is, Adobe Reader allows saving filled forms only if the forms has been created and digitally signed by Adobe tools. At this point you have some options:
97 1. Buy Adobe LiveCycle reader extensions server which will add the signature to the form. 2. Use Adobe standard to fill in the form (instead of the free adobe reader) 3. or use another reader. there are several free PDF readers that will allow you to fill and save forms. One of them is Nitro PDF Reader
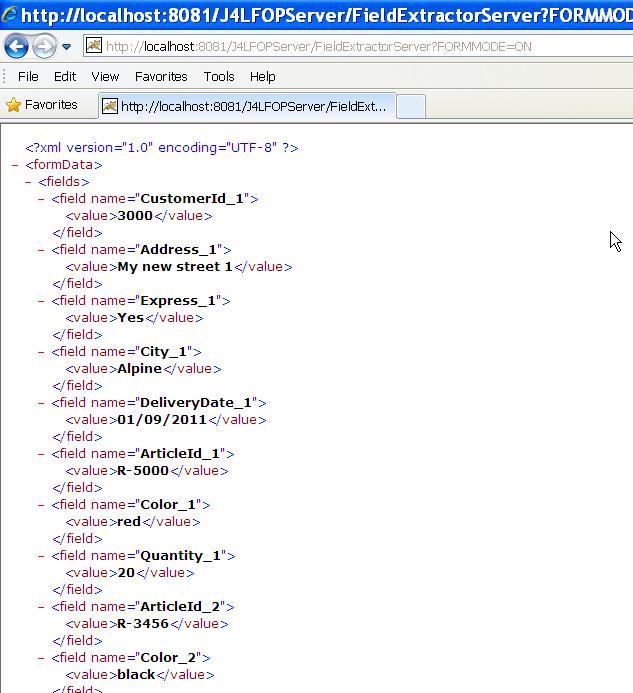
98 Form submission The PDF form can be submitted in several ways: to a web server using HTTP by or saving the filled form to a PDF file and submitting by any other means. There are several formats which can be used to receive the form data: HTML, the data will be submitted to your web server (the URL you have specified) using the HTTP POST method. The body on the HTTP request will be something like this: FieldName1=value1&FieldName2=value2&... XML. The format of the data when submitted using XML is: <?xml version="1.0" encoding="utf-8" standalone="no"?> <formdata> <fields> <field name="fieldname1"><value>value1</value></field> <field name="fieldname2"><value>value2</value></field>... <fields> </formdata> PDF. Submitting in PDF format requires you to have a reader that allows you to do that (see previous section), it has the advantage that the user can keep a copy of the same file she has submitted. The receiver of the submitted PDF can also display the received data in a user friendly way. In order for your application to extract the content of the submitted PDF you have 2 options: o Use our servlet which converts PDF to XML. The file J4LFOPServer.war file contains a servlet, once this file has been deployed to a web server you can reach our servlet in this URL: This servlet accepts HTTP POST requests which contain the PDF as body of the request, and returns the XML file with the field values. o It also accepts files to be uploaded using an HTML form using the parameter FORMMODE=ON, see example FormRead.html inside J4LFOPServer.war. Or use our Java API to extract tha values of the fields. This example shows how to do it: import com.java4less.xreport.fop.formvaluesextractor;... FormValuesExtractor extractor=new FormValuesExtractor(); FileInputStream is=new FileInputStream("myform.pdf"); Hashtable fieldstable=extracttotable(is); Enumeration enum=fieldstable.keys(); while (enum.hasmoreelements()) { String key=(string) enum.nextelement(); System.out.println("Field "+key+"="+fieldstable.get(key));

99 } Input form example The file examples\form\order_form.xrp example shows how the input fields can be used. The example contains one input field of each type, furthermore it shows how fields can be repeated in the detail area. The example contains no submit button since it assumes the user will fill the form with a PDF reader that can save forms (see the Filling forms section) and submit the saved PDF by . This example is an order form which: Contains a read only field (customer number) which can be used as key for identifying the customer. The address and city fields are prefilled with the customer data but the customer can change the delivery address by modifying the fields. Contains a list of items the customer can order by just entering the quantity at selecting the color. There is a multiline comments field at the bottom. the screenshot shows how the PDF form has been filled and can be saved using Nitro PDF Reader:


 because fields in a detail section (like the items in a purchase")
100 As last step the filled forms has been received by the selling company and the values of the PDF can be extracted (see section Form submission). We include a simple HTML page inside J4LFOPServer.war which calls our form extractor server: once submitted the server returns the form content as XML, note field names have a suffix ( _1,_2..) because fields in a detail section (like the items in a purchase order) can be repeated:
101


102 14. Flavours You can use flavours to change the look of a field or combo box based on a condition. Each field has a default flavour, but you can add new ones and assign a condition to them. For each flavour you can define a font, border, color and all the set of properties of the field. We deliver an example in the file which has a field with 2 flavours: examples\xcbl_order\order_flavour.xre This report creates an output like this: the amount field will get a red color if the value is over In order to achieve this, the process has been: 1. Select the amount field and from the main menu execute create a new flavour: Once the flavour has been added, you can select it from the "Flavour" combobox (see below). The initial name of the new flavour will be New_<timestamp>. 2. The flavours section of the field properties has 3 entries: The combobox "Flavour" is used to select the current flavour you are working on. The "Name" entry, is the name of the current flavour. Use the entry to change the name of the flavour. The "Condition" field, is a XPath condition which defines when the flavour should be used. You should have one flavour without a condition, which will be

103 the default one. If you have more than 1 flavour without condition, they will be ignored, since only the default flavour may have an empty condition. In this example we have defined a new flavour called "Over1000" and we have set the condition to be "/Order/OrderDetail/ListOfItemDetail/ItemDetail/PricingDetail/TotalValue/MonetaryValue > 1000 ". The font color of the flavour has been set to red.
 in the designer will be printed as a table: The table has a header (see 2) which will contain the area s header")
 In the order.")
104 15 Advanced functionalities This section will describe how the designer generates the XSL-FO code and how you can add your own code. Note this section requires some basic knowledge of XSLT and XPATH. Understanding the generated code for areas Each detail area (see 1 in the screenshot) in the designer will be printed as a table: The table has a header (see 2) which will contain the area s header content. And a body which contains the detail area content. The body can contain many rows which are the repetitions of the detail area. For these many rows to happen the designer creates a XSLT loop using the for-each expression based on the XML Node that has been selected for the area (see 3) In the order.xre example we can see the described structure for the order lines: There is a table being created if any node /Order/OrderDetail/ListOfItemDetail/ItemDetail exists. That is what you see right below the blue comment line (xsl:if expression). There is a table header which contains the Detail Columns Header fields. There is a table body And there is a loop. This is the expression <xsl:for-each select="orderdetail/listofitemdetail/itemdetail">

 Note the code generated for the report")
105 After the loop there is the definition of the tables rows <fo:table-row, therefore a new table row will be created of each repetition of the loop, that is for each ItemDetail in the input XML. In each row the fields of the area will be printed. Further down in the code there is the end of the loop and the table to finish the area printing The result is: One table header (the grey area below) One table body with 2 rows (for 2 items in the order, since we used an input XML file with 2 items only) Note the code generated for the report header is similar but slightly different in the locations.
106 Introduction to Variables and Keys This section will introduce the use of XSLT Variables and Key in the designer. Variables can be defined like this: <xsl:variable name="variablename" select="value"/> Some examples are: <xsl:variable name="color" select= 'blue' /> : this creates a variable named color and sets the value to 'blue' <xsl:variable name="color" select= /MYDOCUMENT/COLOR /> : this creates a variable named color and sets the content of the XML node /MYDOCUMENT/COLOR. <xsl:variable name="color" /> : this creates the variable and the value will be an empty string. The variable can later on be read using the syntax $variable name. For example: You can use $color as value in the Xpath of a field name Or you can type in this expression in a free code field: <xsl:value-of select="$color"/> Keys are similar to database lookups. First you need to defined a key (this has to be done in the initialization part of the report). The syntax is: <xsl:key name="keyname" match="node" use="indexexpression"/> Name: is the name of the key. Match: is the node that the key should return. It is like a table name in a database lookup. For example, if we have a structure like /Persons/Person/FirstName and /Persons/Person/LastName and we want to create a lookup to find all persons named Peter, we use /Persons/Person as Node or Table. Use: this is the index field (like an index field in a database table). Since we are going to search by name we will use the element firstname. The key will therefore be: <xsl:key name="mysearch" match="/persons/person" use="firstname"/>
107 The Lookup can be the executed using the key() function: key(keyname,expression) The expression can be a constant like 'Peter', a variable or a node (XPath) For this input data: <Persons> <Person> <FirstName>Peter</FirstName> <LastName>Smith</LastName> </Person> <Person> <FirstName>David</FirstName> <LastName>Brown</LastName> </Person> <Person> <FirstName>James</FirstName> <LastName>Davis</LastName> </Person> <Person> <FirstName>Peter</FirstName> <LastName>Jones</LastName> </Person> </Persons> The key function can be used in the report like this: Execute the lookup and store the output in a variable named result. You can do this in the Start code in the Advanced tab of the area (see next section) <xsl:variable name="result" select="key('mysearch','peter')[1]"/> pay attention to the [1] which will store only the first returned node (in case there are several persons with name Peter) You can use the variable of the previous step in a field of your area, for example setting the Xpath value to $result/lastname.
 to create a custom loop for the area as below: We deliver an example called PersonKey.")
108 <xsl:for-each select="key('mysearch','peter')"> : This would return nodes 1 and 4. This creates a loop which need to be closed with </xsl:for-each>. Tip! You can leave the XML Node of the area empty and instead you can use the Advanced fields (see next section) to create a custom loop for the area as below: We deliver an example called PersonKey.xre where you can see the implementation of this section. Please note there are other ways of achieving the same result without using variables or keys. The only purpose of this example is to show these features in action.


109 Adding your own code There are several way of adding XSL-FO code to your report: The first one in the Free Code field. This allows the insertion of code in cells, rows and tables. We will not explain it in this section since it has already been explained in this guide. The report inititialization code can be set in the report properties, Other tab. This field can be used to define keys or report variables. For example we create here a variable which will contain the order number. The variable can be used later in the report using $ordernumber. the code will then be placed at the very top of the generated code: Each detail area and the report header contain an Advanced tab where you can place code in different locations. In the screenshot below we have added XML comments to highlight the output code location.

110 Start Code: will be place before the table creation for the area. Before row code: the code will be placed after the table loop and before the row generation. After row code: after each row repetitions Finish code: after the loop.


111 Advanced examples The following examples show how to use some of the advanced features: BooksGrouping2.xre: this is a groupby report which creates a master detail structure using a flat input structure. The report groupy by the field CUSTOMER_ID to create a list of persons and a grouped list of booked borrowed by each person BooksGrouping.xre: This is the same example as above but instead of using the built-in grouping functionality we group the books using a variable. This is done by selecting Local group and setting a variable to store the customer name: last in the detail 2 area we use the variable to select the books belonging to the current customer:

112 BooksAndCode.xre: This example is similar to the previous one. The difference here is that the input XML is not one flat structure but has 2 parallel structures that will be linked using a variable. In the ROWSET2_ROW nodes we have the list of customers which we will print out, this is the main detail area. We save the current customer in a variable for each row. In the subarea Detail 2 we use the variable to select only the corresponding records from the other structure ROWSET1_ROW.
113 16. FAQS How to prevent NaN values in numeric fields If you are using the format-number function or another numeric function on a non numeric field (or a numeric field that is empty) you will get the value NaN in your report. If you want to remove the NaN values you can use the j4lext:replacestr function to replace them with an empty string. For example if your current area is based on a XML node that has a child node called QUANTITY, which you want to format using the format-number function you can use the following xpath expression: j4lext:replacestr(format-number(quantity, '##.0'),'NaN',' ') this would prevent the NaN values in case the QUANTITY node is empty (empty string). Note however if you use functions with the j4lext prefix you must use the J4L FOP server, if you use another XSL-FO processor these functions are not available. How to enable the designer console Edit the file fodesigner.ini in the installation directory, add the line -consolelog after -startup plugins/org.eclipse.equinox.launcher_1.3.0.v jar Restart the designer, now the designer console will be shown, where you can eventually see error messages. How to debug Oracle APEX requests If you are using Oracle APEX and: the report is working in the designer but not in Oracle APEX this is what you need to check: make sure the XSL-FO file has encoding UTF-8, depending on your APEX installation you might need to change it to ANSI. If you using Oracle Data Rest Services as print server, make sure the APEX encoding has been disabled in the designer

114 If none of the above helps, try removing fields from the report one by one until the one causing the problem can be found. Look first at field having potential issues like have international characters in the text. the last alternative is installing the J4L FOP Server ( for debugging purposes the server will allow you to log the APEX request ( ) and find out where the problem is. How to enable Oracle APEX logging on Glassfish You can enable 2 types of loggings: 1. In the ORDS configuration file default.xml set this value: <entry key="debug.debugger">true</entry> 2. On the Glassfish administration console Configurations server-config Logger settings, add the entry oracle.dbtools and set the desired log level. The log file will located in the directory glassfish\domains\yourdomain\logs

115 How to create a user defined xpath function If you want to create your own function the following example shows how to do it: 1. Create a Java class with your favorite development tool. The class should contain your function as an static method, for example, we will create a function called touppercase package com.mycompany.fo; public class Functions { /** * this function converts a string to upper case */ public static String touppercase(string input) { return input.touppercase(); } } 2. Compile the java class into a jar file. The file must be called userfunctions.jar and you have to copy it to the installation directory of the J4L FO Designer. 3. Restart the J4L FO Designer 4. In the properties of your template you must enter the Java class name in the User functions class field, see highlighted field in the screenshot, then close and reopen the report in the editor. 5. Now you can use your function in the XPath editor since the function will appear in the list of available functions: Note: When you insert the function in the output, the function name will have the prefix j4luserext:
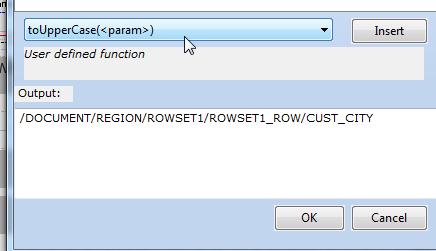
116


117 How to add new fonts to J4L FO Designer J4L FO Designer supports the five built-in PDF base fonts (Helvetica, Times, Courier, Symbol and Zapfdingbats) which must be supported by any PDF reader. However you can add new fonts using a TTF file in the following way: 1. Open the FO Designer and select Tools -> TTF Font tool the Input File must point to your TTF file and the Output XML file to the output metrics file (you can select any name you like). 2. Click on Create XML and close the dialog. 3. Edit the created XML metrics file and make sure the font-name element has the same value as the family-name node. For example: <?xml version="1.0" encoding="utf-8"?> <fontmetrics metrics-version="2" type="type0"> <font-name>comic Sans MS</font-name> <full-name>comic Sans MS</full-name> <family-name>comic Sans MS</family-name> 4. Now you have to tell J4L FO Designer to use the XML metrics file you created. You do this by editing the file fopuserconfig.xml located in the root J4L FO Designer directory.

118 You have to add these lines: <font metrics-url="file:///c:/yourdirectory/comic.xml" kerning="yes" embed-url="file:///c:/windows/fonts/comic.ttf"> <font-triplet name="comic Sans MS" style="normal" weight="normal"/> </font> note you have to change the metrics-url, the embed-url and the name values. The name must be the same family-name value from step Now you can start the J4L FO Designer and open the font dialog of any field, the new font will be available in the font selection dialog:
 2. Install the software 3. Located the TTF File you want to use and select right mouse click, properties.")
119 Note about microsoft TTF files If you want to know if you may use microsoft TTF files in your PDF Document you need to: 1. Download the Microsoft Font properties extension ( 2. Install the software 3. Located the TTF File you want to use and select right mouse click, properties. If the properties extension has been installed you will see a new tab called Embedding where you can see the license type for embedding the fonts in documents.
120 How to add new fonts to Oracle ORDS Once you added the new fonts to the designer as explained in the previous FAQ, the next step is adding it to the runtime server. This section will show how to add new fonts to Oracle ORDS. Edit the ORDS configuration file default.xml, add the following line: <entry key="fop.configfile">c:\ords\ords\fopuserconfig.xml</entry> Replace the red text with your own directory (place the fopuserconfig.xml where you like) In the fopuserconfig.xml file (which you can copy from the FO Designer installation directory) you might have an entry like this: <font metrics-url="file:///c://fonts//verdana.xml" kerning="yes" embed-url="file:///c://fonts//verdana.ttf"> <font-triplet name="verdana" style="normal" weight="normal"/> </font> This will add Verdana font support to your reports.

121 How does the designer deal with namespaces The xsl-fo file generated by the designer is not namespace aware. This means the XML to PDF conversion will fail in Apache FOP if your input file contains namespace information. In order to avoid this error you have to: At runtime you use: o either our servlet which supports the REMOVENS parameter o or our com.java4less.xreport.fop.foprocessor class whose process() method supports the removens parameter that must be set to true. In the designer activate the namescape removal. In the designer activate the namescape removal. This has to be don ein the windows-> preferences dialog. How does support for international character sets work You can use J4L FO Designer with any language, the following features support internationalization: You can add new fonts that support your language. The XSL-FO files generated by the designer use UTF-8 encoding, so any national character can be used. At runtime UTF-8 encoding is recommended however the runtime module will look into the XML preamble to determine the correct encoding. How to add my own xslfo attributes to the fields In most cases FO Designer will generate the xsl-fo output so you do not have to worry about the details of the language. However if you are familiar with xsl-fo and you want to add some additional attributes to the fo:blocks created by FO Designer you can use the property shown below:

122 How to add page numbers and page total count You can add page numbers and page total counts in the page header and page footer areas using the following value for the field: Page <fo:page-number></fo:page-number> of <fo:page-number-citation ref-id='last-page'/> the text <fo:page-number></fo:page-number> stands for the current page number and the text <fo:page-number-citation ref-id='last-page'/> will be replaced with the total page count.
9. The two columns example The Barcodes and dynamic images example explained The chart example explained
 J4L FO Designer 2.4 Table of contents 1. Introduction...4 Requirements...4 Setup & startup...5 Delivered files...8 2. The user interface...9 The properties view...10 XML Schema folder...12 The XML test
Group footers The two columns example The Barcodes and dynamic images example explained The chart example explained...
 J4L FO Designer 2.7 Table of contents 1. Introduction...4 Requirements...4 Setup & startup...5 Delivered files...8 2. The user interface...9 The properties view...10 XML Schema folder...12 The XML test
Management Reports Centre. User Guide. Emmanuel Amekuedi
 Management Reports Centre User Guide Emmanuel Amekuedi Table of Contents Introduction... 3 Overview... 3 Key features... 4 Authentication methods... 4 System requirements... 5 Deployment options... 5 Getting
Layout and display. STILOG IST, all rights reserved
 2 Table of Contents I. Main Window... 1 1. DEFINITION... 1 2. LIST OF WINDOW ELEMENTS... 1 Quick Access Bar... 1 Menu Bar... 1 Windows... 2 Status bar... 2 Pop-up menu... 4 II. Menu Bar... 5 1. DEFINITION...
P3e REPORT WRITER CREATING A BLANK REPORT
 P3e REPORT WRITER CREATING A BLANK REPORT 1. On the Reports window, select a report, then click Copy. 2. Click Paste. 3. Click Modify. 4. Click the New Report icon. The report will look like the following
Report Designer Report Types Table Report Multi-Column Report Label Report Parameterized Report Cross-Tab Report Drill-Down Report Chart with Static
 Table of Contents Report Designer Report Types Table Report Multi-Column Report Label Report Parameterized Report Cross-Tab Report Drill-Down Report Chart with Static Series Chart with Dynamic Series Master-Detail
Excel Select a template category in the Office.com Templates section. 5. Click the Download button.
 Microsoft QUICK Excel 2010 Source Getting Started The Excel Window u v w z Creating a New Blank Workbook 2. Select New in the left pane. 3. Select the Blank workbook template in the Available Templates
Using SymPrint to Make Overlays, Templates & More...
 Welcome to SymPrint SymPrint is an easy-to-use tool for creating communication overlays, worksheets, classroom activities and more using a modern toolbar and common-sense interface modeled after the programs
ImageNow eforms. Getting Started Guide. ImageNow Version: 6.7. x
 ImageNow eforms Getting Started Guide ImageNow Version: 6.7. x Written by: Product Documentation, R&D Date: September 2016 2014 Perceptive Software. All rights reserved CaptureNow, ImageNow, Interact,
Quick Reference Card Business Objects Toolbar Design Mode
 Icon Description Open in a new window Pin/Unpin this tab Close this tab File Toolbar New create a new document Open Open a document Select a Folder Select a Document Select Open Save Click the button to
Style Report Enterprise Edition
 INTRODUCTION Style Report Enterprise Edition Welcome to Style Report Enterprise Edition! Style Report is a report design and interactive analysis package that allows you to explore, analyze, monitor, report,
EtatRequete.book Page 1 Mardi, 6. avril :01 15 Reports and Queries
 Reports and Queries WinDev 15 - WebDev 15 - WinDev Mobile 15 Documentation version 15(1) - 0410 Remember to visit our Web site (www.windev.com) on a regular basis to find out whether upgraded versions
Excel 2016 Basics for Mac
 Excel 2016 Basics for Mac Excel 2016 Basics for Mac Training Objective To learn the tools and features to get started using Excel 2016 more efficiently and effectively. What you can expect to learn from
Microsoft Word 2011 Tutorial
 Microsoft Word 2011 Tutorial GETTING STARTED Microsoft Word is one of the most popular word processing programs supported by both Mac and PC platforms. Microsoft Word can be used to create documents, brochures,
Excel 2016 Basics for Windows
 Excel 2016 Basics for Windows Excel 2016 Basics for Windows Training Objective To learn the tools and features to get started using Excel 2016 more efficiently and effectively. What you can expect to learn
Stamina Software Pty Ltd. TRAINING MANUAL Viságe Reporter
 Stamina Software Pty Ltd TRAINING MANUAL Viságe Reporter Version: 2 21 st January 2009 Contents Introduction...1 Assumed Knowledge...1 Pre Planning...1 Report Designer Location...2 Report Designer Screen
Do It Yourself Website Editing Training Guide
 Do It Yourself Website Editing Training Guide Version 3.0 Copyright 2000-2011 Sesame Communications. All Rights Reserved. Table of Contents DIY Overview 3 What pages are editable using the DIY Editing
Microsoft Publisher 2013 Foundation. Publisher 2013 Foundation SAMPLE
 Microsoft Publisher 2013 Foundation Publisher 2013 Foundation Microsoft Publisher 2013 Foundation - Page 2 2013 Cheltenham Group Pty. Ltd. All trademarks acknowledged. E&OE. No part of this document may
Creating Interactive PDF Forms
 Creating Interactive PDF Forms Using Adobe Acrobat X Pro for the Mac University Information Technology Services Training, Outreach, Learning Technologies and Video Production Copyright 2012 KSU Department
Business Intelligence and Reporting Tools
 Business Intelligence and Reporting Tools Release 1.0 Requirements Document Version 1.0 November 8, 2004 Contents Eclipse Business Intelligence and Reporting Tools Project Requirements...2 Project Overview...2
Publisher 2016 Foundation SAMPLE
 Publisher 2016 Foundation Publisher 2016 Foundation Microsoft Publisher 2016 Foundation - Page 2 2015 Cheltenham Group Pty. Ltd. All trademarks acknowledged. E&OE. No part of this document may be copied
TABLE OF CONTENTS TABLE OF CONTENTS... 1 INTRODUCTION... 2 USING WORD S MENUS... 3 USING WORD S TOOLBARS... 5 TASK PANE... 9
 TABLE OF CONTENTS TABLE OF CONTENTS... 1 INTRODUCTION... 2 USING WORD S MENUS... 3 DEFINITIONS... 3 WHY WOULD YOU USE THIS?... 3 STEP BY STEP... 3 USING WORD S TOOLBARS... 5 DEFINITIONS... 5 WHY WOULD
Desktop Studio: Charts
 Desktop Studio: Charts Intellicus Enterprise Reporting and BI Platform Intellicus Technologies info@intellicus.com www.intellicus.com Working with Charts i Copyright 2011 Intellicus Technologies This document
Publisher 2016 Foundation. North American Edition SAMPLE
 Publisher 2016 Foundation Publisher 2016 Foundation North American Edition Microsoft Publisher 2016 Foundation - Page 2 2015 Cheltenham Group Pty. Ltd. All trademarks acknowledged. E&OE. No part of this
Microsoft Word 2007 on Windows
 1 Microsoft Word 2007 on Windows Word is a very popular text formatting and editing program. It is the standard for writing papers and other documents. This tutorial and quick start guide will help you
Creating Reports in Access 2007 Table of Contents GUIDE TO DESIGNING REPORTS... 3 DECIDE HOW TO LAY OUT YOUR REPORT... 3 MAKE A SKETCH OF YOUR
 Creating Reports in Access 2007 Table of Contents GUIDE TO DESIGNING REPORTS... 3 DECIDE HOW TO LAY OUT YOUR REPORT... 3 MAKE A SKETCH OF YOUR REPORT... 3 DECIDE WHICH DATA TO PUT IN EACH REPORT SECTION...
BusinessObjects Frequently Asked Questions
 BusinessObjects Frequently Asked Questions Contents Is there a quick way of printing together several reports from the same document?... 2 Is there a way of controlling the text wrap of a cell?... 2 How
Reporting Center. Primary (Stand-Alone) Interface
 Interface") Reporting Center The Reporting Center is where you will go to run or create reports on projects. It can be accessed in any of the follow ways, each with a slightly different user interface and functionality.
Reporting Center The Reporting Center is where you will go to run or create reports on projects. It can be accessed in any of the follow ways, each with a slightly different user interface and functionality.
Microsoft Excel 2010 Part 2: Intermediate Excel
 CALIFORNIA STATE UNIVERSITY, LOS ANGELES INFORMATION TECHNOLOGY SERVICES Microsoft Excel 2010 Part 2: Intermediate Excel Spring 2014, Version 1.0 Table of Contents Introduction...3 Working with Rows and
OpenForms360 Validation User Guide Notable Solutions Inc.
 OpenForms360 Validation User Guide 2011 Notable Solutions Inc. 1 T A B L E O F C O N T EN T S Introduction...5 What is OpenForms360 Validation?... 5 Using OpenForms360 Validation... 5 Features at a glance...
InDesign CS Basics. To learn the tools and features of InDesign CS to create publications efficiently and effectively.
 InDesign CS Basics InDesign Basics Training Objective To learn the tools and features of InDesign CS to create publications efficiently and effectively. What you can expect to learn from this class: How
Desktop Studio: Charts. Version: 7.3
 Desktop Studio: Charts Version: 7.3 Copyright 2015 Intellicus Technologies This document and its content is copyrighted material of Intellicus Technologies. The content may not be copied or derived from,
SAS Web Report Studio 3.1
 SAS Web Report Studio 3.1 User s Guide SAS Documentation The correct bibliographic citation for this manual is as follows: SAS Institute Inc. 2006. SAS Web Report Studio 3.1: User s Guide. Cary, NC: SAS
Introducing Gupta Report Builder
 Business Reporting Chapter 1 Introducing Gupta Report Builder You can use Report Builder to design reports. This chapter describes: Our approach to building reports. Some of the reports you can build.
Contents...i-iii. Font options...wr-12 Formatting Aids options...wr-13...wr-14 Inserting a graphic from a file...wr-14 AutoCaption options...
 Contents Contents Contents...i-iii Chapter 1 - Getting started with Writer.org...WR-1 Starting Writer...WR-1 Starting from the system menu...wr-2 Windows...WR-2 The Writer interface...wr-3 Menus...WR-3
User Guide. Web Intelligence Rich Client. Business Objects 4.1
 User Guide Web Intelligence Rich Client Business Objects 4.1 2 P a g e Web Intelligence 4.1 User Guide Web Intelligence 4.1 User Guide Contents Getting Started in Web Intelligence 4.1... 5 Log into EDDIE...
Corel Ventura 8 Introduction
 Corel Ventura 8 Introduction Training Manual A! ANZAI 1998 Anzai! Inc. Corel Ventura 8 Introduction Table of Contents Section 1, Introduction...1 What Is Corel Ventura?...2 Course Objectives...3 How to
Advanced Excel. Click Computer if required, then click Browse.
 Advanced Excel 1. Using the Application 1.1. Working with spreadsheets 1.1.1 Open a spreadsheet application. Click the Start button. Select All Programs. Click Microsoft Excel 2013. 1.1.1 Close a spreadsheet
INDEX. Drop-down List object, 60, 99, 211 dynamic forms, definition of, 4 dynamic XML forms (.pdf), 80, 89
, 80, 89") A absolute binding expressions, definition of, 185 absolute URL, 243 accessibility definition of, 47 guidelines for designing accessible forms, 47 Accessibility palette definition of, 16 specifying options
A absolute binding expressions, definition of, 185 absolute URL, 243 accessibility definition of, 47 guidelines for designing accessible forms, 47 Accessibility palette definition of, 16 specifying options
WINDEV 23 - WEBDEV 23 - WINDEV Mobile 23 Documentation version
 WINDEV 23 - WEBDEV 23 - WINDEV Mobile 23 Documentation version 23-1 - 04-18 Summary Part 1 - Report editor 1. Introduction... 13 2. How to create a report... 23 3. Data sources of a report... 43 4. Describing
Table of Contents. Word. Using the mouse wheel 39 Moving the insertion point using the keyboard 40 Resume reading 41
 Table of Contents iii Table of Contents Word Starting Word What is word processing? 2 Starting Word 2 Exploring the Start screen 4 Creating a blank document 4 Exploring the Word document window 5 Exploring
InDesign Part II. Create a Library by selecting File, New, Library. Save the library with a unique file name.
 InDesign Part II Library A library is a file and holds a collection of commonly used objects. A library is a file (extension.indl) and it is stored on disk. A library file can be open at any time while
Microsoft Office 2000 & Microsoft Word 2000 Page 1. ***** Help Options ***** To access [? ] quickly & for specific use then
![Microsoft Office 2000 & Microsoft Word 2000 Page 1. ***** Help Options ***** To access [? ] quickly & for specific use then](/thumbs/90/104468223.jpg "Microsoft Office 2000 & Microsoft Word 2000 Page 1. ***** Help Options ***** To access [? ] quickly & for specific use then") Microsoft Office 2000 & Microsoft Word 2000 Page 1 ***** Help Options ***** Microsoft Help: Options and Search [ F1 ] Fastest way to get to Office Assistant and MS Office Help! ESC to Exit File > Help
Microsoft Office 2000 & Microsoft Word 2000 Page 1 ***** Help Options ***** Microsoft Help: Options and Search [ F1 ] Fastest way to get to Office Assistant and MS Office Help! ESC to Exit File > Help
MS Word Professional Document Alignment
 MS Word Professional Document Alignment Table of Contents CHARACTER VS. PARAGRAPH FORMATTING...5 Character formatting...5 Paragraph Formatting...5 USING SHOW/HIDE TO REVEAL NON-PRINTING CHARACTERS...5
WebSphere. Clips and Tacks: Getting started with the IBM BPM suite of products
 WebSphere Clips and Tacks: Getting started with the IBM BPM suite of products ii IBM WebSphere Clips and Tacks: Getting started with the IBM BPM suite of products Contents Chapter 1. Introduction........
Word Tutorial 3. Creating a Multiple- Page Report COMPREHENSIVE
 Word Tutorial 3 Creating a Multiple- Page Report COMPREHENSIVE Objectives Format headings with Quick Styles Insert a manual page break Create and edit a table Sort rows in a table Modify a table s structure
Creating a Spreadsheet by Using Excel
 The Excel window...40 Viewing worksheets...41 Entering data...41 Change the cell data format...42 Select cells...42 Move or copy cells...43 Delete or clear cells...43 Enter a series...44 Find or replace
Sending image(s) to report Click Send Snapshot on any screen in Dolphin3D and choose the Send to Report option
 to report Click Send Snapshot on any screen in Dolphin3D and choose the Send to Report option") Dolphin 3D Reports Sending image(s) to report Click Send Snapshot on any screen in Dolphin3D and choose the Send to Report option Creating a report step by step 1. Generate the desired images in Dolphin3D
Dolphin 3D Reports Sending image(s) to report Click Send Snapshot on any screen in Dolphin3D and choose the Send to Report option Creating a report step by step 1. Generate the desired images in Dolphin3D
Creating a Newsletter
 Chapter 7 Creating a Newsletter In this chapter, you will learn the following to World Class standards: Setting the Margins Changing the Font and Font Size Inserting a Table Inserting a Picture Adding
ER/Studio Enterprise Portal User Guide
 ER/Studio Enterprise Portal 1.1.1 User Guide Copyright 1994-2009 Embarcadero Technologies, Inc. Embarcadero Technologies, Inc. 100 California Street, 12th Floor San Francisco, CA 94111 U.S.A. All rights
Chapter 5. Presenting Data
 Chapter 5. Presenting Data Copyright McGraw-Hill Education. Permission required for reproduction or display. 5-1 Map Design Process 5-2 1 About ArcGIS Chapter 5. Presenting Data 5-3 Page layouts and map
THE EXCEL ENVIRONMENT... 1 EDITING...
 Excel Essentials TABLE OF CONTENTS THE EXCEL ENVIRONMENT... 1 EDITING... 1 INSERTING A COLUMN... 1 DELETING A COLUMN... 1 INSERTING A ROW... DELETING A ROW... MOUSE POINTER SHAPES... USING AUTO-FILL...
Weidmüller Configurator (WMC) User manual
 User manual") Weidmüller Configurator (WMC) User manual Version 2018-11 Software version: V6.118.0.6999 1 Inhalt Introduction... 4 Installation guide... 4 How to... 4 System requirements... 4 First steps... 4 New project...
Weidmüller Configurator (WMC) User manual Version 2018-11 Software version: V6.118.0.6999 1 Inhalt Introduction... 4 Installation guide... 4 How to... 4 System requirements... 4 First steps... 4 New project...
Microsoft Office Word. Help. Opening a Document. Converting from Older Versions
 Microsoft Office 2007 - Word Help Click on the Microsoft Office Word Help button in the top right corner. Type the desired word in the search box and then press the Enter key. Choose the desired topic
Publisher 2013 Foundation SAMPLE
 Publisher 2013 Foundation Publisher 2013 Foundation Microsoft Publisher 2013 Foundation - Page 2 2013 Cheltenham Group Pty. Ltd. All trademarks acknowledged. E&OE. No part of this document may be copied
The HOME Tab: Cut Copy Vertical Alignments
 The HOME Tab: Cut Copy Vertical Alignments Text Direction Wrap Text Paste Format Painter Borders Cell Color Text Color Horizontal Alignments Merge and Center Highlighting a cell, a column, a row, or the
STUDENT NAME ECDL: EXCEL MR BENNELL. This is an example of how to use this checklist / evidence document
 This part contains an instruction, task or a skill which you need to sow evidence of being able to do Once you have completed a task and shown evidence of it write the date underneath the task instruction
Access: Printing Data with Reports
 Access: Printing Data with Reports Reports are a means for displaying and summarizing data from tables or queries. While forms are primarily for on-screen viewing, reports are for presenting your data
Elixir Repertoire Designer
 Aggregation and Transformation Intelligence on Demand Activation and Integration Navigation and Visualization Presentation and Delivery Activation and Automation Elixir Repertoire Designer Tutorial Guide
Guide to WB Annotations
 Guide to WB Annotations 04 May 2016 Annotations are a powerful new feature added to Workbench v1.2.0 (Released May 2016) for placing text and symbols within wb_view tabs and windows. They enable generation
Microsoft Excel 2010 Handout
 Microsoft Excel 2010 Handout Excel is an electronic spreadsheet program you can use to enter and organize data, and perform a wide variety of number crunching tasks. Excel helps you organize and track
SPARK. User Manual Ver ITLAQ Technologies
 SPARK Forms Builder for Office 365 User Manual Ver. 3.5.50.102 0 ITLAQ Technologies www.itlaq.com Table of Contents 1 The Form Designer Workspace... 3 1.1 Form Toolbox... 3 1.1.1 Hiding/ Unhiding/ Minimizing
Lava New Media s CMS. Documentation Page 1
 Lava New Media s CMS Documentation 5.12.2010 Page 1 Table of Contents Logging On to the Content Management System 3 Introduction to the CMS 3 What is the page tree? 4 Editing Web Pages 5 How to use the
Agilent MassHunter Workstation Software Report Designer Add-in
 Agilent MassHunter Workstation Software Report Designer Add-in Quick Start Guide What is the Agilent MassHunter Workstation Software Report Designer Add-in? 2 Report Designer UI elements 3 Getting Started
Spreadsheet definition: Starting a New Excel Worksheet: Navigating Through an Excel Worksheet
 Copyright 1 99 Spreadsheet definition: A spreadsheet stores and manipulates data that lends itself to being stored in a table type format (e.g. Accounts, Science Experiments, Mathematical Trends, Statistics,
Chapter 3 Using Styles and Templates
 Getting Started Guide Chapter 3 Using Styles and Templates Using Consistent Formatting in Your Documents Copyright This document is Copyright 2010 2016 by the LibreOffice Documentation Team. Contributors
Forms/Distribution Acrobat X Professional. Using the Forms Wizard
 Forms/Distribution Acrobat X Professional Acrobat is becoming a standard tool for people and businesses to use in order to replicate forms and have them available electronically. If a form is converted
IBM Rational Rhapsody Gateway Add On. User Guide
 User Guide Rhapsody IBM Rational Rhapsody Gateway Add On User Guide License Agreement No part of this publication may be reproduced, transmitted, stored in a retrieval system, nor translated into any
Study Guide. PCIC 3 B2 GS3- Key Applications-Excel. Copyright 2010 Teknimedia Corporation
 Study Guide PCIC 3 B2 GS3- Key Applications-Excel Copyright 2010 Teknimedia Corporation Teknimedia grants permission to any licensed owner of PCIC 3 B GS3 Key Applications-Excel to duplicate the contents
Introduction to Microsoft Excel 2007
 Introduction to Microsoft Excel 2007 Microsoft Excel is a very powerful tool for you to use for numeric computations and analysis. Excel can also function as a simple database but that is another class.
Adobe Acrobat Pro DC for Windows
 Adobe Acrobat Pro DC for Windows Creating Interactive PDF Forms University Information Technology Services Learning Technologies, Training & Audiovisual Outreach Copyright 2017 KSU Division of University
Configuring Ad hoc Reporting. Version: 16.0
 Configuring Ad hoc Reporting Version: 16.0 Copyright 2018 Intellicus Technologies This document and its content is copyrighted material of Intellicus Technologies. The content may not be copied or derived
Roxen Content Provider
 Roxen Content Provider Generation 3 Templates Purpose This workbook is designed to provide a training and reference tool for placing University of Alaska information on the World Wide Web (WWW) using the
The American University in Cairo. Academic Computing Services. Word prepared by. Soumaia Ahmed Al Ayyat
 The American University in Cairo Academic Computing Services Word 2000 prepared by Soumaia Ahmed Al Ayyat Spring 2001 Table of Contents: Opening the Word Program Creating, Opening, and Saving Documents
DRAFT. Table of Contents About this manual... ix About CuteSITE Builder... ix. Getting Started... 1
 DRAFT Table of Contents About this manual... ix About CuteSITE Builder... ix Getting Started... 1 Setting up... 1 System Requirements... 1 To install CuteSITE Builder... 1 To register CuteSITE Builder...
Imagine. Create. Discover. User Manual. TopLine Results Corporation
 Imagine. Create. Discover. User Manual TopLine Results Corporation 2008-2009 Created: Tuesday, March 17, 2009 Table of Contents 1 Welcome 1 Features 2 2 Installation 4 System Requirements 5 Obtaining Installation
A Guide to Quark Author Web Edition 2015
 A Guide to Quark Author Web Edition 2015 CONTENTS Contents Getting Started...4 About Quark Author - Web Edition...4 Smart documents...4 Introduction to the Quark Author - Web Edition User Guide...4 Quark
Impress Guide Chapter 11 Setting Up and Customizing Impress
 Impress Guide Chapter 11 Setting Up and Customizing Impress This PDF is designed to be read onscreen, two pages at a time. If you want to print a copy, your PDF viewer should have an option for printing
Budget Exercise for Intermediate Excel
 Budget Exercise for Intermediate Excel Follow the directions below to create a 12 month budget exercise. Read through each individual direction before performing it, like you are following recipe instructions.
P6 Professional Reporting Guide Version 18
 P6 Professional Reporting Guide Version 18 August 2018 Contents About the P6 Professional Reporting Guide... 7 Producing Reports and Graphics... 9 Report Basics... 9 Reporting features... 9 Report Wizard...
Index COPYRIGHTED MATERIAL. Symbols and Numerics
 Symbols and Numerics ( ) (parentheses), in functions, 173... (double quotes), enclosing character strings, 183 #...# (pound signs), enclosing datetime literals, 184... (single quotes), enclosing character
PDF Splitter User Guide. PDF Splitter. User Guide. CoolUtils.com. CoolUtils.com Page 2
 USER GUIDE PDF Splitter User Guide CoolUtils.com CoolUtils.com Page 2 Table of Contents 1. Introduction to PDF Splitter... 5 2. How to Get Help... 6 3. How to Install PDF Splitter... 7 4. PDF Splitter
Chapter 3 Using Styles and Templates
 Getting Started Guide Chapter 3 Using Styles and Templates Using Consistent Formatting in Your Documents Copyright This document is Copyright 2018 by the LibreOffice Documentation Team. Contributors are
Excel 2010 Level 1: The Excel Environment
 Excel 2010 Level 1: The Excel Environment Table of Contents The Excel 2010 Environment... 1 The Excel Window... 1 File Tab... 1 The Quick Access Toolbar... 4 Access the Customize the Quick Access Toolbar
FastTrack Schedule 10. Tutorials. Copyright 2010, AEC Software, Inc. All rights reserved.
 FastTrack Schedule 10 Tutorials FastTrack Schedule Tutorials Version 10.0.0 by Carol S. Williamson AEC Software, Inc. With FastTrack Schedule 10, the new version of the award-winning project manager,
Microsoft Word 2010 Tutorial
 1 Microsoft Word 2010 Tutorial Microsoft Word 2010 is a word-processing program, designed to help you create professional-quality documents. With the finest documentformatting tools, Word helps you organize
Publisher 2010 Foundation. Publisher 2010 Foundation Level SAMPLE
 Publisher 2010 Foundation Publisher 2010 Foundation Level Microsoft Publisher 2010 Foundation - Page 2 1995-2012 Cheltenham Courseware Pty. Ltd. All trademarks acknowledged. E&OE. No part of this document
ScholarOne Manuscripts. COGNOS Reports User Guide
 ScholarOne Manuscripts COGNOS Reports User Guide 1-May-2018 Clarivate Analytics ScholarOne Manuscripts COGNOS Reports User Guide Page i TABLE OF CONTENTS USE GET HELP NOW & FAQS... 1 SYSTEM REQUIREMENTS...
INTRODUCTION... 3 INSTALLATION GUIDE FOR ECLIPSE 3.1 AND INSTALLATION GUIDE FOR ECLIPSE 3.3 TO
 INTRODUCTION... 3 INSTALLATION GUIDE FOR ECLIPSE 3.1 AND 3.2... 4 INSTALLATION GUIDE FOR ECLIPSE 3.3 TO 4.3... 23 INSTALLATION GUIDE FOR ECLIPSE 4.4 OR HIGHER... 37 ECLIPSE VIEWERS... 41 DEVICES... 41
Word 2010 Beginning. Technology Integration Center
 Word 2010 Beginning File Tab... 2 Quick Access Toolbar... 2 The Ribbon... 3 Help... 3 Opening a Document... 3 Documents from Older Versions... 4 Document Views... 4 Navigating the Document... 5 Moving
Application of Skills: Microsoft Excel 2013 Tutorial
 Application of Skills: Microsoft Excel 2013 Tutorial Throughout this module, you will progress through a series of steps to create a spreadsheet for sales of a club or organization. You will continue to
Microsoft How to Series
 Microsoft How to Series Getting Started with EXCEL 2007 A B C D E F Tabs Introduction to the Excel 2007 Interface The Excel 2007 Interface is comprised of several elements, with four main parts: Office
Reference Services Division Presents. Microsoft Word 2
 Reference Services Division Presents Microsoft Word 2 This handout covers the latest Microsoft Word 2010. This handout includes instructions for the tasks we will be covering in class. Basic Tasks Review
User guide. PRISMAprepare VDP Editor VDP Editor
 User guide PRISMAprepare VDP Editor VDP Editor Copyright Copyright Copyright 2016 Océ. Illustrations and specifications do not necessarily apply to products and services offered in each local market. No
AgWare ClickFORMS 7.0 Introductory Tutorial
 AgWare ClickFORMS 7.0 Introductory Tutorial MAIN WINDOW If you have used Office 2007, our new layout will look familiar. Here is a screenshot of the new and improved AgWare ClickFORMS window: The Forms
Quick Start Guide. ARIS Architect. Version 9.8 Service Release 2
 ARIS Architect Version 9.8 Service Release 2 October 2015 This document applies to ARIS Version 9.8 and to all subsequent releases. Specifications contained herein are subject to change and these changes
Using Open Workbench Version 1.1
 Version 1.1 Second Edition Title and Publication Number Title: Edition: Second Edition Printed: May 4, 2005 Copyright Copyright 1998-2005 Niku Corporation and third parties. All rights reserved. Trademarks
Introduction to Microsoft Office 2007
 Introduction to Microsoft Office 2007 What s New follows: TABS Tabs denote general activity area. There are 7 basic tabs that run across the top. They include: Home, Insert, Page Layout, Review, and View
Using Reports. Access 2013 Unit D. Property of Cengage Learning. Unit Objectives. Files You Will Need
 Unit D CASE Samantha Hooper, a tour developer at Quest Specialty Travel, asks you to produce some reports to help her share and analyze data. A report is an Access object that creates a professional looking
Correcting Grammar as You Type
 PROCEDURES LESSON 11: CHECKING SPELLING AND GRAMMAR Selecting Spelling and Grammar Options 2 Click Options 3 In the Word Options dialog box, click Proofing 4 Check options as necessary under the When correcting