Introduction to LabVIEW
|
|
|
- Dominic Nelson
- 6 years ago
- Views:
Transcription
1 Introduction to LabVIEW
2 How to Succeed in EE 20 Lab Work as a group of 2 Read the lab guide thoroughly Use help function and help pages in LabVIEW Do the Pre-Lab before you come to the lab Don t do the post-lab independent section at the last minute
3 Lab Goals Become comfortable with the LabVIEW environment and data flow execution Front panels Block diagrams Functions and Controls Palettes Use built-in LabVIEW functions Use LabVIEW to solve problems Learn LabVIEW concepts Finding and using math and complex analysis functions Working with data types, such as arrays and clusters Displaying results 3 This lab prepares you to do the following: Use LabVIEW to create applications. Understand front panels, block diagrams, and icons and connector panes. Use built-in LabVIEW functions.
4 Section I LabVIEW Environment A. Components to a LabVIEW Application Front Panel Block Diagram B. Programming Environment Controls Palette Functions Palette Tools Palette Status Toolbar C. Additional Help Context Help Window Tips for Working in LabVIEW 4

5 Open and Run LabVIEW Start»All Programs»National Instruments LabVIEW» 8.5 Startup Screen: 8.5 Start from a blank VI: New»Blank VI or Start from an example: Examples»Find Examples 5 LabVIEW LabVIEW is a graphical programming language that uses icons instead of lines of text to create applications. In contrast to text-based programming languages, where instructions determine program execution, LabVIEW uses dataflow programming, where the flow of data determines execution order. LabVIEW Example Finder LabVIEW features hundreds of example VIs you can use and incorporate into VIs that you create. In addition to the example VIs that are shipped with LabVIEW, you can access hundreds of example VIs on the NI Developer Zone (zone.ni.com). You can modify an example VI to fit an application, or you can copy and paste from one or more examples into a VI that you create.
. Controls are inputs and indicators are outputs.")
6 LabVIEW Programs Are Called Virtual Instruments (VIs) Each VI has 2 windows Front Panel User interface (UI) Controls = Inputs Indicators = Outputs Block Diagram (ctrl-e) Graphical code Data travels on wires from controls through functions to indicators Blocks execute by data flow 6 LabVIEW programs are called virtual instruments (VIs). Controls are inputs and indicators are outputs. Each VI contains three main parts: Front panel How the user interacts with the VI Block diagram The code that controls the program Icon/connector The means of connecting a VI to other VIs In LabVIEW, you build a user interface by using a set of tools and objects. The user interface is known as the front panel. You then add code using graphical representations of functions to control the front panel objects. The block diagram contains this code. In some ways, the block diagram resembles a flowchart. You interact with the front panel when the program is running. You can control the program, change inputs, and see data updated in real time. Controls are used for inputs such as adjusting a slide control to set an alarm value, turning a switch on or off, or stopping a program. Indicators are used as outputs. Thermometers, lights, and other indicators display output values from the program. These may include data, program states, and other information. Every front panel control or indicator has a corresponding terminal on the block diagram. When you run a VI, values from controls flow through the block diagram, where they are used in the functions on the diagram, and the results are passed into other functions or indicators through wires.

7 Controls Palette Control: Numeric (Place items on the front panel window) Customize Palette View Indicator: Numeric Slide 7 Use the Controls palette to place controls and indicators on the front panel. The Controls palette is available only on the front panel. To view the palette, select View»Controls Palette. You also can display the Controls palette by right-clicking an open area on the front panel. Tack down the Controls palette by clicking the pushpin on the top left corner of the palette.

8 Functions Palette (Place items on the block diagram window) Structure: While Loop 8 Use the Functions palette to build the block diagram. The Functions palette is available only on the block diagram. To view the palette, select View»Functions Palette. You also can display the Functions palette by right-clicking an open area on the block diagram. Tack down the Functions palette by clicking the pushpin on the top left corner of the palette.

9 Searching for Controls, VIs, and Functions Palettes are filled with hundreds of VIs Press the search button to index all VIs for text searching Click and drag an item from the search window to the block diagram Double-click an item to open the owning palette 9 Use the buttons on top of the palette windows to navigate, search, and edit the palettes. You can search for controls, VIs, and functions that either contain certain words or start with certain words. Double-clicking a search result opens the palette that contains the search result. You also can click and drag the name of the control, VI, or function directly to the front panel or block diagram.


10 Creating a VI Front Panel Window Graph Indicator Block Diagram Window Boolean Control Output Terminal Input Terminal 10 When you create an object on the front panel, a terminal is created on the block diagram. These terminals give you access to the front panel objects from the block diagram code. Each terminal contains useful information about the front panel object it corresponds to, and uses color and symbols to provide information about the data type. For example, floating data types are represented with the color orange, whereas integer data types are blue. Boolean terminals are often green with TF lettering. In general, blue terminals should wire to blue terminals, green to green, and so on. This is not a hard-and-fast rule; you can use LabVIEW to connect an orange terminal (floating point data) to a blue terminal (integer data), coercing the data. But in most cases, look for a match in colors. Controls have a thick border and an arrow on the right side. Indicators have a thin border and an arrow on the left side. Logic rules apply to wiring in LabVIEW: Each wire must have one (but only one) source (or control), and each wire may have multiple destinations (or indicators).
11 Dataflow Programming Block diagram execution Dependent on the flow of data Block diagram does NOT execute left to right Note: Node executes when data is available to ALL input terminals Nodes supply data to all output terminals when done 11 LabVIEW follows a dataflow model for running VIs. A block diagram node executes when all its inputs are available. When a node completes execution, it supplies data to its output terminals and passes the output data to the next node in the dataflow path. Visual Basic, C++, JAVA, and most other text-based programming languages follow a control flow model of program execution. In control flow, the sequential order of program elements determines the execution order of a program. Consider the block diagram above. It adds two numbers and then multiplies by 2 from the result of the addition. In this case, the block diagram executes from left to right, not because the objects are placed in that order but because one of the inputs of the Multiply function is not valid until the Add function has finished executing and passed the data to the Multiply function. Remember that a node executes only when data are available at all of its input terminals, and it supplies data to its output terminals only when it finishes execution. In the second piece of code, the Simulate Signal Express VI receives input from the controls and passes its result to the graph. You may consider the add-multiply and the simulate signal code to coexist on the same block diagram in parallel. This means that they begin executing at the same time and run independently of one another. If the computer running this code had multiple processors, these two pieces of code could run independently of one another (each on its own processor) without any additional coding.
12 Tools Palette Recommended: Automatic Selection Tool Tools to operate and modify both front panel and block diagram objects Automatic Selection Tool Automatically chooses among the following tools: Operating Tool Positioning/Resizing Tool Labeling Tool Wiring Tool 12 If you enable the automatic selection tool and you move the cursor over objects on the front panel or block diagram, LabVIEW automatically selects the corresponding tool from the Tools palette. To view the Tools palette, select View»Tools Palette. You also can display the Tools palette by holding shift and right-clicking an open area on either the front panel or block diagram. Open the Tools Palette Toggle automatic selection tool by clicking the Automatic Selection Tool button in the Tools palette. Use the Operating Tool to change the values of a control or select the text within a control. Use the Positioning/Resizing Tool to select, move, or resize objects. The Positioning Tool changes shape when it moves over a corner of a resizable object. Use the Labeling Tool to edit text and create free labels. The Labeling Tool changes to a cursor when you create free labels. Use the Wiring Tool to wire objects together on the block diagram. Other important tools:
13 Status Toolbar Run Button Continuous Run Button Abort Execution Additional Buttons on the Diagram Toolbar Execution Highlighting Button Retain Wire Values Button Step Function Buttons 13 Click the Run button to run the VI. While the VI runs, the Run button appears with a black arrow if the VI is a top-level VI, meaning it has no callers and therefore is not a subvi. Click the Continuous Run button to run the VI until you abort or pause it. You also can click the button again to disable continuous running. While the VI runs, the Abort Execution button appears. Click this button to stop the VI immediately. Note: Avoid using the Abort Execution button to stop a VI. Either let the VI complete its data flow or design a method to stop the VI programmatically. By doing so, the VI is at a known state. For example, place a button on the front panel that stops the VI when you click it. Click the Pause button to pause a running VI. When you click the Pause button, LabVIEW highlights on the block diagram the location where you paused execution. Click the Pause button again to continue running the VI. Select the Text Settings pull-down menu to change the font settings for the VI, including size, style, and color. Select the Align Objects pull-down menu to align objects along axes, including vertical, top edge, left, and so on. Select the Distribute Objects pull-down menu to space objects evenly, including gaps, compression, and so on. Select the Resize Objects pull-down menu to change the width and height of front panel objects.

14 Debugging Techniques Finding Errors Execution Highlighting Click on broken Run button. Window showing error appears. Probes Click on Execution Highlighting button; data flow is animated using bubbles. Values are displayed on wires. Right-click on wire to display probe; it shows data as it flows through wire segment. You can also select Probe tool from Tools palette and click on wire. 14 When your VI is not executable, a broken arrow is displayed in the Run button in the palette. Finding Errors: To list errors, click on the broken arrow. To locate the bad object, click on the error message. Execution Highlighting: Animates the diagram and traces the flow of the data, allowing you to view intermediate values. Click on the light bulb on the toolbar. Probe: Used to view values in arrays and clusters. Click on wires with the Probe tool or right-click on the wire to set probes. Retain Wire Values: Used with probes to view the values from the last iteration of the program. Breakpoint: Sets pauses at different locations on the diagram. Click on wires or objects with the Breakpoint tool to set breakpoints.

15 Context Help Window Help»Show Context Help, press the <Ctrl-H> keys Hover cursor over object to update window Additional Help Right-click on the VI icon and choose Help, or Choose Detailed help on the context help window 15 The Context Help window displays basic information about LabVIEW objects and updates as you move the cursor over each object. Objects with context help information include VIs, functions, constants, structures, palettes, properties, methods, events, and dialog box components. To display the Context Help window, select Help»Show Context Help, press the <Ctrl- H> keys, or press the Show Context Help Window button in the toolbar. Connections for a subvi or function are displayed in Context Help: Required bold Recommended normal Optional dimmed
16 Section II Elements of Typical Programs A. Data Types B. Loop Structures While Loop For Loop C. Conditional Statements Case Structure Select (simple If statement) 16


17 A. Common Data Types Found in LabVIEW 17 LabVIEW uses many common data types Boolean, numeric, strings, clusters, and so on. To access functions specific to certain data types, you can refer to the appropriate Sub- Palette from the Functions Palette.
18 Block Diagram Wires Transfer data between block diagram objects through wires Wires are different colors, styles, and thicknesses, depending on their data types A broken wire appears as a dashed black line with a red X in the middle Scalar 1D Array 2D Array DBL Numeric Integer Numeric String 18 In LabVIEW, you use wires to connect multiple terminals together to pass data in a VI. You must connect the wires to inputs and outputs that are compatible with the data that is transferred with the wire. For example, you cannot wire an array output to a numeric input. In addition the direction of the wires must be correct. You must connect the wires to only one input and at least one output. For example, you cannot wire two indicators together. The components that determine wiring compatibility include the data type of the control and/or the indicator and the data type of the terminal.
19 Block Diagram Wiring Tips Press <Ctrl-B> to delete all broken wires Right-click and select Clean Up Wire to reroute the wire 19

20 B. Loop Structures While Loop While Loop Terminal counts iterations Always runs at least once Runs until stop condition is met For Loop Terminal counts iterations Runs according to input N of count terminal For Loop 20 Both the While and For Loops are located on the Functions»Structures palette. The For Loop differs from the While Loop in that the For Loop executes a set number of times. A While Loop stops executing the subdiagram only if the value at the conditional terminal exists. While Loops Similar to a Do loop or a Repeat-until loop in text-based programming languages, a While Loop, shown at the top right, executes a subdiagram until a condition is met. The While Loop executes the subdiagram until the conditional terminal, an input terminal, receives a specific Boolean value. The default behavior and appearance of the conditional terminal is Stop If True. When a conditional terminal is Stop If True, the While Loop executes its subdiagram until the conditional terminal receives a TRUE value. The iteration terminal (an output terminal), shown at left, contains the number of completed iterations. The iteration count always starts at zero. During the first iteration, the iteration terminal returns 0. For Loops A For Loop, shown above, executes a subdiagram a set number of times. The value in the count terminal (an input terminal) represented by the N, indicates how many times to repeat the subdiagram. The iteration terminal (an output terminal), shown at left, contains the number of completed iterations. The iteration count always starts at zero. During the first iteration, the iteration terminal returns 0.


21 Drawing a Loop 1. Select the structure 2. Enclose code to be repeated 3. Drop or drag additional nodes and then wire 21 Place loops in your diagram by selecting them from the Functions palette: When selected, the mouse cursor becomes a special pointer that you use to enclose the section of code you want to include in the While Loop. Click the mouse button to define the top-left corner and then click the mouse button again at the bottom-right corner. The While Loop boundary appears around the selected code. Drag or drop additional nodes in the While Loop if needed.

22 C. Conditional Statements 1. Case Structures 2. Select (a) (b) (c) 22 Case Structure The case structure has one or more subdiagrams, or cases, one of which executes when the structure executes. The value wired to the selector terminal determines which case to execute and can be Boolean, string, integer, or enumerated type. Right-click the structure border to add or delete cases. Use the Labeling tool to enter value(s) in the case selector label and configure the value(s) handled by each case. It is found at Functions» Programming»Structures»Case Structure. Select Returns the value wired to the t input or f input, depending on the value of s. If s is TRUE, this function returns the value wired to t. If s is FALSE, this function returns the value wired to f. The connector pane displays the default data types for this polymorphic function. It is found at Functions»Programming» Comparison»Select. Example A: Boolean input. Simple if-then case. If the Boolean input is TRUE, the true case executes; otherwise the FALSE case executes. Example B: Numeric input. The input value determines which box to execute. If out of range of the cases, LabVIEW chooses the default case. Example C: When the Boolean passes a TRUE value to the Select VI, the value 5 is passed to the indicator. When the Boolean passes a FALSE value to the Select VI, 0 is passed to the indicator.
23 Section III Presenting Your Results Displaying Data on the Front Panel Controls and Indicators Graphs and Charts 23

24 What Types of Controls and Indicators Are Available? Numeric Data Number Input and Display Analog Sliders, Dials, and Gauges Boolean Data Buttons and LEDs Array and Matrix Data Numeric Display Chart Graph XY Graph Intensity Graph 3D Graph: Point, Surface, and Model Decorations Tab Control Arrows Other Strings and Text Boxes Picture/Image Display ActiveX Controls Express Controls Palette 24 Controls and indicators are front panel items that you can use to interact with your program to provide input and display results. You can access controls and indicators by right-clicking the front panel. In addition, you obtain additional controls and indicators when you install toolkits and modules. For example, when you install the control design tools, you can use specialized plots, such as Bode and Nyquist, that are not available by default.

25 Charts Add 1 Data Point at a Time with History Waveform chart special numeric indicator that can display a history of values Chart updates with each individual point it receives Controls»Express»Graph Indicators»Chart 25 The waveform chart is a special numeric indicator that displays one or more plots. It is located on the Controls»Modern»Graph palette. Waveform charts can display single or multiple plots. The following front panel shows an example of a multiplot waveform chart. You can change the minimum and maximum values of either the x-axis or y-axis by double-clicking on the value with the labeling tool and typing the new value. Similarly, you can change the label of the axis. You can also right-click the plot legend and change the style, shape, and color of the trace that is displayed on the chart.


26 Graphs Display Many Data Points at Once Waveform graph special numeric indicator that displays an array of data Graph updates after all points have been collected May be used in a loop if VI collects buffers of data Controls»Express»Graph Indicators»Graph 26 Graphs are very powerful indicators in LabVIEW. You can use these highly customizable tools to concisely display a great deal of information. With the properties page of the graph, you can display settings for plot types, scale and cursor options, and many other features of the graph. To open the properties page, right-click the graph on the front panel and choose Properties. You can also create technical-paper-quality graphics with the export simplified image function. Right-click the graph and select Data Operations»Export Simplified Image
27 Tips for Working in LabVIEW Keystroke Shortcuts <Ctrl-H> Activate/Deactivate Context Help Window <Ctrl-B> Remove Broken Wires from Block Diagram <Ctrl-E> Toggle between Front Panel and Block Diagram <Ctrl-Z> Undo (also in Edit menu) <Right-Click> Open Controls/Functions Palette Tools»Options Set Preferences in LabVIEW 27 LabVIEW has many keystroke shortcuts that make working easier. The most common shortcuts are listed above.
Lesson 1 Introduction to LabVIEW. TOPICS LabVIEW Environment Front Panel Block Diagram Dataflow Programming LabVIEW Help and Manuals Debugging a VI
 Lesson 1 Introduction to LabVIEW TOPICS LabVIEW Environment Front Panel Block Diagram Dataflow Programming LabVIEW Help and Manuals Debugging a VI 1 Virtual Instruments (VIs) Front Panel Controls = Inputs
NI LabView READ THIS DOCUMENT CAREFULLY AND FOLLOW THE INSTRIUCTIONS IN THE EXERCISES
 NI LabView READ THIS DOCUMENT CAREFULLY AND FOLLOW THE Introduction INSTRIUCTIONS IN THE EXERCISES According to National Instruments description: LabVIEW is a graphical programming platform that helps
Lesson 4 Implementing a VI
 Lesson 4 Implementing a VI A. Front Panel Design B. LabVIEW Data Types C. Documenting Code D. While Loops E. For Loops F. Timing a VI G. Iterative Data Transfer H. Plotting Data I. Case Structures A. Front
Virtual Instrumentation With LabVIEW
 Virtual Instrumentation With LabVIEW Course Goals Understand the components of a Virtual Instrument Introduce LabVIEW and common LabVIEW functions Build a simple data acquisition application Create a subroutine
LabView instrumentoinnissa, 55492, 3op Labview in instrumentation
 LabView instrumentoinnissa, 55492, 3op Labview in instrumentation Lecturer: Heikki Ojala, heikki.ojala@helsinki.fi, room C204a Physicum Teaching assistant: Hannu Koskenvaara, hannu.koskenvaara@helsinki.fi,
Virtual Instrumentation With LabVIEW
 Virtual Instrumentation With LabVIEW Section I LabVIEW terms Components of a LabVIEW application LabVIEW programming tools Creating an application in LabVIEW LabVIEW Programs Are Called Virtual Instruments
LabVIEW. Table of Contents. Lesson 1. Pre-reqs/Technical Skills Basic computer use
 LabVIEW Lesson 1 Pre-reqs/Technical Skills Basic computer use Expectations Read lesson material Implement steps in software while reading through lesson material Complete quiz on Blackboard Submit completed
A. Front Panel Design Lesson 4 Implementing a VI
 A. Front Panel Design Lesson 4 Implementing a VI Inputs and outputs lead to front panel design Retrieve the inputs by the following methods: TOPICS A. B. C. D. E. F. Front Panel Design LabVIEW Data Types
Lab 1: Getting familiar with LabVIEW: Part I
 Lab 1: Getting familiar with LabVIEW: Part I The objective of this first lab is to provide an initial hands-on experience in building a VI. For detailed explanations of the LabVIEW features mentioned here,
LabVIEW & FRC. BAA Fall Education Day 2015
 LabVIEW & FRC BAA Fall Education Day 2015 Who am I? Jayesh Jariwala, P.E. Univ of Delaware BChE 98 Process control engineer for 17+ years Working at Applied Control Engineering, Inc FRC Mentor for 6 years
LabView programming 練習
 Virtual Instrumentation With LabVIEW LabView programming 練習 工綜六樓計算機室電腦 LabView 8.0 ( 目前最新版 Labview 2010) Interactive guide to LabView 請自行前往使用 1 LabVIEW 試用 http://www.ni.com/trylabview/zht/ 下載試用版 : OR 網路導覽與試用
Introduction to LabVIEW 6-Hour Hands-On
 Introduction to LabVIEW 6-Hour Hands-On National Instruments Corporation 1 Introduction to LabVIEW Hands-On Course Goals Become comfortable with the LabVIEW environment and data flow execution Ability
National Instruments Corporation 1 Introduction to LabVIEW Hands-On
 National Instruments Corporation 1 Introduction to LabVIEW Hands-On This is a list of the objectives of the course. This course prepares you to do the following: Use LabVIEW to create applications. Understand
Introduction to LabVIEW
 University College of Southeast Norway Introduction to LabVIEW Hans-Petter Halvorsen, 2016-09-07 http://home.hit.no/~hansha Preface This document explains the basic concepts of LabVIEW. You find additional
The LabVIEW Programming Environment and Basic Operations
 Page 1 of 14 UNM The LabVIEW Programming Environment and Basic Operations Introduction In this hands-on, you will learn about the LabVIEW programming environment. You will also write a simple Virtual Instrument
Introduction to LabVIEW Exercise-1
 Introduction to LabVIEW Exercise-1 Objective In this Laboratory, you will write simple VIs to incorporate basic programming structures in LabVIEW. This section will teach you fundamentals of LabVIEW front
National Instruments Corporation 1 Introduction to LabVIEW Hands-On
 National Instruments Corporation 1 Introduction to LabVIEW Hands-On This is a list of the objectives of the course. This course prepares you to do the following: Use LabVIEW to create applications. Understand
Lab 4 - Data Acquisition
 Lab 4 - Data Acquisition 1/13 Lab 4 - Data Acquisition Report A short report is due at 8:00 AM on the Thursday of the next week of classes after you complete this lab. This short report does NOT need to
CLAD Sample Exam 03. C. A control that output a cluster of the controls / indicators on the tabs.
 Name: Date: CLAD Sample Exam 03 1. Where can a VI be documented so that the description appears in the Show Context Help popup window? A. In the VI Properties Documentation window B. Typing in the Show
Linear Control Systems LABORATORY
 Islamic University Of Gaza Faculty of Engineering Electrical Engineering Department Linear Control Systems LABORATORY Prepared By: Eng. Adham Maher Abu Shamla Under Supervision: Dr. Basil Hamed Experiments
Certified LabVIEW Associate Developer Examination
 Certified LabVIEW Associate Developer Examination Examinee Date: Administrator Date: Note: The use of the computer or any reference materials is NOT allowed during the exam. Instructions: If you did not
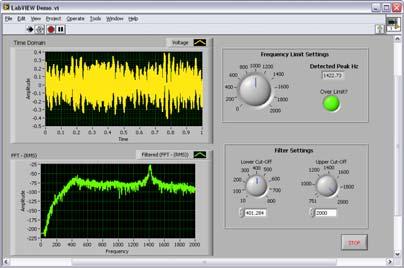
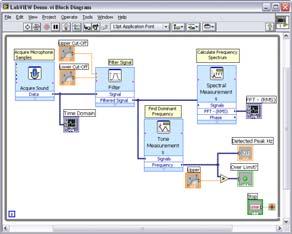
Exercise 0 - Open and Run a Virtual Instrument (Slide 12)
") Exercise 0 - Open and Run a Virtual Instrument (Slide 12) Examine the Signal Generation and Processing VI and run it. Change the frequencies and types of the input signals and notice how the display on
Exercise 0 - Open and Run a Virtual Instrument (Slide 12) Examine the Signal Generation and Processing VI and run it. Change the frequencies and types of the input signals and notice how the display on
Certified LabVIEW Associate Developer Exam. Test Booklet
 Certified LabVIEW Associate Developer Exam Test Booklet Note: The use of the computer or any reference materials is NOT allowed during the exam. Instructions: If you did not receive this exam in a sealed
Certified LabVIEW Associate Developer Examination
 Certified LabVIEW Associate Developer Examination Examinee Date: Administrator Date: Note: The use of the computer or any reference materials is NOT allowed during the exam. Instructions: If you did not
Introduction to LabVIEW TM
 Introduction to LabVIEW TM Three-Hour Course Course Software Version X.X September 2003 Edition Part Number 323668B-01 Copyright 2003 National Instruments Corporation. All rights reserved. Universities,
Concept: Debugging. Goal. Description. Implementation. Use the debugging tools built into LabVIEW.
 Goal Description Implementation Use the debugging tools built into LabVIEW. Complete the following steps to load a broken VI and correct the errors. Use single-stepping and execution highlighting to step
Read Temperature Data
 Read Temperature Data Exercise 5 Completed front panel and block diagram In this exercise, you will create a program using SensorDAQ s Analog Express VI to collect temperature data and display it on a
OpenStax-CNX module: m Thermometer VI * National Instruments
 OpenStax-CNX module: m12209 1 Thermometer VI * National Instruments This work is produced by OpenStax-CNX and licensed under the Creative Commons Attribution License 1.0 Exercise 1 Complete the following
Learn the three palettes. Learn how data is passed in LabVIEW. Create a subvi using two different methods.
 UNM The LabVIEW Programming Environment and Basic Operations Introduction In this hands-on, you will learn about the LabVIEW programming environment. You will also write a simple Virtual Instrument (VI)
Table 1. Inputs and Outputs
 Goal Description Use a While Loop and an iteration terminal and pass data through a tunnel. Create a VI that continuously generates random numbers between 0 and 1000 until it generates a number that matches
Introduction to LabVIEW
 Introduction to LabVIEW 3-Hour Hands-On Copyright 2005 National Instruments Corporation. All rights reserved. Under the copyright laws, this publication may not be reproduced or transmitted in any form,
Introduction to LabVIEW
 Introduction to LabVIEW 1 Introduction 1.1 Aims The following material is a short introduction to LabVIEW and it aims for you to: familiarise with the LabVIEW programming environment including front panel
Dept. of Electrical, Computer and Biomedical Engineering. Data Acquisition Systems and the NI LabVIEW environment
 Dept. of Electrical, Computer and Biomedical Engineering Data Acquisition Systems and the NI LabVIEW environment Data Acquisition (DAQ) Use of some data acquisition technique can be convenient, when not
Small rectangles (and sometimes squares like this
 Lab exercise 1: Introduction to LabView LabView is software for the real time acquisition, processing and visualization of measured data. A LabView program is called a Virtual Instrument (VI) because it,
PHYC 500: Introduction to LabView. Exercise 1 (v 1.3) M.P. Hasselbeck, University of New Mexico
 M.P. Hasselbeck, University of New Mexico") PHYC 500: Introduction to LabView M.P. Hasselbeck, University of New Mexico Exercise 1 (v 1.3) Setup The user interface of LabView is highly customizable. How this is done is a personal preference. For
PHYC 500: Introduction to LabView M.P. Hasselbeck, University of New Mexico Exercise 1 (v 1.3) Setup The user interface of LabView is highly customizable. How this is done is a personal preference. For
LabVIEW Express VI Development Toolkit User Guide
 LabVIEW Express VI Development Toolkit User Guide Version 1.0 Contents The LabVIEW Express VI Development Toolkit allows you to create and edit Express VIs, which you can distribute to users for building
ME 365 EXPERIMENT 3 INTRODUCTION TO LABVIEW
 ME 365 EXPERIMENT 3 INTRODUCTION TO LABVIEW Objectives: The goal of this exercise is to introduce the Laboratory Virtual Instrument Engineering Workbench, or LabVIEW software. LabVIEW is the primary software
ME 224: EXPERIMENTAL ENGINEERING. Lecture 2
 ME 224: EXPERIMENTAL ENGINEERING Class: M 1:00-1:50 TECH: L170 Labs: T and Th 2:00-4:50 PM Ford Building : B100 Lecture 2 1 Introduction to Labview Labview (Laboratory Virtual Instruments Engineering Workbench)
Status Bar: Right click on the Status Bar to add or remove features.
 Excel 2013 Quick Start Guide The Excel Window File Tab: Click to access actions like Print, Save As, etc. Also to set Excel options. Ribbon: Logically organizes actions onto Tabs, Groups, and Buttons to
Training material. Introduction to LabVIEW
 Training material Introduction to LabVIEW Content: A. LabVIEW Graphical Programming Environment B. Purpose for Studying LabVIEW C. LabVIEW Basics D. Debugging Techniques E. Application Building for Boyle-Mariotte
PARTS OF A WORKSHEET. Rows Run horizontally across a worksheet and are labeled with numbers.
 1 BEGINNING EXCEL While its primary function is to be a number cruncher, Excel is a versatile program that is used in a variety of ways. Because it easily organizes, manages, and displays information,
Getting Started with LabVIEW Virtual Instruments
 Getting Started with LabVIEW Virtual Instruments Approximate Time You can complete this exercise in approximately 30 minutes. Background LabVIEW programs are called virtual instruments, or VIs, because
Originally released in 1986, LabVIEW (short for Laboratory Virtual Instrumentation
 Introduction to LabVIEW 2011 by Michael Lekon & Janusz Zalewski Originally released in 1986, LabVIEW (short for Laboratory Virtual Instrumentation Engineering Workbench) is a visual programming environment
ni.com Preparing for the CLAD Exam
 Preparing for the CLAD Exam Breaking Data Flow Situation: Run 2 Loops simultaneously with 1 Stop Button Wiring the Stop Button from one Loop to the other will NOT work. Solution: Use a Local Variable Drawbacks:
Learn LabVIEW 2010 / 2011 Fast
 Learn LabVIEW 2010 / 2011 Fast A Primer for Automatic Data Acquisition Douglas Stamps, Ph.D. SDC PUBLICATIONS Schroff Development Corporation Better Textbooks. Lower Prices. www.sdcpublications.com Visit
Today. 4/5/11 Physics 262 Lecture 10 Questions about Exams Homework. Lab: Continue project. Lecture. Review your exams and review practice exam again.
 Today 4/5/11 Physics 262 Lecture 10 Questions about Exams Homework Review your exams and review practice exam again. Lab: Continue project Do pre-lab before lab. See last weeks handout. Requires use of
BE/EE189 Design and Construction of Biodevices Lecture 2. BE/EE189 Design and Construction of Biodevices - Caltech
 BE/EE189 Design and Construction of Biodevices Lecture 2 LabVIEW Programming More Basics, Structures, Data Types, VI Case structure Debugging techniques Useful shortcuts Data types in labview Concept of
LabVIEW basics. BME MIT János Hainzmann, Károly Molnár, Balázs Scherer, Csaba Tóth
 BME MIT 2007. János Hainzmann, Károly Molnár, Balázs Scherer, Csaba Tóth Table of contents REFERENCES...1 1. INTRODUCTION...2 1.1 VIRTUAL INSTRUMENTATION...2 1.2 VISUAL PROGRAMMING...2 2. GETTING STARTED...4
Introduction to LabVIEW. By Finn Haugen, TechTeach
 1 of 100 03/07/2012 02:31 PM Introduction to LabVIEW 8.5 by Finn Haugen 31. August 2008 Contents: 1 Preface 2 Introduction 3 Launching LabVIEW 3.1 License Activation 3.2 Starting using LabVIEW 4 Looking
CLAD Sample Exam 04. B. When you create an Array constant on the Block Diagram, it is not visible on the Front Panel.
 Name: Date: CLAD Sample Exam 04 1. What VI is typically used to terminate an Error Cluster wire and to display any error message? A. Merge Errors B. One Button Dialog / Two Button Dialog C. Generate Front
CLAD_80.questions.
 CLAD_80.questions Number: CLAD Passing Score: 800 Time Limit: 120 min File Version: 25.06 These are the most accurate study questions. Just focus on these and sit in your exam. I am very happy with my
ECE 202 LAB 1 INTRODUCTION TO LABVIEW
 Version 1.2 Page 1 of 16 BEFORE YOU BEGIN EXPECTED KNOWLEDGE ECE 202 LAB 1 INTRODUCTION TO LABVIEW You should be familiar with the basics of programming, as introduced by courses such as CS 161. PREREQUISITE
Certified LabVIEW Associate Developer Exam. Test Booklet
 Certified LabVIEW Associate Developer Exam Test Booklet Instructions: If you did not receive this exam in a sealed envelope stamped "NI Certification," DO NOT ACCEPT this exam. Return it to the proctor
Computer Interfacing Using LabView
 Computer Interfacing Using LabView Physics 258 Last revised September 25, 2005 by Ed Eyler Purpose: Note: To write a simple LabView program that digitizes data using an ADC on a data acquisition card,
Introduction to National Instruments LabVIEW and Data Acquisition (DAQ)
") Introduction to National Instruments LabVIEW and Data Acquisition (DAQ) Danial J. Neebel, Joseph R. Blandino, and David J. Lawrence, College of Integrated Science and Technology James Madison University
Introduction to National Instruments LabVIEW and Data Acquisition (DAQ) Danial J. Neebel, Joseph R. Blandino, and David J. Lawrence, College of Integrated Science and Technology James Madison University
LabVIEW TM Basics I Introduction Course Manual
 LabVIEW TM Basics I Introduction Course Manual Course Software Version 7.0 June 2003 Edition Part Number 320628L-01 LabVIEW Introduction Course Manual Copyright 1993 2003 National Instruments Corporation.
Engineering Innovation Center LabVIEW Basics
 Engineering Innovation Center LabVIEW Basics LabVIEW LabVIEW (Laboratory Virtual Instrument Engineering Workbench) is a graphical programming language that uses icons instead of lines of text to create
PHYC 500: Introduction to LabView. Exercise 8 (v 1.3) M.P. Hasselbeck, University of New Mexico. Arrays, XY Graphs, Disk I/O
 M.P. Hasselbeck, University of New Mexico. Arrays, XY Graphs, Disk I/O") PHYC 500: Introduction to LabView M.P. Hasselbeck, University of New Mexico Exercise 8 (v 1.3) Arrays, XY Graphs, Disk I/O Place two numeric controls (label them Number of points and Offset ) on the Front
PHYC 500: Introduction to LabView M.P. Hasselbeck, University of New Mexico Exercise 8 (v 1.3) Arrays, XY Graphs, Disk I/O Place two numeric controls (label them Number of points and Offset ) on the Front
LabVIEW programming I
 FYS3240 PC-based instrumentation and microcontrollers LabVIEW programming I LabVIEW basics Spring 2011 Lecture #2 Bekkeng 13.1.2011 Virtual Instruments LabVIEW programs are called virtual instruments,
ECE 463 Lab 1: Introduction to LabVIEW
 ECE 463 Lab 1: Introduction to LabVIEW 1. Introduction The purpose of the lab session of ECE463 is to apply/practice the digital communication theory on software-defined radios (USRPs). USRP is coupled
Microsoft PowerPoint 2007 Beginning
 Microsoft PowerPoint 2007 Beginning Educational Technology Center PowerPoint Presentations on the Web... 2 Starting PowerPoint... 2 Opening a Presentation... 2 Microsoft Office Button... 3 Quick Access
Arrays. Collection of data elements that are of same type
 Arrays Collection of data elements that are of same type 31 One or more dimensions, up to 2 elements per dimension Elements accessed by their index First element is index 0 index 10-element array 0 1 2
Experiment 1: Introduction to Labview 8.0 (tbc 1/7/2007, 1/13/2009,1/13/2011)
") Experiment 1: Introduction to Labview 8.0 (tbc 1/7/2007, 1/13/2009,1/13/2011) Objective: To learn how to build virtual instrument panels in Labview 8.0 Tasks: 1. Build the Labview VI shown in the tutorial
Experiment 1: Introduction to Labview 8.0 (tbc 1/7/2007, 1/13/2009,1/13/2011) Objective: To learn how to build virtual instrument panels in Labview 8.0 Tasks: 1. Build the Labview VI shown in the tutorial
Labview. Masood Ejaz
 Labview A Tutorial By Masood Ejaz Note: This tutorial is a work in progress and written specially for CET 3464 Software Applications in Engineering Technology, a course offered as part of BSECET program
CLAD Study Guide. Prepared by LabVIEW Student Ambassadors: Julian Ferrer-Rios Kristen Heck Francesca Ramadori Kelvin Tang
 CLAD Study Guide Prepared by LabVIEW Student Ambassadors: Julian Ferrer-Rios Kristen Heck Francesca Ramadori Kelvin Tang Table of Contents Section 1: LabVIEW Programming Concepts...2 Section 2: LabVIEW
Session 7 MS Word. Graphics. Inserting Clipart, and Graphics Modify graphics Position graphics
 Session 7 MS Word Graphics Inserting Clipart, and Graphics Modify graphics Position graphics Table of Contents Session 7 Working with Graphics... 1 The Toolbar... 1 Drawing Toolbar... 1 Picture Toolbar...
WELCOME TO LabVIEW 1
 WELCOME TO LabVIEW 1 ELECTRICAL ENGINEERING 20N Department of Electrical Engineering and Computer Sciences University of California, Berkeley SIMON HONG, HSIN-I LIU, JONATHAN KOTKER, AND BABAK AYAZIFAR
CLAD Sample Exam 06. B. Panel Resize. C. Panel Close? D. Value Change
 Name: Date: CLAD Sample Exam 06 1. Which of the following user interface events will allow your code to respond before LabVIEW performs the default action associated with that event? A. Mouse Down B. Panel
Shift Register: Exercise # 1: Shift Register Example VI. 1. Build the following front panel. Figure (8.1): Shift register exercise front panel
: Shift register exercise front panel") Experiment # 8: Shift Register and arrays Shift Register: Use shift register on for loops and while loops to transfer values from one loop to the next, create a shift register by right clicking the left
Experiment # 8: Shift Register and arrays Shift Register: Use shift register on for loops and while loops to transfer values from one loop to the next, create a shift register by right clicking the left
LabVIEW programming I
 FYS3240 PC-based instrumentation and microcontrollers LabVIEW programming I LabVIEW basics Spring 2017 Lecture #2 Bekkeng 16.01.2017 What is LabVIEW LabVIEW is a graphical programming environment G programming
Homework Assignment 9 LabVIEW tutorial
 Homework Assignment 9 LabVIEW tutorial Due date: Wednesday, December 8 (midnight) For this homework assignment, you will complete a tutorial on the LabVIEW data acquistion software. This can be done on
Budget Exercise for Intermediate Excel
 Budget Exercise for Intermediate Excel Follow the directions below to create a 12 month budget exercise. Read through each individual direction before performing it, like you are following recipe instructions.
WEEK NO. 12 MICROSOFT EXCEL 2007
 WEEK NO. 12 MICROSOFT EXCEL 2007 LESSONS OVERVIEW: GOODBYE CALCULATORS, HELLO SPREADSHEET! 1. The Excel Environment 2. Starting A Workbook 3. Modifying Columns, Rows, & Cells 4. Working with Worksheets
Basic Concepts. Launching MultiAd Creator. To Create an Alias. file://c:\documents and Settings\Gary Horrie\Local Settings\Temp\~hh81F9.
 Page 1 of 71 This section describes several common tasks that you'll need to know in order to use Creator successfully. Examples include launching Creator and opening, saving and closing Creator documents.
Using Graphics. Digital Camera. Auto Shapes
 AutoShape Using Graphics Internet The following graphic elements are available to enhance your presentation Clip Art AutoShapes Fill effects Shadow effects 3D effects Digital Camera WordArt Digital Camera
Basic Data Acquisition with LabVIEW
 Basic Data Acquisition with LabVIEW INTRODUCTION This tutorial introduces the creation of LabView Virtual Instruments (VI s), in several individual lessons. These lessons create a simple sine wave signal,
Analytical Instrumentation
 Analytical Instrumentation A graduate course ( Chem9532a/b) Dr. Zhifeng Ding Department of Chemistry The University of Western Ontario (519) 661-2111 Ext. 86161 e-mail: zfding@uwo.ca Log in: Femlab feml@b09
CISE 318: Computer Control Systems Laboratory Exercises
 King Fahd University of Petroleum and Minerals Systems Engineering Department CISE 318: Computer Control Systems Laboratory Exercises Prepared by Dr. Lahouari Cheded Mr. Mohammad Shahab Mr Ameenuddin Hussain
Tutorial: Getting Started with the LabVIEW Simulation Module
 Tutorial: Getting Started with the LabVIEW Simulation Module - LabVIEW 8.5 Simulati... Page 1 of 10 Cart Help Search You are here: NI Home > Support > Product Reference > Manuals > LabVIEW 8.5 Simulation
Word 2013 Quick Start Guide
 Getting Started File Tab: Click to access actions like Print, Save As, and Word Options. Ribbon: Logically organize actions onto Tabs, Groups, and Buttons to facilitate finding commands. Active Document
Analytical Instrumentation
 Analytical Instrumentation Log in: Femlab feml@b09 A graduate course ( Chem9532a/b) Dr. Zhifeng Ding Department of Chemistry The University of Western Ontario (519) 661-2111 Ext. 86161 e-mail: zfding@uwo.ca
INFORMATION TECHNOLOGY
 INFORMATION TECHNOLOGY PowerPoint Presentation Section Two: Formatting, Editing & Printing Section Two: Formatting, Editing & Printing By the end of this section you will be able to: Insert, Edit and Delete
Faculty of Computing, Engineering and Technology. Real Time Systems 1 CE LabVIEW David D. Hodgkiss & Staffordshire University 1
 Faculty of Computing, Engineering and Technology Real Time Systems 1 CE00345-3 TM LabVIEW 8 2006 David D. Hodgkiss & Staffordshire University 1 Table of Contents Chapter 1 - Introduction. Introduction.
2 Lab 2: LabVIEW and Control System Building Blocks
 2 Lab 2: LabVIEW and Control System Building Blocks 2.1 Introduction Controllers are built from mechanical or electrical building blocks. Most controllers are implemented in a program using sensors to
The Mathcad Workspace 7
 For information on system requirements and how to install Mathcad on your computer, refer to Chapter 1, Welcome to Mathcad. When you start Mathcad, you ll see a window like that shown in Figure 2-1. By
Microsoft How to Series
 Microsoft How to Series Getting Started with EXCEL 2007 A B C D E F Tabs Introduction to the Excel 2007 Interface The Excel 2007 Interface is comprised of several elements, with four main parts: Office
Beginner s Guide to Microsoft Excel 2002
 Beginner s Guide to Microsoft Excel 2002 Microsoft Excel lets you create spreadsheets, which allow you to make budgets, track inventories, calculate profits, and design charts and graphs. 1. Open Start
Part 1. Creating an Array of Controls or Indicators
 NAME EET 2259 Lab 9 Arrays OBJECTIVES -Write LabVIEW programs using arrays. Part 1. Creating an Array of Controls or Indicators Here are the steps you follow to create an array of indicators or controls
Microsoft Office. Microsoft Office
 is an office suite of interrelated desktop applications, servers and services for the Microsoft Windows. It is a horizontal market software that is used in a wide range of industries. was introduced by
PowerPoint X. 1. The Project Gallery window with the PowerPoint presentation icon already selected. 2. Click on OK.
 PowerPoint X Launching PowerPointX 1. Start PowerPointX by clicking on the PowerPoint icon in the dock or finding it in the hard drive in the Applications folder under Microsoft PowerPoint. PowerPoint
Quiz 1PPT Study Guide
 Quiz 1PPT Study Guide Multiple Choice Identify the choice that best completes the statement or answers the question. 1. PowerPoint can best be described as a program. a. flowcharting c. presentation graphics
LabVIEW Basics. Based on LabVIEW 2011 Student Edition
 LabVIEW Basics Based on LabVIEW 2011 Student Edition Virtual instruments LabVIEW works on a data flow model in which information within a LabVIEW program, called a virtual instrument (VI), flows from data
INTRODUCTION TO LABVIEW
 INTRODUCTION TO LABVIEW 2nd Year Microprocessors Laboratory 2012-2013 INTRODUCTION For the first afternoon in the lab you will learn to program using LabVIEW. This handout is designed to give you an introduction
Microsoft PowerPoint 2013 Beginning
 Microsoft PowerPoint 2013 Beginning PowerPoint Presentations on the Web... 2 Starting PowerPoint... 2 Opening a Presentation... 2 File Tab... 3 Quick Access Toolbar... 3 The Ribbon... 4 Keyboard Shortcuts...
Microsoft. An Introduction
 Microsoft Amarillo College Revision Date: February 7, 2011 Table of Contents SLIDE MASTER... 2 ACCESSING THE SLIDE MASTER... 2 BACKGROUNDS... 2 FONT COLOR OF SLIDE TITLES... 3 FONT COLOR OF BULLET LEVELS...
ENGR 1000, Introduction to Engineering Design
 ENGR 1000, Introduction to Engineering Design Unit 2: Data Acquisition and Control Technology Lesson 2.1: Programming Line Outputs for the NI USB-6008 in LabVIEW Hardware: 12 VDC power supply Several lengths
Microsoft Excel 2013: Excel Basics June 2014
 Microsoft Excel 2013: Excel Basics June 2014 Description Excel is a powerful spreadsheet program. Please note that in this class we will use Excel 2010 or 2013. Learn how to create spreadsheets, enter
LabVIEW VI Analyzer Toolkit
 USER GUIDE LabVIEW VI Analyzer Toolkit Version 1.1 Contents The LabVIEW VI Analyzer Toolkit allows you to interactively and programmatically test VIs to find areas of improvement. The toolkit contains
LABVIEW HANDOUT 3 CHAPTER 3: THE MATHSCRIPT NODE AND XY GRAPH
 LABVIEW HANDOUT 3 CHAPTER 3: THE MATHSCRIPT NODE AND XY GRAPH In this exercise, you will be introduced to the MathScript Node and the XY Graph. The MathScript Node structure uses syntax that is very similar
PowerPoint 2016 Building a Presentation
 PowerPoint 2016 Building a Presentation What is PowerPoint? PowerPoint is presentation software that helps users quickly and efficiently create dynamic, professional-looking presentations through the use