Intel VTune Amplifier XE
|
|
|
- Christal Moore
- 6 years ago
- Views:
Transcription
1 Intel VTune Amplifier XE Vladimir Tsymbal Performance, Analysis and Threading Lab 1
2 Agenda Intel VTune Amplifier XE Overview Features Data collectors Analysis types Key Concepts Collecting performance data in cluster environment 2


3 Intel Cluster Studio XE Phase Product Feature Benefit Intel MPI Library High Performance Message Passing (MPI) Library Enabling High Performance Scalability, Interconnect Independence, Runtime Fabric Selection, and Application Tuning Capability Build Intel Composer XE C/C++ and Fortran compilers and performance libraries Intel Threading Building Blocks Intel Cilk Plus Intel Integrated Performance Primitives Intel Math Kernel Library Enabling solution to achieve the application performance and scalability benefits of multicore and forward scale to many-core Verify Intel Inspector XE Memory & threading dynamic analysis for code quality Static Security Analysis for code quality Increased productivity, code quality, and lowers cost, finds memory, threading, and security defects before they happen Now MPI enabled at every cluster node Verify & Tune Intel Trace Analyzer & Collector MPI Performance Profiler for understanding application correctness & behavior Analyze performance of MPI programs and visualize parallel application behavior and communications patterns to identify hotspots 3 Tune Intel VTune Amplifier XE Performance Profiler for optimizing application performance and scalability Remove guesswork, saves time, makes it easier to find performance and scalability bottlenecks Now MPI enabled at every cluster node


4 Where is my application Intel VTune Amplifier XE Performance Profiler Spending Time? Wasting Time? Waiting Too Long? Focus tuning on functions taking time See call stacks See time on source See cache misses on your source See functions sorted by # of cache misses See locks by wait time Red/Green for CPU utilization during wait Windows & Linux Low overhead No special recompiles Advanced Profiling For Scalable Multicore Performance 4

5 Intel VTune Amplifier XE Tune Applications for Performance Fast, Accurate Performance Profiles Hotspot (Statistical call tree) Hardware-Event Based Sampling (EBS) Thread Profiling Visualize thread interactions on timeline Balance workloads Easy set-up Pre-defined performance profiles Use a normal production build Compatible Microsoft, GCC, Intel compilers C/C++, Fortran, Assembly, C#,.NET Latest Intel processors and compatible processors 1 Find Answers Fast Filter extraneous data View results on the source / assembly Event multiplexing Windows or Linux Visual Studio Integration (Windows) Standalone user i/f and command line 32 and 64-bit 1 IA32 and Intel 64 architectures. Many features work with compatible processors. Event based sampling requires a genuine Intel Processor. 5


6 Intel VTune Amplifier XE Powerful EBS Made Easier System Wide Event Based Sampling (EBS) uses the on chip PMU to count performance events like cache misses, clock ticks and instructions retired. Predefined EBS Profiles Easy EBS setup for newer processors. No memorizing complex event names. Profiles vary by microarchitecture. (Full custom profiles also available) Opportunities Highlighted General Exploration turns the cell pink when it suspects a tuning opportunity is present. Hover gives suggestions. Pinpoint tuning opportunities See opportunities like cache misses. View results on the timeline, in the grid view or on your source. Every Intel Processor has an on chip Performance Monitoring Unit (PMU). 6
7 High-level Features 7
8 VTune Amplifier XE High-level Features Hardware Event-based sampling (EBS) Allows micro-architectural tuning Improved usability Hotspot analysis (Software sampling) Provides the time consuming regions of your application Provides associated call-stacks that let you know how you got to these time consuming regions Call-tree built using these call stacks Concurrency and Lock& Waits Analysis (Thread Profiling) Visualize thread activity and lock transitions in the timeline Provides lock profiling capability Shows CPU/Core utilization and concurrency information 8
9 VTune Amplifier XE High-level Features Attach to running processes Hotspot and Concurrency analysis modes can attach to running processes System wide data collection GUI EBS modes allows system wide data collection and the tool provides the ability to filter this data Standalone GUI available on Windows* and Linux Microsoft* Visual Studio integration Command line support Comprehensive support for regression analysis and remote collection Platform & application support Windows* and Linux Microsoft* C# applications 9
10 VTune Amplifier XE Improved data collection and visualization Timeline correlation of thread and event data Populates thread active time with event data collected for that thread Ability to filter regions on the timeline Advanced source and assembly views See event data graphed in the source/assembly display Visualize and analyze assembly as basic blocks Provides pre-defined tuning experiments 10
11 Data Collectors and Analysis Types 11
12 VTune Amplifier XE Data Collectors Collectors come in two flavors Event based sampling (EBS) User mode sampling (Software sampling) Thread profiling and stack sampling collector Uses Pin based dynamic instrumentation technology Application recompilation not necessary Provides call-stacks with each sample Statistical Call-tree constructed from call stacks 12
13 VTune Amplifier XE Analysis types Software sampling based analysis types: Hotspots Concurrency Locks and Waits Hardware EBS based analysis types: Lightweight hotspots (pre-defined) Advanced Hardware-level analysis (pre-defined) Intel Core i7 processor family Intel Xeon processor family Supports custom analysis types Can be based on existing profiles 13

 Architecture analysis types 2 nd Generation Core Architecture (a.k.")
14 VTune Amplifier XE Pre-defined Analysis Types Lightweight Hotspot analysis based on the underlying architecture User mode stack sampling Threading, IO, Signaling API instrumentation Core 2 Architecture Analysis types Core i7 (a.k.a Nehalem) Architecture analysis types 2 nd Generation Core Architecture (a.k.a SandyBridge) analysis types 14
15 GUI Layout 15


16 Different ways to start the analysis All available analysis types Helps creating new analysis types 16 Copy the commandline to clipboard


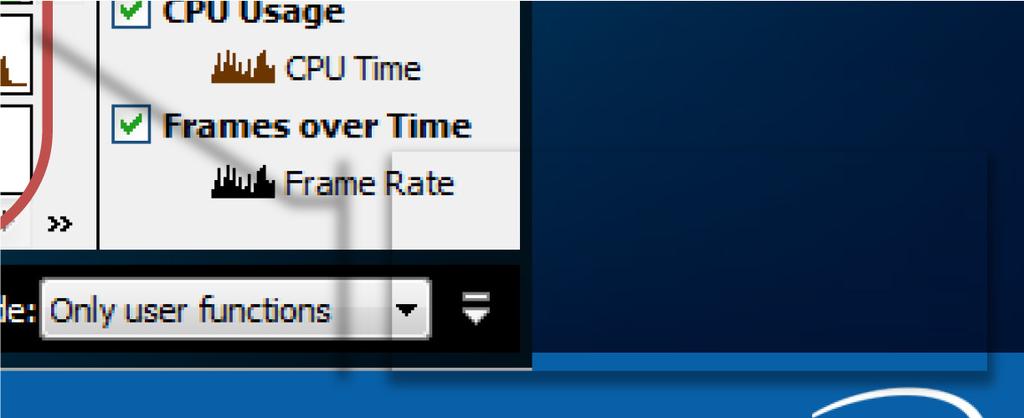

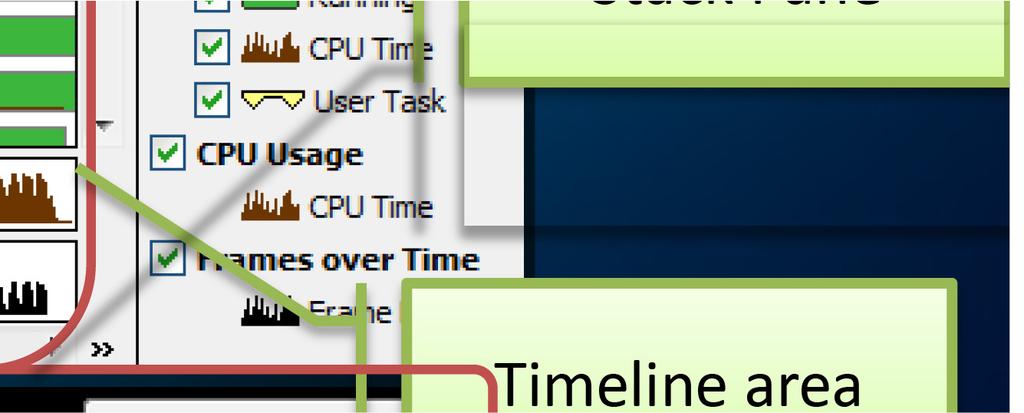


17 VTune Amplifier XE GUI Layout Menu and Tool bars Analysis Type Viewpoint currently being used Tabs within each result Current grouping Grid area Stack Pane Filter area Timeline area 17
18 VTune Amplifier XE GUI Layout Clicking on the Summary tab shows a high level summary of the run 18


19 VTune Amplifier XE GUI Layout Top down tree shows the statistical callgraph built from the samples 19
20 Key Result Analysis and GUI Concepts 20


21 VTune Amplifier XE Key Concepts Viewpoints Example of an analysis type having multiple viewpoints 21


22 VTune Amplifier XE Key Concepts Groupings Each analysis type has many viewpoints Each viewpoint has pre-defined groupings Allows you to analyze the data in different hierarchies and granularities 22


23 VTune Amplifier XE Key Concepts For example, pre-defined groupings can be used to determine load imbalance 23
24 VTune Amplifier XE Key Concepts VTune Amplifier XE allows comparison of two similar runs Extremely useful for Benchmarking Regression analysis Testing 24


25 VTune Amplifier XE Key Concepts 25
26 Demo/Lab Activities Analysis Types Revisited 26

27 Analysis Types Hotspots For each sample, capture execution context, time passed since previous sample and thread CPU time Allows time spent in system calls to be attributed to user functions making the call Provides additional knobs: Collect accurate CPU information requires Administrator privileges and uses ETW data to determine context switches Timeline does not reflect CS If Thread Concurrency is selected for coloring CPU time, then Pin Probes is used to capture wait data (slightly higher overhead) The defaults for Hotspot analysis are configurable and can be done so by creating a custom analysis type inherited from Hotspots 27
28 VTune Amplifier XE Terminology used CPU Time The amount of time a thread spends executing on a logical processor For multi-threaded applications, the CPU time is aggregated over all threads for the given level of granularity Wait Time The amount of time that a given thread waited for some event to occur, such as: synchronization waits and I/O waits 28


29 VTune Amplifier XE Terminology used Thread1 Waiting Thread1 Thread2 Waiting Thread2 Thread3 Waiting Thread3 Thread running 1sec 1sec 1sec 1sec 1sec 1sec Thread waiting Elapsed Time: 6 seconds CPU Time: T1 (4s) + T2 (2s) + T3 (2s) = 8 seconds Wait Time: T1(2s) + T2(3s) + T3 (2s) = 7 seconds 29

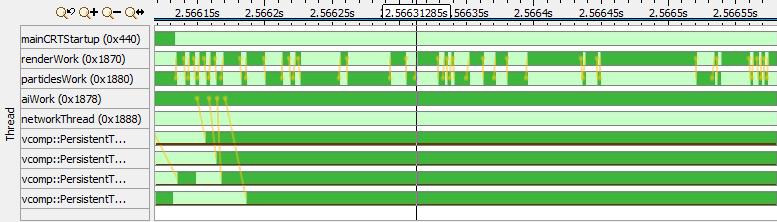
30 Hotspots analysis Function CPU time Function hotspot Call stack Thread timeline 30

31 Hotspots analysis Source View 31
32 Before starting demo/lab activities let s quickly check how to use VTune Amplifier XE 32
33 Creating a New Project Project management support provided is minimal Allows users to create new projects Each project is defined by an executable of interest (or system wide for EBS) Associated command line arguments that describe the workload, if applicable 33

34 Steps for creating a new Project Select the New Project menu attribute This opens a dialog window for you to create a new project directory Browse to the directory under which you choose to place the new project Give a name for the project in the Project Directory field Press the Create Project button 34

35 Associating an Application and Workload to the Project Select the application Specify the command line arguments Select the working directory, if different from the parent directory of the application binary Select the Ok button 35

36 Advanced Project Configuration At the bottom of the project Properties dialog, other knobs are provided User can specify if child process have to followed and analyzed In the case of EBS, checking the Allow multiple runs will disable event multiplexing There is also a data collection limit, which defaults to 100MB 36
37 Lab 1 Finding Hotspots
 I/O functions are instrumented (e.g. ReadFile, socket) Has the ability to also display utilization based on CPU Usage Has newer metrics such as overhead and spin time 38")
38 Intel VTune Amplifier XE Concurrency Analysis For Concurrency analysis, Stack sampling is done just like in Hotspots analysis type Wait functions are instrumented (e.g. WaitForSingleObject, EnterCriticalSection) Signal functions are instrumented (e.g. SetEvent, LeaveCriticalSection) I/O functions are instrumented (e.g. ReadFile, socket) Has the ability to also display utilization based on CPU Usage Has newer metrics such as overhead and spin time 38

39 Intel VTune Amplifier XE Parallelism/Concurrency Analysis 39


40 VTune Amplifier XE Terminology used Concurrency Is a measurement of the number of active threads Thread running Thread 1 Thread waiting Waiting Thread1 Thread 2 Waiting Thread3 1sec Threads running 40 1 Thread2 Thread 3 Waiting 1sec 1sec 1sec 1sec 1sec Concurren cy Summary

41 Sample Concurrency View 41
42 Lab 2 Analyzing Concurrency Issues
43 Analysis Types Lock and Waits Shows how an application is utilizing available CPU cores Helps identify the cause of ineffective utilization, threads waiting too long on synchronization objects (locks), I/O related issues Timers while CPU cores are underutilized Overheads are higher than Hotspots analysis type 43
 during the wait Consider adding parallelism, rebalancing, or reducing contention Ideal utilization (green bars) occurs when the number of running threads equals the number")
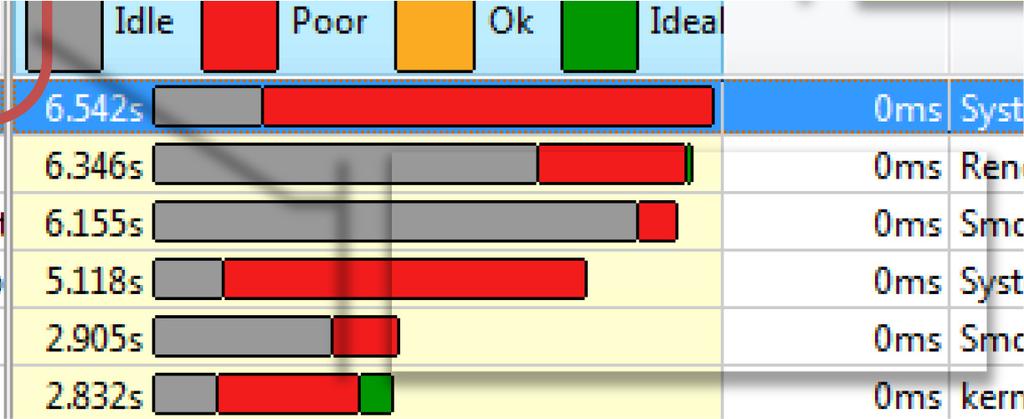
44 Analysis Types Lock and Waits Identify the objects that caused contention and go to the source code to fix the problem Concentrate your tuning on objects with long Wait time where the system is poorly utilized (red bars) during the wait Consider adding parallelism, rebalancing, or reducing contention Ideal utilization (green bars) occurs when the number of running threads equals the number of available cores 44
45 Lab 3 Locks and Waits Analysis

46 VTune Amplifier XE Pre-defined Analysis Types Lightweight Hotspot analysis based on the underlying architecture User mode stack sampling Threading, IO, Signaling API instrumentation 46
47 Analysis Types Lightweight Hotspots New for Amplifier XE Similar to Hotspot Analysis Sampling is performed with the SEP collector Driver is required Stack walking is not performed Only hotspots are reported Samples are taken more frequently, but may have less accurate timing information Analysis may be performed for a single application or for the entire system 47
48 Lightweight Hotspots vs. Hotspots Lightweight Hotspots Uses Hardware EBS Lower overhead System wide profiling Faster finalization Requires a driver/privileged mode Hotspots Uses software sampling collector Stackwalk is done post process, hence slower finalization times Provides stack information and a statistical call graph 48

49 Lightweight Hotspots 49
50 Lab 4 Lightweight Hotspots
 Command Line Interface use")


51 Intel VTune Amplifier XE Command Line Interface (CLI) Command Line Interface use cases: Test code changes for performance regressions Automate execution of performance analyses Command Line Interface features: Fine-grained control of all analysis types and options Text-based analysis reports Analysis results can be opened in the graphical user interface 51
52 Intel VTune Amplifier XE Command Line Interface $ amplxe-cl -help Intel(R) VTune(TM) Amplifier Command Line Tool Copyright (C) Intel Corporation. All rights reserved. Usage: amplxe-cl <-action> [-action-option] [-global-option] [[--] target [target options]] To view the results in the IDE, double-click the <resultname>.amplxe file located in the result directory. Type amplxe-cl -help <action>' for help on a specific action. Available actions: collect collect-with command finalize help import report version 52
53 Intel VTune Amplifier XE Command Line Interface Examples Display a list of available analysis types and preset configuration levels amplxe-cl help collect Run Hot Spot analysis on target myapp and store result in default-named directory, such as r000hs amplxe-cl collect hotspots myapp Run the Parallelism analysis, store the result in directory r001par amplxe-cl -collect concurrency -result-dir r001par myapp 53
54 Intel VTune Amplifier XE Command Line Interface - reporting Examples Generate the 'hotspots' report for the result directory 'r000hs'. amplxe-cl -report hotspots -r r000hs Group the data by module. amplxe-cl -report hotspots -r r000hs -group-by module Filter the output. amplxe-cl -report hotspots -r r000hs -filter module=libexample.so Use '-help report <report name>' for more information about each report. Available reports callstacks Display CPU or wait time for callstacks. gprof-cc Display CPU or wait time in the gprof-like format. hotspots Display CPU time. hw-events Display hardware events. perf Display CPU or wait time for each module. perf-detail Display CPU time for each function or synchronization object. pmu-events sfdump Specialized report to display hardware events. summary Display data about overall performance. top-down Display a call tree for your target application and provide CPU and wait time for each function. wait-time Display wait time. 54
55 Summary VTune Amplifier XE is the coming together of distinct tools Correlation of the data from various capabilities makes it very powerful Supports EBS data collection with better usability Supports statistical call-graph capability Combines these two types of capabilities with powerful Thread Profiling capability VTune Amplifier XE provides a standalone GUI with the same look and feel on both Windows* and Linux Complete re-design to make it a very extensible tool 55
56 56
57 57
58 Legal Disclaimer INFORMATION IN THIS DOCUMENT IS PROVIDED AS IS. NO LICENSE, EXPRESS OR IMPLIED, BY ESTOPPEL OR OTHERWISE, TO ANY INTELLECTUAL PROPERTY RIGHTS IS GRANTED BY THIS DOCUMENT. INTEL ASSUMES NO LIABILITY WHATSOEVER AND INTEL DISCLAIMS ANY EXPRESS OR IMPLIED WARRANTY, RELATING TO THIS INFORMATION INCLUDING LIABILITY OR WARRANTIES RELATING TO FITNESS FOR A PARTICULAR PURPOSE, MERCHANTABILITY, OR INFRINGEMENT OF ANY PATENT, COPYRIGHT OR OTHER INTELLECTUAL PROPERTY RIGHT. Performance tests and ratings are measured using specific computer systems and/or components and reflect the approximate performance of Intel products as measured by those tests. Any difference in system hardware or software design or configuration may affect actual performance. Buyers should consult other sources of information to evaluate the performance of systems or components they are considering purchasing. For more information on performance tests and on the performance of Intel products, reference Intel and the Intel logo are trademarks of Intel Corporation in the U.S. and other countries. *Other names and brands may be claimed as the property of others. Copyright Intel Corporation. 58
Using Intel VTune Amplifier XE and Inspector XE in.net environment
 Using Intel VTune Amplifier XE and Inspector XE in.net environment Levent Akyil Technical Computing, Analyzers and Runtime Software and Services group 1 Refresher - Intel VTune Amplifier XE Intel Inspector
Revealing the performance aspects in your code
 Revealing the performance aspects in your code 1 Three corner stones of HPC The parallelism can be exploited at three levels: message passing, fork/join, SIMD Hyperthreading is not quite threading A popular
Using Intel VTune Amplifier XE for High Performance Computing
 Using Intel VTune Amplifier XE for High Performance Computing Vladimir Tsymbal Performance, Analysis and Threading Lab 1 The Majority of all HPC-Systems are Clusters Interconnect I/O I/O... I/O I/O Message
Microarchitectural Analysis with Intel VTune Amplifier XE
 Microarchitectural Analysis with Intel VTune Amplifier XE Michael Klemm Software & Services Group Developer Relations Division 1 Legal Disclaimer INFORMATION IN THIS DOCUMENT IS PROVIDED IN CONNECTION
Performance Analysis using Intel VTune Amplifier XE
 Performance Analysis using Intel VTune Amplifier XE Performance methodology profiling and tuning The Goal: minimize the time it takes your program / module / function to execute Identify Hotspots and focus
Intel VTune Amplifier XE Overview
 Intel VTune Amplifier XE Overview June 2011 1 Intel Parallel Studio XE 2011 Phase Productivity Tool Feature Benefit Advanced Build & Debug Intel Composer XE C/C++ and Fortran compilers, performance libraries,and
Agenda. Optimization Notice Copyright 2017, Intel Corporation. All rights reserved. *Other names and brands may be claimed as the property of others.
 Agenda VTune Amplifier XE OpenMP* Analysis: answering on customers questions about performance in the same language a program was written in Concepts, metrics and technology inside VTune Amplifier XE OpenMP
Performance Profiler. Klaus-Dieter Oertel Intel-SSG-DPD IT4I HPC Workshop, Ostrava,
 Performance Profiler Klaus-Dieter Oertel Intel-SSG-DPD IT4I HPC Workshop, Ostrava, 08-09-2016 Faster, Scalable Code, Faster Intel VTune Amplifier Performance Profiler Get Faster Code Faster With Accurate
Eliminate Threading Errors to Improve Program Stability
 Introduction This guide will illustrate how the thread checking capabilities in Intel Parallel Studio XE can be used to find crucial threading defects early in the development cycle. It provides detailed
Eliminate Threading Errors to Improve Program Stability
 Eliminate Threading Errors to Improve Program Stability This guide will illustrate how the thread checking capabilities in Parallel Studio can be used to find crucial threading defects early in the development
Intel VTune Amplifier XE. Dr. Michael Klemm Software and Services Group Developer Relations Division
 Intel VTune Amplifier XE Dr. Michael Klemm Software and Services Group Developer Relations Division Legal Disclaimer & Optimization Notice INFORMATION IN THIS DOCUMENT IS PROVIDED AS IS. NO LICENSE, EXPRESS
This guide will show you how to use Intel Inspector XE to identify and fix resource leak errors in your programs before they start causing problems.
 Introduction A resource leak refers to a type of resource consumption in which the program cannot release resources it has acquired. Typically the result of a bug, common resource issues, such as memory
Tutorial: Analyzing MPI Applications. Intel Trace Analyzer and Collector Intel VTune Amplifier XE
 Tutorial: Analyzing MPI Applications Intel Trace Analyzer and Collector Intel VTune Amplifier XE Contents Legal Information... 3 1. Overview... 4 1.1. Prerequisites... 5 1.1.1. Required Software... 5 1.1.2.
Simplified and Effective Serial and Parallel Performance Optimization
 HPC Code Modernization Workshop at LRZ Simplified and Effective Serial and Parallel Performance Optimization Performance tuning Using Intel VTune Performance Profiler Performance Tuning Methodology Goal:
Eliminate Memory Errors to Improve Program Stability
 Introduction INTEL PARALLEL STUDIO XE EVALUATION GUIDE This guide will illustrate how Intel Parallel Studio XE memory checking capabilities can find crucial memory defects early in the development cycle.
Tutorial: Finding Hotspots with Intel VTune Amplifier - Linux* Intel VTune Amplifier Legal Information
 Tutorial: Finding Hotspots with Intel VTune Amplifier - Linux* Intel VTune Amplifier Legal Information Tutorial: Finding Hotspots with Intel VTune Amplifier - Linux* Contents Legal Information... 3 Chapter
Intel Software Development Products Licensing & Programs Channel EMEA
 Intel Software Development Products Licensing & Programs Channel EMEA Intel Software Development Products Advanced Performance Distributed Performance Intel Software Development Products Foundation of
Eliminate Memory Errors to Improve Program Stability
 Eliminate Memory Errors to Improve Program Stability This guide will illustrate how Parallel Studio memory checking capabilities can find crucial memory defects early in the development cycle. It provides
Intel Parallel Amplifier Sample Code Guide
 The analyzes the performance of your application and provides information on the performance bottlenecks in your code. It enables you to focus your tuning efforts on the most critical sections of your
Intel Xeon Phi Coprocessor Performance Analysis
 Intel Xeon Phi Coprocessor Performance Analysis Legal Disclaimer INFORMATION IN THIS DOCUMENT IS PROVIDED IN CONNECTION WITH INTEL PRODUCTS. NO LICENSE, EXPRESS OR IMPLIED, BY ESTOPPEL OR OTHERWISE, TO
Bei Wang, Dmitry Prohorov and Carlos Rosales
 Bei Wang, Dmitry Prohorov and Carlos Rosales Aspects of Application Performance What are the Aspects of Performance Intel Hardware Features Omni-Path Architecture MCDRAM 3D XPoint Many-core Xeon Phi AVX-512
Efficiently Introduce Threading using Intel TBB
 Introduction This guide will illustrate how to efficiently introduce threading using Intel Threading Building Blocks (Intel TBB), part of Intel Parallel Studio XE. It is a widely used, award-winning C++
What's new in VTune Amplifier XE
 What's new in VTune Amplifier XE Naftaly Shalev Software and Services Group Developer Products Division 1 Agenda What s New? Using VTune Amplifier XE 2013 on Xeon Phi coprocessors New and Experimental
CERN IT Technical Forum
 Evaluating program correctness and performance with new software tools from Intel Andrzej Nowak, CERN openlab March 18 th 2011 CERN IT Technical Forum > An introduction to the new generation of software
Getting Started Tutorial: Finding Hotspots
 Getting Started Tutorial: Finding Hotspots Intel VTune Amplifier XE 2013 for Linux* OS Fortran Sample Application Code Document Number: 327359-001 Legal Information Contents Contents Legal Information...5
Intel Parallel Amplifier 2011
 THREADING AND PERFORMANCE PROFILER Intel Parallel Amplifier 2011 Product Brief Intel Parallel Amplifier 2011 Optimize Performance and Scalability Intel Parallel Amplifier 2011 makes it simple to quickly
Using Intel Inspector XE 2011 with Fortran Applications
 Using Intel Inspector XE 2011 with Fortran Applications Jackson Marusarz Intel Corporation Legal Disclaimer INFORMATION IN THIS DOCUMENT IS PROVIDED IN CONNECTION WITH INTEL PRODUCTS. NO LICENSE, EXPRESS
Graphics Performance Analyzer for Android
 Graphics Performance Analyzer for Android 1 What you will learn from this slide deck Detailed optimization workflow of Graphics Performance Analyzer Android* System Analysis Only Please see subsequent
Getting Started Tutorial: Finding Hotspots
 Getting Started Tutorial: Finding Hotspots Intel VTune Amplifier XE 2013 for Windows* OS Fortran Sample Application Code Document Number: 327358-001 Legal Information Contents Contents Legal Information...5
Memory & Thread Debugger
 Memory & Thread Debugger Here is What Will Be Covered Overview Memory/Thread analysis New Features Deep dive into debugger integrations Demo Call to action Intel Confidential 2 Analysis Tools for Diagnosis
Intel VTune Amplifier XE for Tuning of HPC Applications Intel Software Developer Conference Frankfurt, 2017 Klaus-Dieter Oertel, Intel
 Intel VTune Amplifier XE for Tuning of HPC Applications Intel Software Developer Conference Frankfurt, 2017 Klaus-Dieter Oertel, Intel Agenda Which performance analysis tool should I use first? Intel Application
Intel Parallel Amplifier
 Intel Parallel Amplifier Product Brief Intel Parallel Amplifier Optimize Performance and Scalability Intel Parallel Amplifier makes it simple to quickly find multicore performance bottlenecks without needing
Intel Advisor XE Future Release Threading Design & Prototyping Vectorization Assistant
 Intel Advisor XE Future Release Threading Design & Prototyping Vectorization Assistant Parallel is the Path Forward Intel Xeon and Intel Xeon Phi Product Families are both going parallel Intel Xeon processor
Getting Started Tutorial: Finding Hotspots
 Getting Started Tutorial: Finding Hotspots Intel VTune Amplifier XE 2013 for Linux* OS C++ Sample Application Code Document Number: 326705-002 Legal Information Contents Contents Legal Information...5
Profiling: Understand Your Application
 Profiling: Understand Your Application Michal Merta michal.merta@vsb.cz 1st of March 2018 Agenda Hardware events based sampling Some fundamental bottlenecks Overview of profiling tools perf tools Intel
Using the Intel VTune Amplifier 2013 on Embedded Platforms
 Using the Intel VTune Amplifier 2013 on Embedded Platforms Introduction This guide explains the usage of the Intel VTune Amplifier for performance and power analysis on embedded devices. Overview VTune
Vectorization Advisor: getting started
 Vectorization Advisor: getting started Before you analyze Run GUI or Command Line Set-up environment Linux: source /advixe-vars.sh Windows: \advixe-vars.bat Run GUI or Command
Installation Guide and Release Notes
 Intel C++ Studio XE 2013 for Windows* Installation Guide and Release Notes Document number: 323805-003US 26 June 2013 Table of Contents 1 Introduction... 1 1.1 What s New... 2 1.1.1 Changes since Intel
Jackson Marusarz Software Technical Consulting Engineer
 Jackson Marusarz Software Technical Consulting Engineer What Will Be Covered Overview Memory/Thread analysis New Features Deep dive into debugger integrations Demo Call to action 2 Analysis Tools for Diagnosis
Intel VTune Performance Analyzer 9.1 for Windows* In-Depth
 Intel VTune Performance Analyzer 9.1 for Windows* In-Depth Contents Deliver Faster Code...................................... 3 Optimize Multicore Performance...3 Highlights...............................................
Overview of Intel Parallel Studio XE
 Overview of Intel Parallel Studio XE Stephen Blair-Chappell 1 30-second pitch Intel Parallel Studio XE 2011 Advanced Application Performance What Is It? Suite of tools to develop high performing, robust
Intel Parallel Studio XE 2015 Composer Edition for Linux* Installation Guide and Release Notes
 Intel Parallel Studio XE 2015 Composer Edition for Linux* Installation Guide and Release Notes 23 October 2014 Table of Contents 1 Introduction... 1 1.1 Product Contents... 2 1.2 Intel Debugger (IDB) is
Intel Parallel Studio XE 2011 for Windows* Installation Guide and Release Notes
 Intel Parallel Studio XE 2011 for Windows* Installation Guide and Release Notes Document number: 323803-001US 4 May 2011 Table of Contents 1 Introduction... 1 1.1 What s New... 2 1.2 Product Contents...
Munara Tolubaeva Technical Consulting Engineer. 3D XPoint is a trademark of Intel Corporation in the U.S. and/or other countries.
 Munara Tolubaeva Technical Consulting Engineer 3D XPoint is a trademark of Intel Corporation in the U.S. and/or other countries. notices and disclaimers Intel technologies features and benefits depend
Intel Parallel Studio XE 2015
 2015 Create faster code faster with this comprehensive parallel software development suite. Faster code: Boost applications performance that scales on today s and next-gen processors Create code faster:
Getting Started Tutorial: Finding Hotspots
 Getting Started Tutorial: Finding Hotspots Intel VTune Amplifier XE 2013 for Windows* OS C++ Sample Application Code Document Number: 326704-002 Legal Information Contents Contents Legal Information...5
Tools for Intel Xeon Phi: VTune & Advisor Dr. Fabio Baruffa - LRZ,
 Tools for Intel Xeon Phi: VTune & Advisor Dr. Fabio Baruffa - fabio.baruffa@lrz.de LRZ, 27.6.- 29.6.2016 Architecture Overview Intel Xeon Processor Intel Xeon Phi Coprocessor, 1st generation Intel Xeon
Intel Many Integrated Core (MIC) Architecture
 Architecture") Intel Many Integrated Core (MIC) Architecture Karl Solchenbach Director European Exascale Labs BMW2011, November 3, 2011 1 Notice and Disclaimers Notice: This document contains information on products
Intel Many Integrated Core (MIC) Architecture Karl Solchenbach Director European Exascale Labs BMW2011, November 3, 2011 1 Notice and Disclaimers Notice: This document contains information on products
Intel Thread Checker 3.1 for Windows* Release Notes
 Page 1 of 6 Intel Thread Checker 3.1 for Windows* Release Notes Contents Overview Product Contents What's New System Requirements Known Issues and Limitations Technical Support Related Products Overview
Maximize Performance and Scalability of RADIOSS* Structural Analysis Software on Intel Xeon Processor E7 v2 Family-Based Platforms
 Maximize Performance and Scalability of RADIOSS* Structural Analysis Software on Family-Based Platforms Executive Summary Complex simulations of structural and systems performance, such as car crash simulations,
A Simple Path to Parallelism with Intel Cilk Plus
 Introduction This introductory tutorial describes how to use Intel Cilk Plus to simplify making taking advantage of vectorization and threading parallelism in your code. It provides a brief description
Performance analysis tools: Intel VTuneTM Amplifier and Advisor. Dr. Luigi Iapichino
 Performance analysis tools: Intel VTuneTM Amplifier and Advisor Dr. Luigi Iapichino luigi.iapichino@lrz.de Which tool do I use in my project? A roadmap to optimisation After having considered the MPI layer,
Installation Guide and Release Notes
 Intel Parallel Studio XE 2013 for Linux* Installation Guide and Release Notes Document number: 323804-003US 10 March 2013 Table of Contents 1 Introduction... 1 1.1 What s New... 1 1.1.1 Changes since Intel
H.J. Lu, Sunil K Pandey. Intel. November, 2018
 H.J. Lu, Sunil K Pandey Intel November, 2018 Issues with Run-time Library on IA Memory, string and math functions in today s glibc are optimized for today s Intel processors: AVX/AVX2/AVX512 FMA It takes
Intel Threading Tools
 Intel Threading Tools Paul Petersen, Intel -1- INFORMATION IN THIS DOCUMENT IS PROVIDED IN CONNECTION WITH INTEL PRODUCTS. EXCEPT AS PROVIDED IN INTEL'S TERMS AND CONDITIONS OF SALE FOR SUCH PRODUCTS,
Optimize Data Structures and Memory Access Patterns to Improve Data Locality
 Optimize Data Structures and Memory Access Patterns to Improve Data Locality Abstract Cache is one of the most important resources
Collecting OpenCL*-related Metrics with Intel Graphics Performance Analyzers
 Collecting OpenCL*-related Metrics with Intel Graphics Performance Analyzers Collecting Important OpenCL*-related Metrics with Intel GPA System Analyzer Introduction Intel SDK for OpenCL* Applications
Klaus-Dieter Oertel, May 28 th 2013 Software and Services Group Intel Corporation
 S c i c o m P 2 0 1 3 T u t o r i a l Intel Xeon Phi Product Family Programming Tools Klaus-Dieter Oertel, May 28 th 2013 Software and Services Group Intel Corporation Agenda Intel Parallel Studio XE 2013
Getting Started with Intel SDK for OpenCL Applications
 Getting Started with Intel SDK for OpenCL Applications Webinar #1 in the Three-part OpenCL Webinar Series July 11, 2012 Register Now for All Webinars in the Series Welcome to Getting Started with Intel
VTune(TM) Performance Analyzer for Linux
 Performance Analyzer for Linux") VTune(TM) Performance Analyzer for Linux Getting Started Guide The VTune Performance Analyzer provides information on the performance of your code. The VTune analyzer shows you the performance issues,
VTune(TM) Performance Analyzer for Linux Getting Started Guide The VTune Performance Analyzer provides information on the performance of your code. The VTune analyzer shows you the performance issues,
Jackson Marusarz Intel Corporation
 Jackson Marusarz Intel Corporation Intel VTune Amplifier Quick Introduction Get the Data You Need Hotspot (Statistical call tree), Call counts (Statistical) Thread Profiling Concurrency and Lock & Waits
Getting Started Tutorial: Analyzing Memory Errors
 Getting Started Tutorial: Analyzing Memory Errors Intel Inspector XE 2011 for Linux* OS Fortran Sample Application Code Document Number: 326596-001 World Wide Web: http://developer.intel.com Legal Information
MPI Performance Snapshot
 User's Guide 2014-2015 Intel Corporation Legal Information No license (express or implied, by estoppel or otherwise) to any intellectual property rights is granted by this document. Intel disclaims all
Intel Cluster Toolkit Compiler Edition 3.2 for Linux* or Windows HPC Server 2008*
 Intel Cluster Toolkit Compiler Edition. for Linux* or Windows HPC Server 8* Product Overview High-performance scaling to thousands of processors. Performance leadership Intel software development products
Intel Cluster Checker 3.0 webinar
 Intel Cluster Checker 3.0 webinar June 3, 2015 Christopher Heller Technical Consulting Engineer Q2, 2015 1 Introduction Intel Cluster Checker 3.0 is a systems tool for Linux high performance compute clusters
Intel Parallel Studio 2011
 THE ULTIMATE ALL-IN-ONE PERFORMANCE TOOLKIT Studio 2011 Product Brief Studio 2011 Accelerate Development of Reliable, High-Performance Serial and Threaded Applications for Multicore Studio 2011 is a comprehensive
Stanislav Bratanov; Roman Belenov; Ludmila Pakhomova 4/27/2015
 Stanislav Bratanov; Roman Belenov; Ludmila Pakhomova 4/27/2015 What is Intel Processor Trace? Intel Processor Trace (Intel PT) provides hardware a means to trace branching, transaction, and timing information
Oracle Developer Studio Performance Analyzer
 Oracle Developer Studio Performance Analyzer The Oracle Developer Studio Performance Analyzer provides unparalleled insight into the behavior of your application, allowing you to identify bottlenecks and
Achieving High Performance. Jim Cownie Principal Engineer SSG/DPD/TCAR Multicore Challenge 2013
 Achieving High Performance Jim Cownie Principal Engineer SSG/DPD/TCAR Multicore Challenge 2013 Does Instruction Set Matter? We find that ARM and x86 processors are simply engineering design points optimized
Intel Parallel Studio XE 2011 for Linux* Installation Guide and Release Notes
 Intel Parallel Studio XE 2011 for Linux* Installation Guide and Release Notes Document number: 323804-001US 8 October 2010 Table of Contents 1 Introduction... 1 1.1 Product Contents... 1 1.2 What s New...
Tutorial: Finding Hotspots on an Android* Platform
 Tutorial: Finding Hotspots on an Android* Platform Intel VTune Amplifier for Systems (Linux* OS version) C++ Sample Application Code Legal Information Important This document was last updated for the Intel
Tuning Python Applications Can Dramatically Increase Performance
 Tuning Python Applications Can Dramatically Increase Performance Vasilij Litvinov Software Engineer, Intel Legal Disclaimer & 2 INFORMATION IN THIS DOCUMENT IS PROVIDED AS IS. NO LICENSE, EXPRESS OR IMPLIED,
IXPUG 16. Dmitry Durnov, Intel MPI team
 IXPUG 16 Dmitry Durnov, Intel MPI team Agenda - Intel MPI 2017 Beta U1 product availability - New features overview - Competitive results - Useful links - Q/A 2 Intel MPI 2017 Beta U1 is available! Key
Intel tools for High Performance Python 데이터분석및기타기능을위한고성능 Python
 Intel tools for High Performance Python 데이터분석및기타기능을위한고성능 Python Python Landscape Adoption of Python continues to grow among domain specialists and developers for its productivity benefits Challenge#1:
Intel Parallel Studio XE 2011 SP1 for Linux* Installation Guide and Release Notes
 Intel Parallel Studio XE 2011 SP1 for Linux* Installation Guide and Release Notes Document number: 323804-002US 21 June 2012 Table of Contents 1 Introduction... 1 1.1 What s New... 1 1.2 Product Contents...
Get an Easy Performance Boost Even with Unthreaded Apps. with Intel Parallel Studio XE for Windows*
 Get an Easy Performance Boost Even with Unthreaded Apps for Windows* Can recompiling just one file make a difference? Yes, in many cases it can! Often, you can achieve a major performance boost by recompiling
Parallel Programming Features in the Fortran Standard. Steve Lionel 12/4/2012
 Parallel Programming Features in the Fortran Standard Steve Lionel 12/4/2012 Agenda Overview of popular parallelism methodologies FORALL a look back DO CONCURRENT Coarrays Fortran 2015 Q+A 12/5/2012 2
Becca Paren Cluster Systems Engineer Software and Services Group. May 2017
 Becca Paren Cluster Systems Engineer Software and Services Group May 2017 Clusters are complex systems! Challenge is to reduce this complexity barrier for: Cluster architects System administrators Application
Getting Started Tutorial: Analyzing Threading Errors
 Getting Started Tutorial: Analyzing Threading Errors Intel Inspector XE 2011 for Linux* OS Fortran Sample Application Code Document Number: 326600-001 World Wide Web: http://developer.intel.com Legal Information
Installation Guide and Release Notes
 Installation Guide and Release Notes Document number: 321604-001US 19 October 2009 Table of Contents 1 Introduction... 1 1.1 Product Contents... 1 1.2 System Requirements... 2 1.3 Documentation... 3 1.4
Intel profiling tools and roofline model. Dr. Luigi Iapichino
 Intel profiling tools and roofline model Dr. Luigi Iapichino luigi.iapichino@lrz.de Which tool do I use in my project? A roadmap to optimization (and to the next hour) We will focus on tools developed
Intel Parallel Studio XE 2019 Update 1
 Intel Parallel Studio XE 2019 Update 1 Installation Guide for Linux* OS 7 November 2018 Contents 1 Introduction...2 1.1 Licensing Information...2 2 Prerequisites...2 2.1 Notes for Cluster Installation...3
Intel Integrated Native Developer Experience 2015 Build Edition for OS X* Installation Guide and Release Notes
 Intel Integrated Native Developer Experience 2015 Build Edition for OS X* Installation Guide and Release Notes 24 July 2014 Table of Contents 1 Introduction... 2 1.1 Product Contents... 2 1.2 System Requirements...
KNL tools. Dr. Fabio Baruffa
 KNL tools Dr. Fabio Baruffa fabio.baruffa@lrz.de 2 Which tool do I use? A roadmap to optimization We will focus on tools developed by Intel, available to users of the LRZ systems. Again, we will skip the
Using Intel Transactional Synchronization Extensions
 Using Intel Transactional Synchronization Extensions Dr.-Ing. Michael Klemm Software and Services Group michael.klemm@intel.com 1 Credits The Tutorial Gang Christian Terboven Michael Klemm Ruud van der
MPI Performance Snapshot. User's Guide
 MPI Performance Snapshot User's Guide MPI Performance Snapshot User s Guide Legal Information No license (express or implied, by estoppel or otherwise) to any intellectual property rights is granted by
IFS RAPS14 benchmark on 2 nd generation Intel Xeon Phi processor
 IFS RAPS14 benchmark on 2 nd generation Intel Xeon Phi processor D.Sc. Mikko Byckling 17th Workshop on High Performance Computing in Meteorology October 24 th 2016, Reading, UK Legal Disclaimer & Optimization
Installation Guide and Release Notes
 Installation Guide and Release Notes Document number: 321604-002US 9 July 2010 Table of Contents 1 Introduction... 1 1.1 Product Contents... 2 1.2 What s New... 2 1.3 System Requirements... 2 1.4 Documentation...
Intel Parallel Studio XE 2018
 Intel Parallel Studio XE 2018 Installation Guide for Linux* OS 11 September 2017 Contents 1 Introduction...2 1.1 Licensing Information...2 2 Prerequisites...2 2.1 Notes for Cluster Installation...3 2.1.1
Getting Started Tutorial: Identifying Hardware Issues
 Getting Started Tutorial: Identifying Hardware Issues Intel VTune Amplifier XE 2011 for Linux* OS C++ Sample Application Code Document Number: 326709-001 Legal Information Contents Contents Legal Information...5
High Performance Computing The Essential Tool for a Knowledge Economy
 High Performance Computing The Essential Tool for a Knowledge Economy Rajeeb Hazra Vice President & General Manager Technical Computing Group Datacenter & Connected Systems Group July 22 nd 2013 1 What
MICHAL MROZEK ZBIGNIEW ZDANOWICZ
 MICHAL MROZEK ZBIGNIEW ZDANOWICZ Legal Notices and Disclaimers INFORMATION IN THIS DOCUMENT IS PROVIDED IN CONNECTION WITH INTEL PRODUCTS. NO LICENSE, EXPRESS OR IMPLIED, BY ESTOPPEL OR OTHERWISE, TO ANY
What s New August 2015
 What s New August 2015 Significant New Features New Directory Structure OpenMP* 4.1 Extensions C11 Standard Support More C++14 Standard Support Fortran 2008 Submodules and IMPURE ELEMENTAL Further C Interoperability
Intel Integrated Native Developer Experience 2015 Build Edition for OS X* Installation Guide and Release Notes
 Intel Integrated Native Developer Experience 2015 Build Edition for OS X* Installation Guide and Release Notes 22 January 2015 Table of Contents 1 Introduction... 2 1.1 Change History... 2 1.1.1 Changes
Evolving Small Cells. Udayan Mukherjee Senior Principal Engineer and Director (Wireless Infrastructure)
") Evolving Small Cells Udayan Mukherjee Senior Principal Engineer and Director (Wireless Infrastructure) Intelligent Heterogeneous Network Optimum User Experience Fibre-optic Connected Macro Base stations
Evolving Small Cells Udayan Mukherjee Senior Principal Engineer and Director (Wireless Infrastructure) Intelligent Heterogeneous Network Optimum User Experience Fibre-optic Connected Macro Base stations
Intel Parallel Studio XE 2016
 Intel Parallel Studio XE 2016 Installation Guide for Linux* OS 18 August 2015 Contents 1 Introduction...2 2 Prerequisites...2 3 Installation...6 3.1 Using Online Installer...6 3.2 Installation Through
Performance Tools for Technical Computing
 Christian Terboven terboven@rz.rwth-aachen.de Center for Computing and Communication RWTH Aachen University Intel Software Conference 2010 April 13th, Barcelona, Spain Agenda o Motivation and Methodology
Alexei Katranov. IWOCL '16, April 21, 2016, Vienna, Austria
 Alexei Katranov IWOCL '16, April 21, 2016, Vienna, Austria Hardware: customization, integration, heterogeneity Intel Processor Graphics CPU CPU CPU CPU Multicore CPU + integrated units for graphics, media
Getting Started Tutorial: Analyzing Threading Errors
 Getting Started Tutorial: Analyzing Threading Errors Intel Inspector XE 2011 for Windows* OS C++ Sample Application Code Document Number: 326597-001 World Wide Web: http://developer.intel.com Legal Information
Introduction to Performance Tuning & Optimization Tools
 Introduction to Performance Tuning & Optimization Tools a[i] a[i+1] + a[i+2] a[i+3] b[i] b[i+1] b[i+2] b[i+3] = a[i]+b[i] a[i+1]+b[i+1] a[i+2]+b[i+2] a[i+3]+b[i+3] Ian A. Cosden, Ph.D. Manager, HPC Software