Computational Physics Programming Style and Practices & Visualizing Data via Plotting
|
|
|
- Britney Hicks
- 6 years ago
- Views:
Transcription
1 Computational Physics Programming Style and Practices & Visualizing Data via Plotting Prof. Paul Eugenio Department of Physics Florida State University Jan 30,
2 Announcements Read Chapter 2 section 2.7 Good Programming style Chapter 3 sections Graphics and Visualization Chapter 4: pages Accuracy and Speed
3 Programming Conventions to follow in this class
4 Documentation via docstring Include documenting comments in your programs Each program should include a prolog comment block or docstring Each function should start with a docstring def def g(m,n): """ triple-double-quotes""" g(m,n): """ """ Greatest Greatest Common Common Divisor Divisor Euclid's Euclid's prescription: g(m,n) g(m,n) m if if n 0 0 else else g(m,n) g(m,n) g(n, g(n, m mod mod n) n) both both m & n must must both both be be nonnegative integers integers """ """ # Now Now for for the the code code The use of docstring will have helpful advantages later on
5 Program Prolog via docstring #! #! /usr/bin/env /usr/bin/env python python """ """ gcd.py gcd.py calculates calculates the the greatest greatest common common divisor divisor g(m,n) g(m,n) of of two two nonnegative nonnegative integers integers m m and and n n using using Euclid Euclid prescription. prescription. Paul Paul Eugenio Eugenio PHZ4151C PHZ4151C Exercise Exercise 2, 2, Problem Problem 4 4 Jan Jan 28, 28, """ """ from from future future import import division, division, print_function print_function
6 Functions, variables, and constants Use meaningful variable names Function names: lower_case_with_underscores Examples: catalan(), generate_data() Names to AVOID l (lowercase el), O (uppercase oh), or I (uppercase eye)
7 Functions, variables, and constants Use meaningful variable names Function names: lower_case_with_underscores Examples: catalan(), generate_data() Names to AVOID l (lowercase el), O (uppercase oh), or I (uppercase eye) Variables: b, B, lower, mixedcase Examples: N, i, j, maxangularmomentum
8 Functions, variables, and constants Use meaningful variable names Function names: lower_case_with_underscores Examples: catalan(), generate_data() Names to AVOID l (lowercase el), O (uppercase oh), or I (uppercase eye) Variables: b, B, lower, mixedcase Examples: N, i, j, maxangularmomentum Constants: CAPITAL_WITH_UNDERSCORES Examples: RADIUS_EARTH, exceptions for common use single constants i.e., g 9.81, c 3e8
9 Coding conventions Use the right type of variables int for integer quantities: indices, quantum numbers,.. float and complex for quantities that are real or complex bool for truly boolean types
10 Coding conventions Use the right type of variables int for integer quantities: indices, quantum numbers,.. float and complex for quantities that are real or complex bool for truly boolean types Import functions at the beginning of the program easy to find, check, and add to them ensures that functions are imported before use
11 Coding conventions Use the right type of variables int for integer quantities: indices, quantum numbers,.. float and complex for quantities that are real or complex bool for truly boolean types Import functions at the beginning of the program easy to find, check, and add to them ensures that functions are imported before use Give your constants names constants in your program should be given names and defined at the beginning for your program G e-11, Z 28, BOHR_RADIUS e-11
12 Coding conventions Use the right type of variables int for integer quantities: indices, quantum numbers,.. float and complex for quantities that are real or complex bool for truly boolean types Import functions at the beginning of the program easy to find, check, and add to them ensures that functions are imported before use Give your constants names constants in your program should be given names and defined at the beginning for your program G e-11 # Newtonian constant of gravitation [ m**2 /(kg * s**2) ] Z 28 # Atomic Number for Nickel BOHR_RADIUS e-11 # units [m]
13 Divide and Conquer Employ user-defined function, use for repeated and complicated operations greatly increases the legibility of your programs avoid overuse a single line or two of code is often better left in the main part of the program
14 Good Programming Practices Print out partial results & update throughout your program define a function and test it
15 Good Programming Practices Print out partial results & update throughout your program define a function and test it Lay out your programs clearly most of the work should NOT be in the main part of the program i.e. Divide and Conquer!
16 Good Programming Practices Print out partial results & update throughout your program define a function and test it Lay out your programs clearly most of the work should NOT be in the main part of the program i.e. Divide and Conquer! Don't make your programs unnecessarily complicated
17 Visualizing Data via Plotting
18 Plotting with Matplotlib Matplotlib Matplotlib is is the the standard standard package package for for plotting plotting in in Python Python import import matplotlib.pyplot as as plt plt import import numpy numpy as as np np def def sigma(t): return return t*np.exp(-t) x np.linspace(0, 10, 10, 101) 101) y np.zeros(len(x)) for for i in in range(len(x)): y[i] y[i] sigma(x[i]) plt.plot(x, y) y) plt.savefig( sigma.png ) plt.show() pyplot is a module in matplotlib package Create an array of linearly spaced values
19 Plotting with Matplotlib Matplotlib Matplotlib is is the the standard standard package package for for plotting plotting in in Python Python import import matplotlib.pyplot as as plt plt import import numpy numpy as as np np def def sigma(t): return return t*np.exp(-t) x np.linspace(0, 10, 10, 101) 101) y np.zeros(len(x)) for for i in in range(len(x)): y[i] y[i] sigma(x[i]) plt.plot(x, y) y) plt.savefig( sigma.png ) plt.show() create an array of linearly spaced values hpc-login % display sigma.png
20 Decorating the Plot See See for for more more examples examples import import matplotlib.pyplot matplotlib.pyplot as as plt plt plt.rc('text', plt.rc('text', usetextrue) usetextrue) plt.plot(x,y) plt.plot(x,y) plt.legend([r"$d\sigma/dt plt.legend([r"$d\sigma/dt t^2 t^2 e^{-t}$"]) e^{-t}$"]) plt.title("scattering plt.title("scattering Probability") Probability") plt.xlabel("t") plt.xlabel("t") plt.ylabel(r"$d\sigma/dt$") plt.ylabel(r"$d\sigma/dt$") plt.savefig("sigma-t.png") plt.savefig("sigma-t.png") plt.show() plt.show() Equation rendering with LaTex set up with: matplotlib.pyplot.rc('text', usetextrue) then use: r"<latex-equation>" Use this when you want to render Latex equations
21 b 0 for for i in in range(len(x)): range(len(x)): y[i] y[i] sigma_b(x[i], sigma_b(x[i], b) b) plt.plot(x,y) plt.plot(x,y) plt.hold(true) plt.hold(true) b 1 for for i in in range(len(x)): range(len(x)): y[i] y[i] sigma_b(x[i], sigma_b(x[i], b) b) plt.plot(x,y) plt.plot(x,y) Multiple Curves See See for for more more examples examples Using hold(false) makes plot() create a new figure
22 Multiple SubPlots rows plt.figure(1) plt.figure(1) plt.subplot(211) plt.subplot(211) x x np.linspace(0,10,101) np.linspace(0,10,101) b b 0 0 y y sigma_b(x, sigma_b(x, b) b) plt.plot(x,y) plt.plot(x,y) plt.legend([r"$d\sigma/dt plt.legend([r"$d\sigma/dt (t)^2 (t)^2 e^{-t}$"]) e^{-t}$"]) sets up b b 1 1 second plot y y sigma_b(x, sigma_b(x, b) b) plt.subplot(212) plt.subplot(212) plt.plot(x,y) plt.plot(x,y) plt.xlabel("t") plt.xlabel("t") plt.legend([r"$d\sigma/dt plt.legend([r"$d\sigma/dt (t-1)^2 (t-1)^2 e^{-t}$"]) e^{-t}$"]) plt.show() plt.show() columns plot #
23 Multiple SubPlots rows plt.figure(1) plt.figure(1) plt.subplot(211) plt.subplot(211) x x np.linspace(0,10,101) np.linspace(0,10,101) b b 0 0 y y sigma_b(x, sigma_b(x, b) b) plt.plot(x,y) plt.plot(x,y) plt.legend([r"$d\sigma/dt plt.legend([r"$d\sigma/dt (t)^2 (t)^2 e^{-t}$"]) e^{-t}$"]) sets up b b 1 1 second plot y y sigma_b(x, sigma_b(x, b) b) with 2x2 plt.subplot(223) spacing plt.subplot(223) plt.plot(x,y) plt.plot(x,y) plt.xlabel("t") plt.xlabel("t") plt.legend([r"$d\sigma/dt plt.legend([r"$d\sigma/dt (t-1)^2 (t-1)^2 e^{-t}$"]) e^{-t}$"]) plt.show() plt.show() columns plot #
24 See Plotting Examples plot1.py plot2.py plot3.py plot4.py
25 matplotlib, pylab, and pyplot matplotlib is the whole package pylab is a module in matplotlib that gets installed alongside matplotlib matplotlib.pyplot is a module in matplotlib pylab combines the pyplot functionality (for plotting) with the numpy functionality in a single namespace, making that namespace more MATLAB-like The pyplot interface is generally preferred for programs The pylab interface is convenient for interactive calculations and plotting, as it minimizes typing
26 matplotlib, pylab, and pyplot Python preferred programming import matplotlib.pyplot as plt import numpy as np plt.rc( text, usetextrue) x np.linspace(0,3,31) y x*np.exp(-x) plt.plot(x,y) plt.title("scattering") plt.xlabel("t") plt.ylabel(r"$d\sigma/dt$") plt.savefig( sigma.png ) plt.show() Convenient for interactive plotting from pylab import * rc( text, usetextrue) x linspace(0,10,101) y x*exp(-x) plot(x,y) title("scattering") xlabel("t") ylabel(r"$d\sigma/dt$") savefig( sigma.png ) show() Notice the use of vectorization!
27 display sigma.png
28 Scatter Plots import import numpy numpy as as np np import import matplotlib.pyplot matplotlib.pyplot as as plt plt # # Generate Generate data... data... x x np.random.random(25) np.random.random(25) y y np.random.random(25) np.random.random(25) # # Plot... Plot... plt.scatter(x, plt.scatter(x, y, y, c"b", c"b", s10) s10) point size plt.show() plt.show() b: blue g: green r: red c: cyan color m: magenta y: yellow k: black w:white


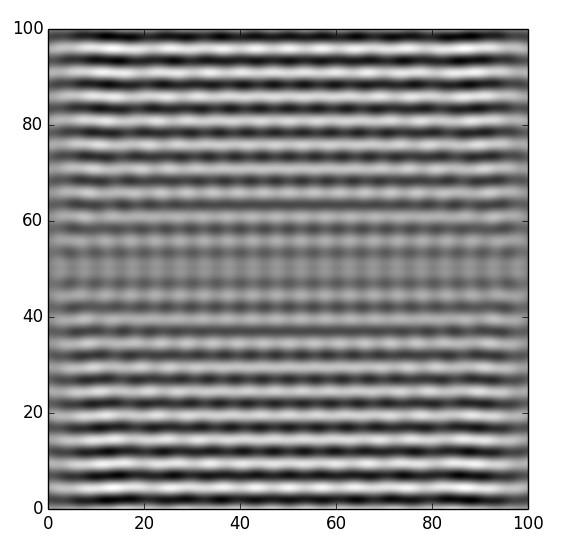
29 hpc-login 590% wavedrops.py Enter a number of wave sources: 1 Density Plots hpc-login 590% wavedrops.py Enter a number of wave sources: 2 hpc-login 590% wavedrops.py Enter a number of wave sources: 100
30 #! /usr/bin/env python Density Plots from future import division, print_function import numpy as np import matplotlib.pyplot as plt wavelength 5.0 k 2*np.pi/waveLength waveamp 1.0 size points 500 spacing size/points numberofsources int(input("enter a number of wave sources: ")) xsource [] ysource [] wavedrops.py For brevity, all comments are left out See Textbook example ripples.py for details continued next slide
31 Density Plots for i in range(numberofsources): xsource + [(i+1)*size/(numberofsources+1)] ysource + [size/2] waveimage np.zeros([points,points], float) for i in range(points): y spacing*i for j in range(points): x spacing*j for n in range(numberofsources): r np.sqrt( (x-xsource[n])**2 + \ (y-ysource[n])**2 ) waveimage[i,j] + waveamp*np.sin(k*r) plt.imshow(waveimage, origin"lower", extent[0,size,0,size]) plt.gray() plt.savefig("density.png") plt.show()
32 Let's get working
Computational Physics
 Computational Physics Intro to Python Prof. Paul Eugenio Department of Physics Florida State University Jan 16, 2018 http://comphy.fsu.edu/~eugenio/comphy/ Announcements Read Chapter 2 Python programming
Skills Quiz - Python Edition Solutions
 'XNH8QLYHUVLW\ (GPXQG73UDWW-U6FKRRORI(QJLQHHULQJ EGR 103L Fall 2017 Skills Quiz - Python Edition Solutions Michael R. Gustafson II Name (please print): NetID (please print): In keeping with the Community
Intro to Research Computing with Python: Visualization
 Intro to Research Computing with Python: Visualization Erik Spence SciNet HPC Consortium 20 November 2014 Erik Spence (SciNet HPC Consortium) Visualization 20 November 2014 1 / 29 Today s class Today we
Interactive Mode Python Pylab
 Short Python Intro Gerald Schuller, Nov. 2016 Python can be very similar to Matlab, very easy to learn if you already know Matlab, it is Open Source (unlike Matlab), it is easy to install, and unlike Matlab
Visualisation in python (with Matplotlib)
") Visualisation in python (with Matplotlib) Thanks to all contributors: Ag Stephens, Stephen Pascoe. Introducing Matplotlib Matplotlib is a python 2D plotting library which produces publication quality figures
Visualisation in python (with Matplotlib) Thanks to all contributors: Ag Stephens, Stephen Pascoe. Introducing Matplotlib Matplotlib is a python 2D plotting library which produces publication quality figures
Using the Matplotlib Library in Python 3
 Using the Matplotlib Library in Python 3 Matplotlib is a Python 2D plotting library that produces publication-quality figures in a variety of hardcopy formats and interactive environments across platforms.
Computational Physics. User Defined Modules
 Computational Physics User Defined Modules Jan 31, 2019 http://hadron.physics.fsu.edu/~eugenio/comphy/ eugenio@fsu.edu pydoc Documentation generator and online help system pydoc numpy.random.random Why
The SciPy Stack. Jay Summet
 The SciPy Stack Jay Summet May 1, 2014 Outline Numpy - Arrays, Linear Algebra, Vector Ops MatPlotLib - Data Plotting SciPy - Optimization, Scientific functions TITLE OF PRESENTATION 2 What is Numpy? 3rd
A New Cyberinfrastructure for the Natural Hazards Community
 A New Cyberinfrastructure for the Natural Hazards Community 1 Agenda Introduction to the Jupyter Notebook Programming in Python Plotting with Matplotlib Putting everything together a scientific notebook
Bi 1x Spring 2014: Plotting and linear regression
 Bi 1x Spring 2014: Plotting and linear regression In this tutorial, we will learn some basics of how to plot experimental data. We will also learn how to perform linear regressions to get parameter estimates.
MATPLOTLIB. Python for computational science November 2012 CINECA.
 MATPLOTLIB Python for computational science 19 21 November 2012 CINECA m.cestari@cineca.it Introduction (1) plotting the data gives us visual feedback in the working process Typical workflow: write a python
CME 193: Introduction to Scientific Python Lecture 6: Numpy, Scipy, Matplotlib
 CME 193: Introduction to Scientific Python Lecture 6: Numpy, Scipy, Matplotlib Nolan Skochdopole stanford.edu/class/cme193 6: Numpy, Scipy, Matplotlib 6-1 Contents Homeworks and Project Numpy Scipy Matplotlib
Plotting With matplotlib
 Lab Plotting With matplotlib and Mayavi Lab Objective: Introduce some of the basic plotting functions available in matplotlib and Mayavi. -D plotting with matplotlib The Python library matplotlib will
Episode 8 Matplotlib, SciPy, and Pandas. We will start with Matplotlib. The following code makes a sample plot.
 Episode 8 Matplotlib, SciPy, and Pandas Now that we understand ndarrays, we can start using other packages that utilize them. In particular, we're going to look at Matplotlib, SciPy, and Pandas. Matplotlib
Python Matplotlib. MACbioIDi February March 2018
 Python Matplotlib MACbioIDi February March 2018 Introduction Matplotlib is a Python 2D plotting library Its origins was emulating the MATLAB graphics commands It makes heavy use of NumPy Objective: Create
LECTURE 22. Numerical and Scientific Computing Part 2
 LECTURE 22 Numerical and Scientific Computing Part 2 MATPLOTLIB We re going to continue our discussion of scientific computing with matplotlib. Matplotlib is an incredibly powerful (and beautiful!) 2-D
cosmos_python_ Python as calculator May 31, 2018
 cosmos_python_2018 May 31, 2018 1 Python as calculator Note: To convert ipynb to pdf file, use command: ipython nbconvert cosmos_python_2015.ipynb --to latex --post pdf In [3]: 1 + 3 Out[3]: 4 In [4]:
Skills Quiz - Python Edition Solutions
 'XNH8QLYHUVLW\ (GPXQG73UDWW-U6FKRRORI(QJLQHHULQJ EGR 103L Fall 2016 Skills Quiz - Python Edition Solutions Rebecca A. Simmons and & Michael R. Gustafson II Name (please print): NetID (please print): In
Computational Physics
 Computational Physics Python Programming Basics Prof. Paul Eugenio Department of Physics Florida State University Jan 17, 2019 http://hadron.physics.fsu.edu/~eugenio/comphy/ Announcements Exercise 0 due
UNIVERSITETET I OSLO
 (Continued on page 2.) UNIVERSITETET I OSLO Det matematisk-naturvitenskapelige fakultet Examination in: INF1100 Introduction to programming with scientific applications Day of examination: Thursday, October
HW0 v3. October 2, CSE 252A Computer Vision I Fall Assignment 0
 HW0 v3 October 2, 2018 1 CSE 252A Computer Vision I Fall 2018 - Assignment 0 1.0.1 Instructor: David Kriegman 1.0.2 Assignment Published On: Tuesday, October 2, 2018 1.0.3 Due On: Tuesday, October 9, 2018
5 File I/O, Plotting with Matplotlib
 5 File I/O, Plotting with Matplotlib Bálint Aradi Course: Scientific Programming / Wissenchaftliches Programmieren (Python) Installing some SciPy stack components We will need several Scipy components
4. BASIC PLOTTING. JHU Physics & Astronomy Python Workshop Lecturer: Mubdi Rahman
 4. BASIC PLOTTING JHU Physics & Astronomy Python Workshop 2016 Lecturer: Mubdi Rahman INTRODUCING MATPLOTLIB! Very powerful plotting package. The Docs: http://matplotlib.org/api/pyplot_api.html GETTING
AMath 483/583 Lecture 28 June 1, Notes: Notes: Python scripting for Fortran codes. Python scripting for Fortran codes.
 AMath 483/583 Lecture 28 June 1, 2011 Today: Python plus Fortran Comments on quadtests.py for project Linear vs. log-log plots Visualization Friday: Animation: plots to movies Binary I/O Parallel IPython
Python for Scientists
 High level programming language with an emphasis on easy to read and easy to write code Includes an extensive standard library We use version 3 History: Exists since 1991 Python 3: December 2008 General
Numerical Calculations
 Fundamentals of Programming (Python) Numerical Calculations Sina Sajadmanesh Sharif University of Technology Some slides have been adapted from Scipy Lecture Notes at http://www.scipy-lectures.org/ Outline
Computational Physics
 Computational Physics Object-Oriented Programing Prof. Paul Eugenio Department of Physics Florida State University 26 Feb 2019 http://hadron.physics.fsu.edu/~eugenio/comphy/ Announcements Mid-Term 1 Will
CME 193: Introduction to Scientific Python Lecture 5: Numpy, Scipy, Matplotlib
 CME 193: Introduction to Scientific Python Lecture 5: Numpy, Scipy, Matplotlib Sven Schmit stanford.edu/~schmit/cme193 5: Numpy, Scipy, Matplotlib 5-1 Contents Second part of course Numpy Scipy Matplotlib
Lecture 15: High Dimensional Data Analysis, Numpy Overview
 Lecture 15: High Dimensional Data Analysis, Numpy Overview Chris Tralie, Duke University 3/3/2016 Announcements Mini Assignment 3 Out Tomorrow, due next Friday 3/11 11:55PM Rank Top 3 Final Project Choices
L15. 1 Lecture 15: Data Visualization. July 10, Overview and Objectives. 1.2 Part 1: Introduction to matplotlib
 L15 July 10, 2017 1 Lecture 15: Data Visualization CSCI 1360E: Foundations for Informatics and Analytics 1.1 Overview and Objectives Data visualization is one of, if not the, most important method of communicating
(DRAFT) PYTHON FUNDAMENTALS II: NUMPY & MATPLOTLIB
 PYTHON FUNDAMENTALS II: NUMPY & MATPLOTLIB") (DRAFT) PYTHON FUNDAMENTALS II: NUMPY & MATPLOTLIB TROY P. KLING Contents 1. Importing Libraries 1 2. Introduction to numpy 2 3. Introduction to matplotlib 5 4. Image Processing 8 5. The Mandelbrot Set
(DRAFT) PYTHON FUNDAMENTALS II: NUMPY & MATPLOTLIB TROY P. KLING Contents 1. Importing Libraries 1 2. Introduction to numpy 2 3. Introduction to matplotlib 5 4. Image Processing 8 5. The Mandelbrot Set
Computational Physics
 Computational Physics Objects : Lists & Arrays Prof. Paul Eugenio Department of Physics Florida State University Jan 24, 2019 http://hadron.physics.fsu.edu/~eugenio/comphy/ Announcements Read chapter 3
Python in Economics and Finance
 Python in Economics and Finance Part 2 John Stachurski, ANU June 2014 Topics Data types OOP Iteration Functions NumPy / SciPy Matplotlib Data Types We have already met several native Python data types»>
Python Crash Course Numpy, Scipy, Matplotlib
 Python Crash Course Numpy, Scipy, Matplotlib That is what learning is. You suddenly understand something you ve understood all your life, but in a new way. Doris Lessing Steffen Brinkmann Max-Planck-Institut
Introduction to Matplotlib: 3D Plotting and Animations
 1 Introduction to Matplotlib: 3D Plotting and Animations Lab Objective: 3D plots and animations are useful in visualizing solutions to ODEs and PDEs found in many dynamics and control problems. In this
Basic Beginners Introduction to plotting in Python
 Basic Beginners Introduction to plotting in Python Sarah Blyth July 23, 2009 1 Introduction Welcome to a very short introduction on getting started with plotting in Python! I would highly recommend that
Homework 11 - Debugging
 1 of 7 5/28/2018, 1:21 PM Homework 11 - Debugging Instructions: Fix the errors in the following problems. Some of the problems are with the code syntax, causing an error message. Other errors are logical
MS6021 Scientific Computing. TOPICS: Python BASICS, INTRO to PYTHON for Scientific Computing
 MS6021 Scientific Computing TOPICS: Python BASICS, INTRO to PYTHON for Scientific Computing Preliminary Notes on Python (v MatLab + other languages) When you enter Spyder (available on installing Anaconda),
A. Python Crash Course
 A. Python Crash Course Agenda A.1 Installing Python & Co A.2 Basics A.3 Data Types A.4 Conditions A.5 Loops A.6 Functions A.7 I/O A.8 OLS with Python 2 A.1 Installing Python & Co You can download and install
Introduction to Python
 Introduction to Python Ryan Gutenkunst Molecular and Cellular Biology University of Arizona Before we start, fire up your Amazon instance, open a terminal, and enter the command sudo apt-get install ipython
NAVIGATING UNIX. Other useful commands, with more extensive documentation, are
 1 NAVIGATING UNIX Most scientific computing is done on a Unix based system, whether a Linux distribution such as Ubuntu, or OSX on a Mac. The terminal is the application that you will use to talk to the
ipywidgets_demo July 17, Interactive widgets for the Jupyter notebook (ipywidgets)
") ipywidgets_demo July 17, 2017 1 Interactive widgets for the Jupyter notebook (ipywidgets) Maarten Breddels - Kapteyn Astronomical Institute / RuG - Groningen Material on github https://github.com/maartenbreddels/ewass-2017
ipywidgets_demo July 17, 2017 1 Interactive widgets for the Jupyter notebook (ipywidgets) Maarten Breddels - Kapteyn Astronomical Institute / RuG - Groningen Material on github https://github.com/maartenbreddels/ewass-2017
 Session 1 Use test driven development (i.e. write the tests first) to design functions to give the square, cube and an arbitary power N for a number a. In [1]: import unittest def square(a): return a**2
Introduction to Python and NumPy I
 Introduction to Python and NumPy I This tutorial is continued in part two: Introduction to Python and NumPy II Table of contents Overview Launching Canopy Getting started in Python Getting help Python
The Python interpreter
 The Python interpreter Daniel Winklehner, Remi Lehe US Particle Accelerator School (USPAS) Summer Session Self-Consistent Simulations of Beam and Plasma Systems S. M. Lund, J.-L. Vay, D. Bruhwiler, R.
Lab 1 - Basic ipython Tutorial (EE 126 Fall 2014)
") Lab 1 - Basic ipython Tutorial (EE 126 Fall 2014) modified from Berkeley Python Bootcamp 2013 https://github.com/profjsb/python-bootcamp and Python for Signal Processing http://link.springer.com/book/10.1007%2f978-3-319-01342-8
Lab 1 - Basic ipython Tutorial (EE 126 Fall 2014) modified from Berkeley Python Bootcamp 2013 https://github.com/profjsb/python-bootcamp and Python for Signal Processing http://link.springer.com/book/10.1007%2f978-3-319-01342-8
Introduction to Machine Learning. Useful tools: Python, NumPy, scikit-learn
 Introduction to Machine Learning Useful tools: Python, NumPy, scikit-learn Antonio Sutera and Jean-Michel Begon September 29, 2016 2 / 37 How to install Python? Download and use the Anaconda python distribution
Matplotlib Python Plotting
 Matplotlib Python Plotting 1 / 6 2 / 6 3 / 6 Matplotlib Python Plotting Matplotlib is a Python 2D plotting library which produces publication quality figures in a variety of hardcopy formats and interactive
Programming for Engineers in Python
 Programming for Engineers in Python Autumn 2016-17 Lecture 11: NumPy & SciPy Introduction, Plotting and Data Analysis 1 Today s Plan Introduction to NumPy & SciPy Plotting Data Analysis 2 NumPy and SciPy
Ch.5: Array computing and curve plotting (Part 1)
") Ch.5: Array computing and curve plotting (Part 1) Joakim Sundnes 1,2 Hans Petter Langtangen 1,2 Simula Research Laboratory 1 University of Oslo, Dept. of Informatics 2 Sep 20, 2017 (Adjusted) Plan for
Ch.5: Array computing and curve plotting (Part 1) Joakim Sundnes 1,2 Hans Petter Langtangen 1,2 Simula Research Laboratory 1 University of Oslo, Dept. of Informatics 2 Sep 20, 2017 (Adjusted) Plan for
Computer Lab 1: Introduction to Python
 Computer Lab 1: Introduction to Python 1 I. Introduction Python is a programming language that is fairly easy to use. We will use Python for a few computer labs, beginning with this 9irst introduction.
NumPy and SciPy. Lab Objective: Create and manipulate NumPy arrays and learn features available in NumPy and SciPy.
 Lab 2 NumPy and SciPy Lab Objective: Create and manipulate NumPy arrays and learn features available in NumPy and SciPy. Introduction NumPy and SciPy 1 are the two Python libraries most used for scientific
Interpolation and curve fitting
 CITS2401 Computer Analysis and Visualization School of Computer Science and Software Engineering Lecture 9 Interpolation and curve fitting 1 Summary Interpolation Curve fitting Linear regression (for single
MO101: Python for Engineering Vladimir Paun ENSTA ParisTech
 I MO101: Python for Engineering Vladimir Paun ENSTA ParisTech License CC BY-NC-SA 2.0 http://creativecommons.org/licenses/by-nc-sa/2.0/fr/ Introduction to Python Introduction About Python Python itself
Python 101. Nadia Blagorodnova Caltech, 25th January 2017
 Python 101 Nadia Blagorodnova Caltech, 25th January 2017 Why do we need to program? Getting python on your machine Download here https://python4astronomers.github.io/installation/ recommended_options.html
windrose Documentation Lionel Roubeyrie & Sebastien Celles
 Lionel Roubeyrie & Sebastien Celles Sep 04, 2018 Contents: 1 Install 3 1.1 Requirements............................................... 3 1.2 Install latest release version via pip...................................
STATISTICAL THINKING IN PYTHON I. Introduction to Exploratory Data Analysis
 STATISTICAL THINKING IN PYTHON I Introduction to Exploratory Data Analysis Exploratory data analysis The process of organizing, plotting, and summarizing a data set Exploratory data analysis can never
Scientific Python: matplotlib
 Scientific Python: matplotlib 17 July 2014 Introduction and Aims This exercise introduces the matplotlib module of Python. Matplotlib is a versatile plotting library that can be used to produce both quick
Lab 4: Structured Programming I
 4.1 Introduction Lab 4: Structured Programming I Lab this week is going to focus on selective structures and functions. 4.2 Resources The additional resources required for this assignment include: 0 Books:
MAS212 Scientific Computing and Simulation
 MAS212 Scientific Computing and Simulation Dr. Sam Dolan School of Mathematics and Statistics, University of Sheffield Autumn 2017 http://sam-dolan.staff.shef.ac.uk/mas212/ G18 Hicks Building s.dolan@sheffield.ac.uk
Week Two. Arrays, packages, and writing programs
 Week Two Arrays, packages, and writing programs Review UNIX is the OS/environment in which we work We store files in directories, and we can use commands in the terminal to navigate around, make and delete
GIS Exercise 5 QGIS Python Introduction Feb. 19, 2016
 GIS Exercise 5 QGIS Python Introduction Feb. 19, 2016 Introduction Python is a computer language which is used in both ArcGIS and in QGIS. It allows you to automate repetitive tasks, create new "plugins"
INTRODUCTION TO DATA VISUALIZATION WITH PYTHON. Working with 2D arrays
 INTRODUCTION TO DATA VISUALIZATION WITH PYTHON Working with 2D arrays Reminder: NumPy arrays Homogeneous in type Calculations all at once Indexing with brackets: A[index] for 1D array A[index0, index1]
Matlab Tutorial 1: Working with variables, arrays, and plotting
 Matlab Tutorial 1: Working with variables, arrays, and plotting Setting up Matlab First of all, let's make sure we all have the same layout of the different windows in Matlab. Go to Home Layout Default.
ARTIFICIAL INTELLIGENCE AND PYTHON
 ARTIFICIAL INTELLIGENCE AND PYTHON DAY 1 STANLEY LIANG, LASSONDE SCHOOL OF ENGINEERING, YORK UNIVERSITY WHAT IS PYTHON An interpreted high-level programming language for general-purpose programming. Python
Inverse Ray Shooting Tutorial. Jorge Jiménez Vicente Dpto. Física Teórica y del Cosmos Universidad de Granada Spain
 Inverse Ray Shooting Tutorial Jorge Jiménez Vicente Dpto. Física Teórica y del Cosmos Universidad de Granada Spain Final goal Session I Introduction to Python Solving the lens equation Ray shooting basics
lof April 23, Improving performance of Local outlier factor with KD-Trees
 lof April 23, 2014 1 Improving performance of Local outlier factor with KD-Trees Local outlier factor (LOF) is an outlier detection algorithm, that detects outliers based on comparing local density of
Summary of chapters 1-5 (part 1)
") Summary of chapters 1-5 (part 1) Ole Christian Lingjærde, Dept of Informatics, UiO 6 October 2017 Today s agenda Exercise A.14, 5.14 Quiz Hint: Section A.1.8 explains how this task can be solved for the
Summary of chapters 1-5 (part 1) Ole Christian Lingjærde, Dept of Informatics, UiO 6 October 2017 Today s agenda Exercise A.14, 5.14 Quiz Hint: Section A.1.8 explains how this task can be solved for the
Scientific Programming. Lecture A08 Numpy
 Scientific Programming Lecture A08 Alberto Montresor Università di Trento 2018/10/25 Acknowledgments: Stefano Teso, Documentation http://disi.unitn.it/~teso/courses/sciprog/python_appendices.html https://docs.scipy.org/doc/numpy-1.13.0/reference/
Part VI. Scientific Computing in Python. Alfredo Parra : Scripting with Python Compact Max-PlanckMarch 6-10,
 Part VI Scientific Computing in Python Compact Course @ Max-PlanckMarch 6-10, 2017 63 Doing maths in Python Standard sequence types (list, tuple,... ) Can be used as arrays Can contain different types
(2) Hypothesis Testing
 Hypothesis Testing") (2) Hypothesis Testing March 1, 2016 In [4]: %matplotlib inline #python includes import sys #standard probability includes: import numpy as np #matrices and data structures import scipy.stats as ss #standard
(2) Hypothesis Testing March 1, 2016 In [4]: %matplotlib inline #python includes import sys #standard probability includes: import numpy as np #matrices and data structures import scipy.stats as ss #standard
Random Numbers Random Walk
 Random Numbers Random Walk Computational Physics Random Numbers Random Walk Outline Random Systems Random Numbers Monte Carlo Integration Example Random Walk Exercise 7 Introduction Random Systems Deterministic
Introduction to Wavelets
 Lab 11 Introduction to Wavelets Lab Objective: In the context of Fourier analysis, one seeks to represent a function as a sum of sinusoids. A drawback to this approach is that the Fourier transform only
CS1114 Spring 2015 Test ONE ANSWER KEY. page 1 of 8 pages (counting the cover sheet)
") CS1114 Spring 2015 Test ONE ANSWER KEY page 1 of 8 pages (counting the cover sheet) For the following questions, use these variable definitions a = 36 b = 3 c = 12 d = '3' What is the type and value of
CS1114 Spring 2015 Test ONE ANSWER KEY page 1 of 8 pages (counting the cover sheet) For the following questions, use these variable definitions a = 36 b = 3 c = 12 d = '3' What is the type and value of
python 01 September 16, 2016
 python 01 September 16, 2016 1 Introduction to Python adapted from Steve Phelps lectures - (http://sphelps.net) 2 Python is interpreted Python is an interpreted language (Java and C are not). In [1]: 7
import matplotlib as mpl # As of July 2017 Bucknell computers use v. 2.x import matplotlib.pyplot as plt
 PHYS 310 HW Problem Simulation of PHYS 211 M&M Experiment 6 Colors: Yellow, Blue, Orange, Red, Green, and Blue Assume 60 M&Ms in every bag Assume equal probabilities (well mixed, large "reservoir") Assume
Derek Bridge School of Computer Science and Information Technology University College Cork
 CS468: Artificial Intelligence I Ordinary Least Squares Regression Derek Bridge School of Computer Science and Information Technology University College Cork Initialization In [4]: %load_ext autoreload
User-Defined Function
 ENGR 102-213 (Socolofsky) Week 11 Python scripts In the lecture this week, we are continuing to learn powerful things that can be done with userdefined functions. In several of the examples, we consider
1 Introduction: Download the Sample Code and Data
 PHYS-4007/5007: Computational Physics Python Tutorial Making Plots of Spectra in Python 1 Introduction: Download the Sample Code and Data Log into your Linux account and open the web browser. Open the
#To import the whole library under a different name, so you can type "diff_name.f unc_name" import numpy as np import matplotlib.
 In [1]: #Here I import the relevant function libraries #This can be done in many ways #To import an entire library (e.g. scipy) so that functions accessed by typing "l ib_name.func_name" import matplotlib
Sampling from distributions
 Sampling from distributions December 17, 2015 1 Sampling from distributions Now that we are able to sample equally distributed (pseudo-)random numbers in the interval [1, 0), we are now able to sample
Practical 06: Plotting and the Verlet integrator Documentation
 Practical 06: Plotting and the Verlet integrator Documentation Release 1.0 Oliver Beckstein February 07, 2013 CONTENTS 1 Practical 06 3 1.1 IPython and pylab............................................
Activity recognition and energy expenditure estimation
 Activity recognition and energy expenditure estimation A practical approach with Python WebValley 2015 Bojan Milosevic Scope Goal: Use wearable sensors to estimate energy expenditure during everyday activities
Latent Semantic Analysis. sci-kit learn. Vectorizing text. Document-term matrix
 Latent Semantic Analysis Latent Semantic Analysis (LSA) is a framework for analyzing text using matrices Find relationships between documents and terms within documents Used for document classification,
An introduction to Python. Matteo Degiacomi December 2017
 An introduction to Python Matteo Degiacomi December 2017 TIOBE Programming Community index: Python ranked 4 th most popular language What makes a good programming language? Readable Concise Large ecosystem
Scripting Languages. Python basics
 Scripting Languages Python basics Interpreter Session: python Direct conversation with python (>>>) Python 3.5.2 (default, Nov 23 2017, 16:37:01) [GCC 5.4.0 20160609] on linux Type "help", "copyright",
Matplotlib Tools. Useful Matplotlib Tools. Legends Outside of the Plot/Figure
 Matplotlib Tools Useful Matplotlib Tools The following sections show how to use matplotlib to create various plots or plot elements. 1 Useful Matplotlib Tools 1.1 Legends Outside of the Plot/Figure 1.1.1
Aprendizagem Automática. Feature Extraction. Ludwig Krippahl
 Aprendizagem Automática Feature Extraction Ludwig Krippahl Feature Extraction Summary Feature Extraction Principal Component Analysis Self Organizing Maps Extraction and reduction with SOM (toy example)
Extended Introduction to Computer Science CS1001.py Lecture 10, part A: Interim Summary; Testing; Coding Style
 Extended Introduction to Computer Science CS1001.py Lecture 10, part A: Interim Summary; Testing; Coding Style Instructors: Benny Chor, Amir Rubinstein Teaching Assistants: Michal Kleinbort, Amir Gilad
Tutorial 2 PHY409 Anadi Canepa Office, TRIUMF MOB 92 B ( )
") Tutorial 2 PHY409 Anadi Canepa canepa@triumf.ca Office, TRIUMF MOB 92 B (1-604- 222-7330) Alan Manning mannin2@phas.ubc.ca Mohammad Samani samani@physics.ubc.ca During the 1 st tutorial We learnt What
Tutorial 2 PHY409 Anadi Canepa canepa@triumf.ca Office, TRIUMF MOB 92 B (1-604- 222-7330) Alan Manning mannin2@phas.ubc.ca Mohammad Samani samani@physics.ubc.ca During the 1 st tutorial We learnt What
ENGR (Socolofsky) Week 07 Python scripts
 Week 07 Python scripts") ENGR 102-213 (Socolofsky) Week 07 Python scripts A couple programming examples for this week are embedded in the lecture notes for Week 7. We repeat these here as brief examples of typical array-like operations
ENGR 102-213 (Socolofsky) Week 07 Python scripts A couple programming examples for this week are embedded in the lecture notes for Week 7. We repeat these here as brief examples of typical array-like operations
Effective Programming Practices for Economists. 10. Some scientific tools for Python
 Effective Programming Practices for Economists 10. Some scientific tools for Python Hans-Martin von Gaudecker Department of Economics, Universität Bonn A NumPy primer The main NumPy object is the homogeneous
INTRODUCTION TO DATA VISUALIZATION WITH PYTHON. Visualizing Regressions
 INTRODUCTION TO DATA VISUALIZATION WITH PYTHON Visualizing Regressions Seaborn https://stanford.edu/~mwaskom/software/seaborn/ Recap: Pandas DataFrames Labelled tabular data structure Labels on rows: index
Unsupervised Learning: K-means Clustering
 Unsupervised Learning: K-means Clustering by Prof. Seungchul Lee isystems Design Lab http://isystems.unist.ac.kr/ UNIST Table of Contents I. 1. Supervised vs. Unsupervised Learning II. 2. K-means I. 2.1.
Partial Differential Equations II: 2D Laplace Equation on 5x5 grid
 Partial Differential Equations II: 2D Laplace Equation on 5x5 grid Sam Sinayoko Numerical Methods 5 Contents 1 Learning Outcomes 2 2 Introduction 3 3 Laplace equation in 2D 3 4 Discretisation 3 4.1 Meshing:
CSCE 110: Programming I
 CSCE 110: Programming I Sample Questions for Exam #1 February 17, 2013 Below are sample questions to help you prepare for Exam #1. Make sure you can solve all of these problems by hand. For most of the
Command Line and Python Introduction. Jennifer Helsby, Eric Potash Computation for Public Policy Lecture 2: January 7, 2016
 Command Line and Python Introduction Jennifer Helsby, Eric Potash Computation for Public Policy Lecture 2: January 7, 2016 Today Assignment #1! Computer architecture Basic command line skills Python fundamentals
Introduction to Scientific Computing Lecture 8
 Introduction to Scientific Computing Lecture 8 Professor Hanno Rein Last updated: November 7, 2017 1 N-body integrations 1.1 Newton s law We ll discuss today an important real world application of numerical
Data Analysis Frameworks
 Data Analysis Frameworks ROOT Data Analysis Frameworks Computational Physics Prof. Paul Eugenio Department of Physics Florida State University April 10, 2018 Exercise 8 Due Date extended to Noon Thursday
Tutorial Four: Linear Regression
 Tutorial Four: Linear Regression Imad Pasha Chris Agostino February 25, 2015 1 Introduction When looking at the results of experiments, it is critically important to be able to fit curves to scattered