It s Good to Have (JVM) Options
|
|
|
- Benjamin Jordan
- 5 years ago
- Views:
Transcription


1 It s Good to Have (JVM) Options Chris Hansen / Sr Engineering Manager Tori Wieldt / Technical Evangelist JavaOne 2017
2 Safe Harbor This presentation and the information herein (including any information that may be incorporated by reference) is provided for informational purposes only and should not be construed as an offer, commitment, promise or obligation on behalf of New Relic, Inc. ( New Relic ) to sell securities or deliver any product, material, code, functionality, or other feature. Any information provided hereby is proprietary to New Relic and may not be replicated or disclosed without New Relic s express written permission. Such information may contain forward-looking statements within the meaning of federal securities laws. Any statement that is not a historical fact or refers to expectations, projections, future plans, objectives, estimates, goals, or other characterizations of future events is a forward-looking statement. These forward-looking statements can often be identified as such because the context of the statement will include words such as believes, anticipates, expects or words of similar import. Actual results may differ materially from those expressed in these forward-looking statements, which speak only as of the date hereof, and are subject to change at any time without notice. Existing and prospective investors, customers and other third parties transacting business with New Relic are cautioned not to place undue reliance on this forward-looking information. The achievement or success of the matters covered by such forward-looking statements are based on New Relic s current assumptions, expectations, and beliefs and are subject to substantial risks, uncertainties, assumptions, and changes in circumstances that may cause the actual results, performance, or achievements to differ materially from those expressed or implied in any forward-looking statement. Further information on factors that could affect such forward-looking statements is included in the filings New Relic makes with the SEC from time to time. Copies of these documents may be obtained by visiting New Relic s Investor Relations website at ir.newrelic.com or the SEC s website at New Relic assumes no obligation and does not intend to update these forward-looking statements, except as required by law. New Relic makes no warranties, expressed or implied, in this presentation or otherwise, with respect to the information provided. 2
3 Too Many Options.x10 Source: Source: 3

4 4

5 Focus 5

6 Visualization software courtesy wordle.net 6
7 Whence Data? New Relic monitors 500,000 JVMs running apps and services We report JVM options to aid in troubleshooting and discovery The JVM option and other data here is fully anonymized Filtered for Oracle Hotspot JVM only 7
8 What do we count as the use of an option? The key... -Xmx512M -Xloggc:/var/log/jvmgc.log -XX:MaxPermSize=64M -XX:+PrintGCDetails Value, sort of 8
9 Most Common JVM Options 9


10 Categories of Options Memory sizing Diagnostics GC tuning Other tuning 10

11 Basics of Java Heap and GC Source: Jörge Prante 11
12 Object Tenure req sesh Eden sesh S0 sesh S1 sesh Tenured (i.e. Old) 12
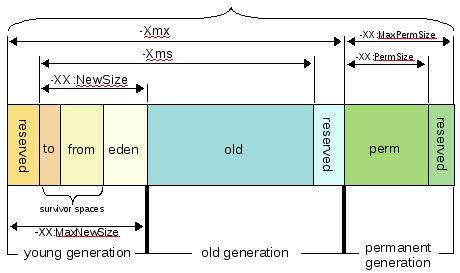
13 Source: 13
14 Resource Limits (Object Heap) -Xmx* : Heap max (87%) -Xms* : Heap initial (64%) -Xss* : Per-thread stack size (11%) -XX:MaxHeapFreeRatio=* : When to shrink heap (6%) -XX:MinHeapFreeRatio=* : When to expand heap (5%) -Xmn* : Size of young generation (6%) -XX:SurvivorRatio=* : Eden : Survivor (6%) 14
15 Resource Limits (PermGen/Metaspace) -XMaxPermSize=* : PermGen max (29%) -XPermSize=* : PermGen threshold for GC (12%) -XX:MaxMetaspaceSize=* : Class metadata max [unlimited] (13%) -XX:MetaspaceSize=* : Class metadata threshold for GC (7%) 15
16 Garbage Collector Diagnostics -Xloggc:* : Log GC events to a file, which sets... (23%) -XX:+PrintGC, -verbose:gc : Log at a basic level (18%) -XX:+PrintGCDetails : Log at a detailed level (19%) -XX:+PrintGCTimeStamps : Include relative timestamp (18%) -XX:+PrintGCDateStamps : Include absolute timestamp (16%) -XX:+PrintHeapAtGC : Include more heap detail (10%) -XX:+PrintTenuringDistribution : Include post-gc tenure summary (8%) -XX:+PrintGCApplicationStoppedTime : Log safepoint time (6%) 16
17 -XX:+PrintGC (-Xloggc:*, -verbose:gc) Java HotSpot(TM) 64-Bit Server VM ( b01) for bsd-amd64 JRE (1.8.0_144-b01), built on Jul :07:42 by "java_re" with gcc (Based on Apple Inc. build 5658) (LLVM build ) Memory: 4k page, physical k(780800k free) /proc/meminfo: CommandLine flags: -XX:MaxHeapSize= XX:MaxNewSize= XX:+PrintGC -XX:+PrintGCTimeStamps -XX:SurvivorRatio=1 -XX:TargetSurvivorRatio=2 -XX:+UseParallelGC 1.087: [GC (Allocation Failure) 58880K->8704K(466432K), secs] 1.515: [GC (Allocation Failure) 67584K->12147K(466432K), secs] 2.197: [GC (Allocation Failure) 71027K->19407K(466432K), secs] 2.644: [GC (Allocation Failure) 78287K->31108K(525312K), secs] 4.221: [GC (Metadata GC Threshold) K->18311K(525312K), secs] 4.232: [Full GC (Metadata GC Threshold) 18311K->17905K(525312K), secs] 17
18 -XX:+PrintTenuringDistribution 1.112: [GC (Allocation Failure) Desired survivor size bytes, new threshold 7 (max 15) 58880K->8719K(466432K), secs] 1.627: [GC (Allocation Failure) Desired survivor size bytes, new threshold 7 (max 15) 67599K->12121K(466432K), secs] 2.368: [GC (Allocation Failure) Desired survivor size bytes, new threshold 7 (max 15) 71001K->19519K(466432K), secs] 2.808: [GC (Allocation Failure) Desired survivor size bytes, new threshold 7 (max 15) 78399K->31713K(525312K), secs] 4.377: [GC (Metadata GC Threshold) Desired survivor size bytes, new threshold 6 (max 15) K->18620K(525312K), secs] 4.388: [Full GC (Metadata GC Threshold) 18620K->18060K(525312K), secs] 18
19 -XX:+PrintGCDetails 1.076: [GC (Allocation Failure) [ PSYoungGen: 58880K->8689K(116736K)] 58880K->8689K(466432K), sec s] [Times: user=0.01 sys=0.00, real=0.01 secs] 1.601: [GC (Allocation Failure) [PSYoungGen: 67569K->12219K(116736K)] 67569K->12219K(466432K), s ecs] [Times: user=0.02 sys=0.00, real=0.01 secs] 2.248: [GC (Allocation Failure) [PSYoungGen: 71099K->19431K(116736K)] 71099K->19431K(466432K), secs] [Times: user=0.03 sys=0.01, real=0.01 secs] 2.667: [GC (Allocation Failure) [PSYoungGen: 78311K->31397K(175616K)] 78311K->31397K(525312K), secs] [Times: user=0.04 sys=0.01, real=0.03 secs] 4.247: [GC (Metadata GC Threshold) [PSYoungGen: K->18470K(175616K)] K->18470K(525312K), secs] [Times: user=0.02 sys=0.00, real=0.01 secs] 4.259: [Full GC (Metadata GC Threshold) [PSYoungGen: 18470K->0K(175616K)] [ParOldGen: 0K->17922K(349696K)] 18470K->17922K(525312K), [Metaspace: 20851K->20847K( K)], secs] [Times: user=0.11 sys=0.01, real=0.04 secs] 19
20 -XX:+PrintHeapAtGC {Heap before GC invocations=2 (full 0): PSYoungGen total K, used 67610K [0x b , 0x baa80000, 0x c ) eden space 58880K, 100% used [0x b ,0x b ,0x b ) from space 57856K, 15% used [0x b ,0x b42069b0,0x b ) to space 57856K, 0% used [0x b ,0x b ,0x baa80000) ParOldGen total K, used 0K [0x , 0x , 0x b ) object space K, 0% used [0x ,0x ,0x ) Metaspace used 16469K, capacity 16654K, committed 16768K, reserved K class space used 2078K, capacity 2139K, committed 2176K, reserved K 1.553: [GC (Allocation Failure) 67610K->11771K(466432K), secs] Heap after GC invocations=2 (full 0): PSYoungGen total K, used 11771K [0x b , 0x be400000, 0x c ) eden space 58880K, 0% used [0x b ,0x b ,0x b ) from space 57856K, 20% used [0x b ,0x b7d7ed80,0x baa80000) to space 57856K, 0% used [0x b ,0x b ,0x b ) ParOldGen total K, used 0K [0x , 0x , 0x b ) object space K, 0% used [0x ,0x ,0x ) Metaspace used 16469K, capacity 16654K, committed 16768K, reserved K class space used 2078K, capacity 2139K, committed 2176K, reserved K } 20
21 Garbage Collector Diagnostics (Files) -XX:+UseGCLogFileRotation (8%) -XX:NumberOfGCLogFiles=* (9%) -XX:GCLogFileSize=* (9%) 21
22 Heap Dump -XX:+HeapDumpOnOutOfMemoryError : hprof heap dump (20%) -XX:HeapDumpPath=* : Path and file name for.hprof file (20%) Analyze hprof file with VisualVM, jhat, or your favorite profiler 22
: Optimized for low pause (28%) G1: Low pause and high throughput (12%) Serial GC: Good for batch processes")
23 Choosing an Alternate Garbage Collector ParallelGC: Optimized for throughput (60% default) CMS (Concurrent Mark Sweep): Optimized for low pause (28%) G1: Low pause and high throughput (12%) Serial GC: Good for batch processes 23
24 Other Optimizations -XX:+UseCompressedOops : Compress 64-bit ordinary object pointers (12%) -XX:+DisableExplicitGC : Ignore System.gc() (11%) -XX:+AggressiveOpts : Use experimental runtime optimizations (5%) -XX:-OmitStackTraceInFastThrow [5] : Java 5 JIT optimization (7%) -XX:-TieredCompilation [7-] : Use simple JIT compilation (5%) 24
25 What about the least used options? -ea, -enableassertions (<1%) Watch for typos! Quoting/spacing Use proper key-value delimiter: :, =,, etc. Case sensitive JVM won t always warn that these are ignored Watch for multiple with the same key! (Last one wins) 25

26 Test and Monitor the Effects! -XX:SurvivorRatio=1 [v 8] -XX:TargetSurvivorRatio=2 [v 50] -XX:MaxNewSize=256M [v ergo] 26
27 Conclusion People want diagnostics, especially for object allocation and collection Know your garbage collector. Go to CON4479 this afternoon. Consider this MOOC. Defaults are good! Test and monitor your option changes. 27

28 Bonus Content! Crunching the Docker Numbers Full details 28
 spin up more")
29 Glamour Stats New Relic has been using and monitoring containers since 2014 Monitored 418 million containers in the last two years Monitor 1.5 million containers average a day Average customer has more than 800 containers running at any given moment Our top ten customers (by Docker container usage) spin up more than 92,000 containers a day 29
 Java (31%) Ruby (29%) Node (28%) Python (11%).")
30 Java and Docker Docker is used on all kinds of applications: PHP (33%) Java (31%) Ruby (29%) Node (28%) Python (11%).NET (8%) 30
31 Docker Growth Average Number of Containers Average # of containers per company for the year Greatest number of containers in a single day for a single company Greatest number of containers in a year for a single company 28,000 1, ,000 4,800,000 31
 * Average life of containers running less than an hour: 10 minutes (2015) to 8 minutes (2016).")
32 Pets to Cattle to Bacteria * Average life of containers: 13 hours (2015) to 9.25 hours (2016) * Average life of containers running less than an hour: 10 minutes (2015) to 8 minutes (2016). * 20% of all containers run for less than one minute. 32
33 Conclusions Container usage continues to grow From VM replacement to ephemeral Paradigms are shifting 33
34 fin This page is intentionally left blank 34
Life s Too Short... for Cloud without Analytics Monitoring the Dynamic Nature of Cloud Computing
 Life s Too Short... for Cloud without Analytics Monitoring the Dynamic Nature of Cloud Computing 2016, Amazon Web Services, Inc. or its Affiliates. All rights reserved. Safe Harbor This document and the
10/26/2017 Universal Java GC analysis tool - Java Garbage collection log analysis made easy
 Analysis Report GC log le: atlassian-jira-gc-2017-10-26_0012.log.0.current Duration: 14 hrs 59 min 51 sec System Time greater than User Time In 25 GC event(s), 'sys' time is greater than 'usr' time. It's
Das Leben ist zu kurz
 Das Leben ist zu kurz... für Cloudnutzung ohne Softwareanalyse Überwachen Sie Ihr dynamische Cloud Umgebung Christian Nink, Head of SMB Central Europe at New Relic 30, Juni 2016 2016, Amazon Web Services,
Lesson 2 Dissecting Memory Problems
 Lesson 2 Dissecting Memory Problems Poonam Parhar JVM Sustaining Engineer Oracle Agenda 1. Symptoms of Memory Problems 2. Causes of Memory Problems 3. OutOfMemoryError messages 3 Lesson 2-1 Symptoms of
Do Your GC Logs Speak To You
 Do Your GC Logs Speak To You Visualizing CMS, the (mostly) Concurrent Collector Copyright 2012 Kodewerk Ltd. All rights reserved About Me Consultant (www.kodewerk.com) performance tuning and training seminar
JVM Memory Model and GC
 JVM Memory Model and GC Developer Community Support Fairoz Matte Principle Member Of Technical Staff Java Platform Sustaining Engineering, Copyright 2015, Oracle and/or its affiliates. All rights reserved.
Java Performance Tuning
 443 North Clark St, Suite 350 Chicago, IL 60654 Phone: (312) 229-1727 Java Performance Tuning This white paper presents the basics of Java Performance Tuning and its preferred values for large deployments
Troubleshooting Memory Problems in Java Applications
 Troubleshooting Memory Problems in Java Applications Poonam Parhar Consulting Member of Technical Staff JVM Sustaining Engineer, Oracle Safe Harbor Statement The following is intended to outline our general
IBM Cognos ReportNet and the Java Heap
 Proven Practice IBM Cognos ReportNet and the Java Heap Product(s): IBM Cognos ReportNet, IBM Cognos 8 Area of Interest: Performance 2 Copyright Copyright 2008 Cognos ULC (formerly Cognos Incorporated).
Garbage collection. The Old Way. Manual labor. JVM and other platforms. By: Timo Jantunen
 Garbage collection By: Timo Jantunen JVM and other platforms In computer science, garbage collection (gc) can mean few different things depending on context and definition. In this post, it means "freeing
Unified JVM Logging in JDK 9
 Unified JVM Logging in JDK 9 Marcus Larsson Senior Member of Technical Staf Oracle, HotSpot Runtime Team September, 2016 Safe Harbor Statement The following is intended to outline our general product direction.
Java Application Performance Tuning for AMD EPYC Processors
 Java Application Performance Tuning for AMD EPYC Processors Publication # 56245 Revision: 0.70 Issue Date: January 2018 Advanced Micro Devices 2018 Advanced Micro Devices, Inc. All rights reserved. The
Java Performance Tuning and Optimization Student Guide
 Java Performance Tuning and Optimization Student Guide D69518GC10 Edition 1.0 June 2011 D73450 Disclaimer This document contains proprietary information and is protected by copyright and other intellectual
Java & Coherence Simon Cook - Sales Consultant, FMW for Financial Services
 Java & Coherence Simon Cook - Sales Consultant, FMW for Financial Services with help from Adrian Nakon - CMC Markets & Andrew Wilson - RBS 1 Coherence Special Interest Group Meeting 1 st March 2012 Presentation
Attila Szegedi, Software
 Attila Szegedi, Software Engineer @asz Everything I ever learned about JVM performance tuning @twitter Everything More than I ever wanted to learned about JVM performance tuning @twitter Memory tuning
5348 Vegas Drive Las Vegas, NV 89108, U.S.A. Tel: ; Fax: Website:
 The information in this document includes certain "forward-looking" statements within the meaning of the Safe Harbor provisions of Federal Securities Laws, as that term is defined in section 27a of the
G1 Garbage Collector Details and Tuning. Simone Bordet
 G1 Garbage Collector Details and Tuning Who Am I - @simonebordet Lead Architect at Intalio/Webtide Jetty's HTTP/2, SPDY and HTTP client maintainer Open Source Contributor Jetty, CometD, MX4J, Foxtrot,
HBase Practice At Xiaomi.
 HBase Practice At Xiaomi huzheng@xiaomi.com About This Talk Async HBase Client Why Async HBase Client Implementation Performance How do we tuning G1GC for HBase CMS vs G1 Tuning G1GC G1GC in XiaoMi HBase
Java Memory Management. Märt Bakhoff Java Fundamentals
 Java Memory Management Märt Bakhoff Java Fundamentals 0..206 Agenda JVM memory Reference objects Monitoring Garbage collectors ParallelGC GGC 2/44 JVM memory Heap (user objects) Non-heap Stack (per thread:
JVM Troubleshooting MOOC: Troubleshooting Memory Issues in Java Applications
 JVM Troubleshooting MOOC: Troubleshooting Memory Issues in Java Applications Poonam Parhar JVM Sustaining Engineer Oracle Lesson 1 HotSpot JVM Memory Management Poonam Parhar JVM Sustaining Engineer Oracle
Java Platform, Standard Edition HotSpot Virtual Machine Garbage Collection Tuning Guide. Release 10
 Java Platform, Standard Edition HotSpot Virtual Machine Garbage Collection Tuning Guide Release 10 E92394-01 March 2018 Java Platform, Standard Edition HotSpot Virtual Machine Garbage Collection Tuning
Fundamentals of GC Tuning. Charlie Hunt JVM & Performance Junkie
 Fundamentals of GC Tuning Charlie Hunt JVM & Performance Junkie Who is this guy? Charlie Hunt Currently leading a variety of HotSpot JVM projects at Oracle Held various performance architect roles at Oracle,
Lesson 3 Diagnostic Data Collection and Analysis tools
 Lesson 3 Diagnostic Data Collection and Analysis tools Poonam Parhar JVM Sustaining Engineer Oracle Agenda Diagnostic Data, Data Collection and Analysis tools 1. Java Heap Memory Issues 2. OutOfMemoryError
Garbage Collection. Hwansoo Han
 Garbage Collection Hwansoo Han Heap Memory Garbage collection Automatically reclaim the space that the running program can never access again Performed by the runtime system Two parts of a garbage collector
2011 Oracle Corporation and Affiliates. Do not re-distribute!
 How to Write Low Latency Java Applications Charlie Hunt Java HotSpot VM Performance Lead Engineer Who is this guy? Charlie Hunt Lead JVM Performance Engineer at Oracle 12+ years of
The Garbage-First Garbage Collector
 The Garbage-First Garbage Collector Tony Printezis, Sun Microsystems Paul Ciciora, Chicago Board Options Exchange #TS-9 Trademarks And Abbreviations (to get them out of the way...) Java Platform, Standard
Java Performance: The Definitive Guide
 Java Performance: The Definitive Guide Scott Oaks Beijing Cambridge Farnham Kbln Sebastopol Tokyo O'REILLY Table of Contents Preface ix 1. Introduction 1 A Brief Outline 2 Platforms and Conventions 2 JVM
Misusing the Type System. for. Ian PNSQC 2015
 Misusing the Type System for & Ian Dees @undees PNSQC 2015 Brewing for Maintainability Our contaminants: Memory leaks Crashes Failing regression tests Poor Data corruption repeatability Security breaches
The Fundamentals of JVM Tuning
 The Fundamentals of JVM Tuning Charlie Hunt Architect, Performance Engineering Salesforce.com sfdc_ppt_corp_template_01_01_2012.ppt In a Nutshell What you need to know about a modern JVM to be effective
Java Performance Tuning From A Garbage Collection Perspective. Nagendra Nagarajayya MDE
 Java Performance Tuning From A Garbage Collection Perspective Nagendra Nagarajayya MDE Agenda Introduction To Garbage Collection Performance Problems Due To Garbage Collection Performance Tuning Manual
MODULE 1 JAVA PLATFORMS. Identifying Java Technology Product Groups
 MODULE 1 JAVA PLATFORMS Identifying Java Technology Product Groups Java SE Platform Versions Year Developer Version (JDK) Platform 1996 1.0 1 1997 1.1 1 1998 1.2 2 2000 1.3 2 2002 1.4 2 2004 1.5 5 2006
Java Platform, Standard Edition JRockit to HotSpot Migration Guide. Release 9
 Java Platform, Standard Edition JRockit to HotSpot Migration Guide Release 9 E76287-05 October 2017 Java Platform, Standard Edition JRockit to HotSpot Migration Guide, Release 9 E76287-05 Copyright 1995,
Java Garbage Collection Best Practices For Tuning GC
 Neil Masson, Java Support Technical Lead Java Garbage Collection Best Practices For Tuning GC Overview Introduction to Generational Garbage Collection The tenured space aka the old generation The nursery
Java Platform, Standard Edition JRockit to HotSpot Migration Guide. Release 10
 Java Platform, Standard Edition JRockit to HotSpot Migration Guide Release 10 E91473-01 March 2018 Java Platform, Standard Edition JRockit to HotSpot Migration Guide, Release 10 E91473-01 Copyright 1995,
Part I Garbage Collection Modeling: Progress Report
 Part I Garbage Collection Modeling: Progress Report Peter Libič Department of Distributed and Dependable Systems http://d3s.mff.cuni.cz CHARLES UNIVERSITY PRAGUE Faculty of Mathematics and Physics Last
Towards High Performance Processing in Modern Java-based Control Systems. Marek Misiowiec Wojciech Buczak, Mark Buttner CERN ICalepcs 2011
 Towards High Performance Processing in Modern Java-based Control Systems Marek Misiowiec Wojciech Buczak, Mark Buttner CERN ICalepcs 2011 Performance with soft real time Distributed system - Monitoring
JRockit to HotSpot Migration Guide Release 8
 [1]Java Platform, Standard Edition JRockit to HotSpot Migration Guide Release 8 E63235-01 June 2015 Java Platform, Standard Edition JRockit to HotSpot Migration Guide, Release 8 E63235-01 Copyright 1995,
Generational Garbage Collection Theory and Best Practices
 Chris Bailey, Java Support Architect Generational Garbage Collection Theory and Best Practices Overview Introduction to Generational Garbage Collection The nursery space aka the young generation The tenured
JBoss Performance Tuning. Bill Meyer JBoss Sr. Solutions Architect
 JBoss Performance Tuning Bill Meyer JBoss Sr. Solutions Architect bill@redhat.com JVM Memory Tuning JVM Heap Total JVM Heap Major Collection Young Generation Minor Collection Old Generation Eden Survivor
JVM Performance Study Comparing Java HotSpot to Azul Zing Using Red Hat JBoss Data Grid
 JVM Performance Study Comparing Java HotSpot to Azul Zing Using Red Hat JBoss Data Grid Legal Notices JBoss, Red Hat and their respective logos are trademarks or registered trademarks of Red Hat, Inc.
NG2C: Pretenuring Garbage Collection with Dynamic Generations for HotSpot Big Data Applications
 NG2C: Pretenuring Garbage Collection with Dynamic Generations for HotSpot Big Data Applications Rodrigo Bruno Luis Picciochi Oliveira Paulo Ferreira 03-160447 Tomokazu HIGUCHI Paper Information Published
Debugging Your Production JVM TM Machine
 Debugging Your Production JVM TM Machine Ken Sipe Perficient (PRFT) kensipe@gmail.com @kensipe Abstract > Learn the tools and techniques used to monitor, trace and debugging running Java applications.
Typical Issues with Middleware
 Typical Issues with Middleware HrOUG 2016 Timur Akhmadeev October 2016 About Me Database Consultant at Pythian 10+ years with Database and Java Systems Performance and Architecture OakTable member 3 rd
Exploiting the Behavior of Generational Garbage Collector
 Exploiting the Behavior of Generational Garbage Collector I. Introduction Zhe Xu, Jia Zhao Garbage collection is a form of automatic memory management. The garbage collector, attempts to reclaim garbage,
Runtime Application Self-Protection (RASP) Performance Metrics
 Performance Metrics") Product Analysis June 2016 Runtime Application Self-Protection (RASP) Performance Metrics Virtualization Provides Improved Security Without Increased Overhead Highly accurate. Easy to install. Simple to
Product Analysis June 2016 Runtime Application Self-Protection (RASP) Performance Metrics Virtualization Provides Improved Security Without Increased Overhead Highly accurate. Easy to install. Simple to
JDK 9/10/11 and Garbage Collection
 JDK 9/10/11 and Garbage Collection Thomas Schatzl Senior Member of Technical Staf Oracle JVM Team May, 2018 thomas.schatzl@oracle.com Copyright 2017, Oracle and/or its afliates. All rights reserved. 1
MEMORY MANAGEMENT HEAP, STACK AND GARBAGE COLLECTION
 MEMORY MANAGEMENT HEAP, STACK AND GARBAGE COLLECTION 2 1. What is the Heap Size: 2 2. What is Garbage Collection: 3 3. How are Java objects stored in memory? 3 4. What is the difference between stack and
Running class Timing on Java HotSpot VM, 1
 Compiler construction 2009 Lecture 3. A first look at optimization: Peephole optimization. A simple example A Java class public class A { public static int f (int x) { int r = 3; int s = r + 5; return
Windows Java address space
 Windows Java address space This article applies to the IBM 32-bit SDK and Runtime Environment for Windows, Java2 Technology Edition. It explains how the process space for Java is divided and explores a
J2EE Performance Tuning. Jayesh Patel Northern Virginia Java/BEA User Group January 11 th, 2005.
 J2EE Performance Tuning Jayesh Patel Northern Virginia Java/BEA User Group January 11 th, 2005. Presenter s Bio. Jayesh Patel currently works on EDS s TWAI project and responsible for J2EE application
The Z Garbage Collector An Introduction
 The Z Garbage Collector An Introduction Per Lidén & Stefan Karlsson HotSpot Garbage Collection Team FOSDEM 2018 Safe Harbor Statement The following is intended to outline our general product direction.
OS-caused Long JVM Pauses - Deep Dive and Solutions
 OS-caused Long JVM Pauses - Deep Dive and Solutions Zhenyun Zhuang LinkedIn Corp., Mountain View, California, USA https://www.linkedin.com/in/zhenyun Zhenyun@gmail.com 2016-4-21 Outline q Introduction
Kris Mok, Software Engineer, 莫枢 / 撒迦
 Kris Mok, Software Engineer, Taobao @rednaxelafx 莫枢 / 撒迦 JVM @ Taobao Agenda Customization Tuning JVM @ Taobao Open Source Training INTRODUCTION Java Strengths Good abstraction Good performance Good tooling
JVM Performance Tuning with respect to Garbage Collection(GC) policies for WebSphere Application Server V6.1 - Part 1
 policies for WebSphere Application Server V6.1 - Part 1") IBM Software Group JVM Performance Tuning with respect to Garbage Collection(GC) policies for WebSphere Application Server V6.1 - Part 1 Giribabu Paramkusham Ajay Bhalodia WebSphere Support Technical Exchange
IBM Software Group JVM Performance Tuning with respect to Garbage Collection(GC) policies for WebSphere Application Server V6.1 - Part 1 Giribabu Paramkusham Ajay Bhalodia WebSphere Support Technical Exchange
How to keep capacity predictions on target and cut CPU usage by 5x
 How to keep capacity predictions on target and cut CPU usage by 5x Lessons from capacity planning a Java enterprise application Kansas City, Sep 27 2016 Stefano Doni stefano.doni@moviri.com @stef3a linkedin.com/in/stefanodoni
Java Technologies. Lecture IV. Valdas Rapševičius
 Preparation of the material was supported by the project Increasing Internationality in Study Programs of the Department of Computer Science II, project number VP1 2.2 ŠMM-07-K-02-070, funded by The European
JVM Performance Study Comparing Oracle HotSpot and Azul Zing Using Apache Cassandra
 JVM Performance Study Comparing Oracle HotSpot and Azul Zing Using Apache Cassandra Legal Notices Apache Cassandra, Spark and Solr and their respective logos are trademarks or registered trademarks of
Concurrent Garbage Collection
 Concurrent Garbage Collection Deepak Sreedhar JVM engineer, Azul Systems Java User Group Bangalore 1 @azulsystems azulsystems.com About me: Deepak Sreedhar JVM student at Azul Systems Currently working
SPECjAppServer2002 Statistics. Methodology. Agenda. Tuning Philosophy. More Hardware Tuning. Hardware Tuning.
 Scaling Up the JBoss Application Server. Peter Johnson JBoss World 2005 March 1, 2005 Conclusion Configuration. 8-CPU ES7000 (32-bit) SPECjAppServer 2002 JBoss Application Server 3.2.6 Unisys JVM 1.4.1_07
Enabling Java in Latency Sensitive Environments
 Enabling Java in Latency Sensitive Environments Gil Tene, CTO & co-founder, Azul Systems 2011 Azul Systems, Inc. High level agenda Intro, jitter vs. JITTER Java in a low latency application world The (historical)
Enabling Java-based VoIP backend platforms through JVM performance tuning
 Enabling Java-based VoIP backend platforms through JVM performance tuning (Bruno Van Den Bossche, Filip De Turck, April 3rd 2006) 3 April, 2006, 1 Outline Introduction Java 4 Telecom Evaluation Setup Hardware
The Z Garbage Collector Scalable Low-Latency GC in JDK 11
 The Z Garbage Collector Scalable Low-Latency GC in JDK 11 Per Lidén (@perliden) Consulting Member of Technical Staff Java Platform Group, Oracle October 24, 2018 Safe Harbor Statement The following is
SDK/RTE for Debian Linux on Intel Itanium Processors Release Notes
 SDK/RTE 1.4.2.09 for Debian Linux on Intel Itanium Processors Release Notes HP Part Number: 5900-1453 Published: December 2010 Edition: 1.0 Copyright 2010 Hewlett-Packard Development Company, L.P. Legal
Compiler construction 2009
 Compiler construction 2009 Lecture 3 JVM and optimization. A first look at optimization: Peephole optimization. A simple example A Java class public class A { public static int f (int x) { int r = 3; int
The Z Garbage Collector Low Latency GC for OpenJDK
 The Z Garbage Collector Low Latency GC for OpenJDK Per Lidén & Stefan Karlsson HotSpot Garbage Collection Team Jfokus VM Tech Summit 2018 Safe Harbor Statement The following is intended to outline our
The G1 GC in JDK 9. Erik Duveblad Senior Member of Technical Staf Oracle JVM GC Team October, 2017
 The G1 GC in JDK 9 Erik Duveblad Senior Member of Technical Staf racle JVM GC Team ctober, 2017 Copyright 2017, racle and/or its affiliates. All rights reserved. 3 Safe Harbor Statement The following is
PARAMETERS Options may be in any order. For a discussion of parameters which apply to a specific option, see OPTIONS below.
 NAME java Java interpreter SYNOPSIS java [ options ] class [ argument... ] java [ options ] jar file.jar [ argument... ] PARAMETERS Options may be in any order. For a discussion of parameters which apply
Java Garbage Collection. Carol McDonald Java Architect Sun Microsystems, Inc.
 Java Garbage Collection Carol McDonald Java Architect Sun Microsystems, Inc. Speaker Carol cdonald: > Java Architect at Sun Microsystems > Before Sun, worked on software development of: >Application to
JVM Memory Management and ColdFusion Log Analysis
 JVM Memory Management and ColdFusion Log Analysis Posted At : September 9, 2010 5:24 PM Posted By : Steven Erat Related Categories: Java, Quality Assurance, ColdFusion, Computer Technology The following
Red Hat JBoss Enterprise Application Platform 7.1
 Red Hat JBoss Enterprise Application Platform 7.1 Performance Tuning Guide For Use with Red Hat JBoss Enterprise Application Platform 7.1 Last Updated: 2018-07-11 Red Hat JBoss Enterprise Application
SAP ENTERPRISE PORTAL. Scalability Study - Windows
 SAP NetWeaver SAP ENTERPRISE PORTAL Scalability Study - Windows ABOUT SAP ENTERPRISE PORTAL ABOUT THIS STUDY SAP Enterprise Portal is a key component of the SAP NetWeaver platform. SAP Enterprise Portal
Java Without the Jitter
 TECHNOLOGY WHITE PAPER Achieving Ultra-Low Latency Table of Contents Executive Summary... 3 Introduction... 4 Why Java Pauses Can t Be Tuned Away.... 5 Modern Servers Have Huge Capacities Why Hasn t Latency
Sustainable Memory Use Allocation & (Implicit) Deallocation (mostly in Java)
 Deallocation (mostly in Java)") COMP 412 FALL 2017 Sustainable Memory Use Allocation & (Implicit) Deallocation (mostly in Java) Copyright 2017, Keith D. Cooper & Zoran Budimlić, all rights reserved. Students enrolled in Comp 412 at Rice
COMP 412 FALL 2017 Sustainable Memory Use Allocation & (Implicit) Deallocation (mostly in Java) Copyright 2017, Keith D. Cooper & Zoran Budimlić, all rights reserved. Students enrolled in Comp 412 at Rice
Sat 1/6/2018 JAVA (JVM) MEMORY MODEL MEMORY MANAGEMENT IN JAVA... 3 WHERE STORAGE LIVES... 3
 MEMORY MODEL MEMORY MANAGEMENT IN JAVA... 3 WHERE STORAGE LIVES... 3") JAVA (JVM) MEMORY MODEL MEMORY MANAGEMENT IN JAVA... 3 1 WHERE STORAGE LIVES... 3 TYPES... 3 HIGH-PRECISION NUMBERS... 4 JAVA (JVM) MEMORY MODEL... 5 MEMORY MANAGEMENT IN JAVA YOUNG GENERATION... 5 MEMORY
JAVA (JVM) MEMORY MODEL MEMORY MANAGEMENT IN JAVA... 3 1 WHERE STORAGE LIVES... 3 TYPES... 3 HIGH-PRECISION NUMBERS... 4 JAVA (JVM) MEMORY MODEL... 5 MEMORY MANAGEMENT IN JAVA YOUNG GENERATION... 5 MEMORY
High Performance Java Technology in a Multi-Core World
 High Performance Java Technology in a Multi-Core World David Dagastine Paul Hohensee VM Technologies Sun Microsystems, Inc. http://java.sun.com TS-2885 2007 JavaOne SM Conference Session TS-2885 What To
Welcome to the session...
 Welcome to the session... Copyright 2013, Oracle and/or its affiliates. All rights reserved. 02/22/2013 1 The following is intended to outline our general product direction. It is intended for information
New Java performance developments: compilation and garbage collection
 New Java performance developments: compilation and garbage collection Jeroen Borgers @jborgers #jfall17 Part 1: New in Java compilation Part 2: New in Java garbage collection 2 Part 1 New in Java compilation
generate-jvm-report shows the threads, classes, memory, and loggers for a given target instance. Name Synopsis
 Name Synopsis Description Options generate-jvm-report shows the threads, classes, memory, and loggers for a given target instance. generate-jvm-report [--help] [ --type =summary memory class thread log]
CS Computer Systems. Lecture 8: Free Memory Management
 CS 5600 Computer Systems Lecture 8: Free Memory Management Recap of Last Week Last week focused on virtual memory Gives each process the illusion of vast, empty memory Offers protection and isolation 31
Zing Vision. Answering your toughest production Java performance questions
 Zing Vision Answering your toughest production Java performance questions Outline What is Zing Vision? Where does Zing Vision fit in your Java environment? Key features How it works Using ZVRobot Q & A
ADM505. Oracle Database Administration COURSE OUTLINE. Course Version: 15 Course Duration: 3 Day(s)
") ADM505 Oracle Database Administration. COURSE OUTLINE Course Version: 15 Course Duration: 3 Day(s) SAP Copyrights and Trademarks 2016 SAP SE or an SAP affiliate company. All rights reserved. No part of
ADM505 Oracle Database Administration. COURSE OUTLINE Course Version: 15 Course Duration: 3 Day(s) SAP Copyrights and Trademarks 2016 SAP SE or an SAP affiliate company. All rights reserved. No part of
DS10. Data Services - Platform and Transforms COURSE OUTLINE. Course Version: 15 Course Duration: 3 Day(s)
") DS10 Data Services - Platform and Transforms. COURSE OUTLINE Course Version: 15 Course Duration: 3 Day(s) SAP Copyrights and Trademarks 2017 SAP SE or an SAP affiliate company. All rights reserved. No
DS10 Data Services - Platform and Transforms. COURSE OUTLINE Course Version: 15 Course Duration: 3 Day(s) SAP Copyrights and Trademarks 2017 SAP SE or an SAP affiliate company. All rights reserved. No
Kodewerk. Java Performance Services. The War on Latency. Reducing Dead Time Kirk Pepperdine Principle Kodewerk Ltd.
 Kodewerk tm Java Performance Services The War on Latency Reducing Dead Time Kirk Pepperdine Principle Kodewerk Ltd. Me Work as a performance tuning freelancer Nominated Sun Java Champion www.kodewerk.com
1. Mark-and-Sweep Garbage Collection
 Due: Tuesday, April 21, 2015. 11:59pm (no extensions). What to submit: A tar ball containing the files: Slide.java, slide.png or slide.pdf with your slide, benchmark.template, and any file(s) containing
JVM and application bottlenecks troubleshooting
 JVM and application bottlenecks troubleshooting How to find problems without using sophisticated tools Daniel Witkowski, EMEA Technical Manager, Azul Systems Daniel Witkowski - About me IT consultant and
Oracle Developer Studio 12.6
 Oracle Developer Studio 12.6 Oracle Developer Studio is the #1 development environment for building C, C++, Fortran and Java applications for Oracle Solaris and Linux operating systems running on premises
Tech Data s Acquisition of Avnet Technology Solutions
 Tech Data s Acquisition of Avnet Technology Solutions Creating a Premier Global IT Distributor: From the Data Center to the Living Room September 19, 2016 techdata.com 1 Forward-Looking Statements Safe
This presentation and the documents incorporated by reference herein contain forward-looking statements regarding future events and our future
 This presentation and the documents incorporated by reference herein contain forward-looking statements regarding future events and our future results that are subject to the safe harbor provisions of
Version 6.x Deployment Note. Performance Tuning Guide
 Version 6.x Deployment Note Performance Tuning Guide 2012 Ping Identity Corporation. All rights reserved. PingFederate Performance Tuning Guide Version 2.0 October, 2012 About Development and Deployment
Vendavo Tuning Guide
 Release: 8.2 Document Revision: 1 Publication Date: December 2015 If you have questions or comments about Vendavo documentation, do not hesitate to contact us at VendavoDoc@vendavo.com. Also visit the
Dynamic Vertical Memory Scalability for OpenJDK Cloud Applications
 Dynamic Vertical Memory Scalability for OpenJDK Cloud Applications Rodrigo Bruno, Paulo Ferreira: INESC-ID / Instituto Superior Técnico, University of Lisbon Ruslan Synytsky, Tetiana Fydorenchyk: Jelastic
Designing experiments Performing experiments in Java Intel s Manycore Testing Lab
 Designing experiments Performing experiments in Java Intel s Manycore Testing Lab High quality results that capture, e.g., How an algorithm scales Which of several algorithms performs best Pretty graphs
Understanding Java Garbage Collection
 Understanding Java Garbage Collection and what you can do about it A presentation to the New York Java Special Interest Group March 27, 2014 Matt Schuetze, Director of Product Management Azul Systems This
THE TROUBLE WITH MEMORY
 THE TROUBLE WITH MEMORY OUR MARKETING SLIDE Kirk Pepperdine Authors of jpdm, a performance diagnostic model Co-founded Building the smart generation of performance diagnostic tooling Bring predictability
SAP EarlyWatch Alert. SAP HANA Deployment Best Practices Active Global Support, SAP AG 2015
 SAP EarlyWatch Alert SAP HANA Deployment Best Practices Active Global Support, SAP AG 2015 Learning Objectives of this Presentation After completing this presentation, you will be able to: Understand the
Insight Case Studies. Tuning the Beloved DB-Engines. Presented By Nithya Koka and Michael Arnold
 Insight Case Studies Tuning the Beloved DB-Engines Presented By Nithya Koka and Michael Arnold Who is Nithya Koka? Senior Hadoop Administrator Project Lead Client Engagement On-Call Engineer Cluster Ninja
Contents. Created by: Raúl Castillo
 Contents 1. Introduction... 3 2. he garbage collector... 3 3. Some concepts regarding to garbage collection... 4 4. ypes of references in Java... 7 5. Heap based on generations... 9 6. Garbage collection
Finally! Real Java for low latency and low jitter
 Finally! Real Java for low latency and low jitter Gil Tene, CTO & co-founder, Azul Systems High level agenda Java in a low latency application world Why Stop-The-World is a problem (Duh?) Java vs. actual,
Tuning Performance of Oracle WebLogic Server 12c (12.2.1)
") [1]Oracle Fusion Middleware Tuning Performance of Oracle WebLogic Server 12c (12.2.1) E55161-02 February 2016 This document is for people who monitor performance and tune the components in a WebLogic Server
[1]Oracle Fusion Middleware Tuning Performance of Oracle WebLogic Server 12c (12.2.1) E55161-02 February 2016 This document is for people who monitor performance and tune the components in a WebLogic Server
Garbage Collection (aka Automatic Memory Management) Douglas Q. Hawkins. Why?
 Douglas Q. Hawkins. Why?") Garbage Collection (aka Automatic Memory Management) Douglas Q. Hawkins http://www.dougqh.net dougqh@gmail.com Why? Leaky Abstraction 2 of 3 Optimization Flags Are For Memory Management Unfortunately,
Garbage Collection (aka Automatic Memory Management) Douglas Q. Hawkins http://www.dougqh.net dougqh@gmail.com Why? Leaky Abstraction 2 of 3 Optimization Flags Are For Memory Management Unfortunately,