Pandas plotting capabilities
|
|
|
- Harold Ellis
- 5 years ago
- Views:
Transcription
1 Pandas plotting capabilities Pandas built-in capabilities for data visualization it's built-off of matplotlib, but it's baked into pandas for easier usage. It provides the basic statistic plot types. Let's take again the mortgage example in the file train.csv ( import pandas as pd import numpy as np loan_data = pd.read_csv("train.csv", index_col="loan_id") loan_data.head() Now say that you want to make a histogram of the column 'LoanAmount'. You can find all the possible matplotlib output on the gallery page Call the appropriate method with: loan_data['loanamount'].plot.hist() As you can see the default binning it's not very descriptive in our case, so let's change some parameter
![loan_data['loanamount'].plot.](/docs-images/82/86763293/images/2-7.jpg "hist(bins=40) If the default appearance seems to you quite dull, you can change it using a stylesheet import")
2 loan_data['loanamount'].plot.hist(bins=40) If the default appearance seems to you quite dull, you can change it using a stylesheet import matplotlib.pyplot as plt plt.style.use('ggplot') loan_data['loanamount'].plot.hist(bins=40)
 loan_data.")

3 Now we want to compare the distribution of ApplicantIncome by Loan_Status: loan_data.boxplot(column="applicantincome",by="loan_status") loan_data.hist(column="applicantincome",by="loan_status",bins=30) It seems that the Income is not a big deciding factor on its own, as there is no appreciable difference between the people who received and were denied the loan
4 Seaborn If you want to use advanced plotting features you can import seaborn in your code. Seaborn is a Python visualization library based on matplotlib. It provides a high-level interface for drawing attractive statistical graphics. Here: you can find an extensive examples gallery about what you can obtain from it. Generally speaking: 1. scatter plots help you to understand relation between two continuous variables. 2. box-plot helps you to find outliers in your data. 3. Histogram helps you find spread of the data when continuous. 4. Correlation plot helps you learn correlation with variables. 5. Barplot helps you to understand relation between your continous and categorical variable.
 impute_grps = loan_data.")
![pivot_table(values=["loanamount"], index=["gender","married","self_employed"], aggfunc=np.](/docs-images/82/86763293/images/5-4.jpg "mean) loan_data['loanamount'].fillna(value=(impute_grps.")
![loc[tuple([loan_data['gende r'][0], loan_data['married'][0], loan_data['self_employed'][0]])][0]), inplace=true)](/docs-images/82/86763293/images/5-5.jpg "loan_data['gender'].fillna(value=(loan_data['gender'].mode())[0], inplace=true) loan_data['married'].")
5 import seaborn as sns import pandas as pd import numpy as np loan_data = pd.read_csv("train.csv", index_col="loan_id") impute_grps = loan_data.pivot_table(values=["loanamount"], index=["gender","married","self_employed"], aggfunc=np.mean) loan_data['loanamount'].fillna(value=(impute_grps.loc[tuple([loan_data['gende r'][0], loan_data['married'][0], loan_data['self_employed'][0]])][0]), inplace=true) loan_data['gender'].fillna(value=(loan_data['gender'].mode())[0], inplace=true) loan_data['married'].fillna(value=(loan_data['married'].mode())[0], inplace=true) loan_data['self_employed'].fillna(value=(loan_data['self_employed'].mode())[0 ], inplace=true) sns.countplot(x='loan_status',data=loan_data)

6 This is a simple count of the categorical column 'Loan_Status'. But let's insert a distinction between people with or without a credit history: the plot will tell us that it's high advisable to have a credit history if you want a loan sns.countplot(x='loan_status',hue='credit_history',data=loan_data)

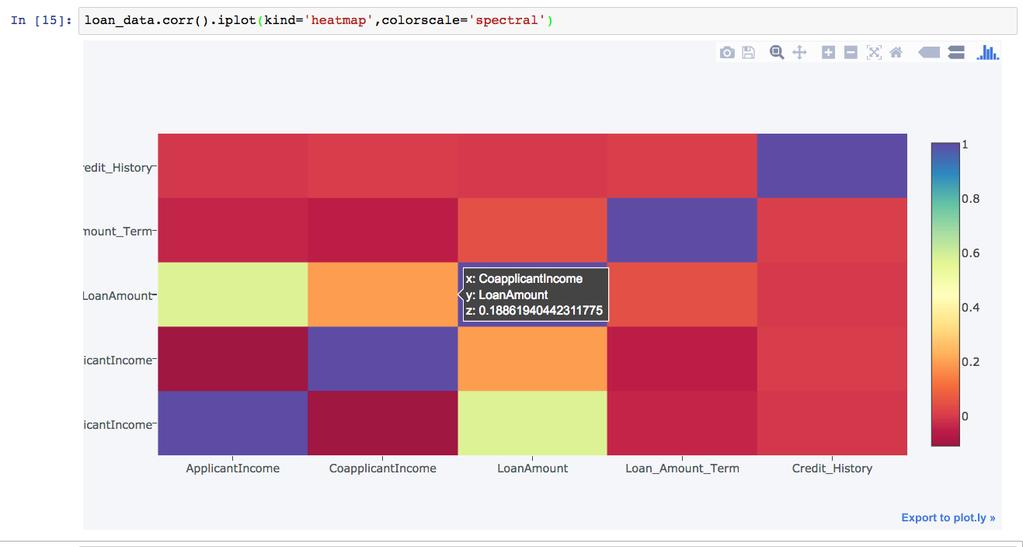
7 With the corr() function you can obtain a matrix formed by a pairwise correlation of numerical columns, excluding nan values, that can give a useful "first look" about the data: sns.heatmap(loan_data.corr(),cmap='coolwarm',annot=true)
 g = g.map(plt.")
8 FacetGrid is the general way to create grids of plots based off of a feature: import matplotlib.pyplot as plt g = sns.facetgrid(loan_data, col="married", row="education",hue="gender") g = g.map(plt.hist, "LoanAmount")
 salaries=pd.read_csv(\"salaries.csv\", index_col='id') salaries.head() sns.")
9 Now let's reload the kaggle dataset salaries.csv: we will see other types of seaborn data visualization ( salaries=pd.read_csv("salaries.csv", index_col='id') salaries.head() sns.jointplot(x='basepay',y='benefits',data=salaries,kind='scatter') #try reg,hex, kde
![sns.rugplot(salaries["totalpaybenefits"]) sns.kdeplot(salaries["totalpaybenefits"]) rugplots just draw a dash mark for every point on a univariate distribution.](/docs-images/82/86763293/images/10-4.jpg "They are the building block of a KDE (Kernel Density Estimator ) plot.")
10 sns.rugplot(salaries["totalpaybenefits"]) sns.kdeplot(salaries["totalpaybenefits"]) rugplots just draw a dash mark for every point on a univariate distribution. They are the building block of a KDE (Kernel Density Estimator ) plot. These KDE plots replace every single observation with a Gaussian (Normal) distribution centered around that value.

11 sns.boxplot(x="year", y="totalpaybenefits",data=salaries,palette='rainbow') The box shows the quartiles of the dataset while the whiskers extend to show the rest of the distribution, except for points that are determined to be outliers using a method that is a function of the inter-quartile range.

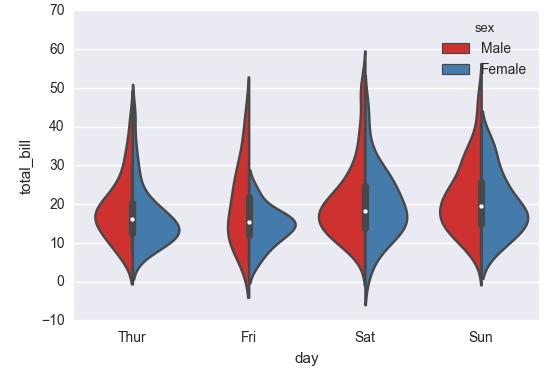
12 sns.violinplot(x="year", y="totalpaybenefits",data=salaries,palette='magma') A violin plot shows the distribution of quantitative data across several levels of one (or more) categorical variables such that those distributions can be compared. Unlike a box plot, in which all of the plot components correspond to actual datapoints, the violin plot features a kernel density estimation of the underlying distribution.
![lm = sns.lmplot(x='applicantincome',y='loanamount',data=loan_data,palette='coolwarm') axes=lm.axes axes[0,0].](/docs-images/82/86763293/images/13-5.jpg "set_xlim(0,20000) lmplot allows you to display linear models, but it also conveniently allows you to split up those plots based off of features, as")
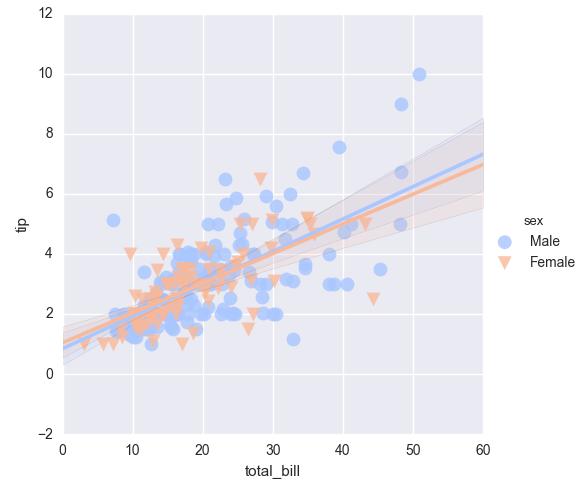
13 lm = sns.lmplot(x='applicantincome',y='loanamount',data=loan_data,palette='coolwarm') axes=lm.axes axes[0,0].set_xlim(0,20000) lmplot allows you to display linear models, but it also conveniently allows you to split up those plots based off of features, as well as coloring the hue based off of features.

14 Plotly and Cufflinks Plotly is a library that allows you to create interactive plots that you can use in dashboards or websites (you can save them as html files or static images). Cufflinks is a library that allows you to call plots directly off of a pandas dataframe. To see directly the generated plots we will use Jupyter notebook, that Anaconda has installed for you These libraries are not currently available through conda but are available through pip. So you have to install pip in Anaconda, and use it to install them: conda install pip pip install plotly pip install cufflinks
15 Use a terminal CLI to write the following command: jupyter notebook The default browser will be opened with a file browser of the directory from which you have issued the command. With this browser you can open a previously saved Jupiter notebook file, or you can create a new notebook with the "New" button on the right: Select the Python [conda root] and a new tab will be opened with the familiar IPython prompt
16 If you type a command and press Enter the code cell will enter a new line: to execute the code you must press Shift+Enter Plotly is open-source, but you need to tell it that you're working offline. As you can see on the site there is a corresponding company that makes money hosting your visualizations and dashboards. The site hosts a great gallery of examples.
17

18
19
20
21 If you want to use this library in IPython you can save the interactive plots on a file and then use plot() fig = dataframe.iplot(kind='bar',asfigure=true) plot(fig)
 You can find in the references the page on github that hosts them.")
 Feel free to experiment with all the available datasets.")
22 Exercises! Seaborn comes with the possibility to load a dataset from an online repository (requires internet), with the function load_dataset(string). You can obtain the list of available datasets with get_dataset_names() You can find in the references the page on github that hosts them. import seaborn as sns %matplotlib inline sns.get_dataset_names() tips = sns.load_dataset('tips') tips.head() Feel free to experiment with all the available datasets. For our exercises you must use the tips dataset, that gives 244 record about the customers of a restaurant. Your job will be to reproduce the plot shown in the following pages:


23


24
25
26 Exercise On Kaggle you can find a database that contains the 911 calls of the Montgomery County, PA. The file is downloaded for you and you can find it here: Explore the data, and build a heatmap of the number of calls per Hour and Day of Week, showing clearly that between 16:00 and 17:00 there is a maximum. Montgomery County, locally also referred to as Montco, is a county located in the Commonwealth of Pennsylvania. As of the 2010 census, the population was 799,874, making it the third-most populous county in Pennsylvania, after Philadelphia and Allegheny Counties. The county seat is Norristown. Montgomery County is very diverse, ranging from farms and open land in Upper Hanover to densely populated rowhouse streets in Cheltenham.
27
ARTIFICIAL INTELLIGENCE AND PYTHON
 ARTIFICIAL INTELLIGENCE AND PYTHON DAY 1 STANLEY LIANG, LASSONDE SCHOOL OF ENGINEERING, YORK UNIVERSITY WHAT IS PYTHON An interpreted high-level programming language for general-purpose programming. Python
PYTHON DATA VISUALIZATIONS
 PYTHON DATA VISUALIZATIONS from Learning Python for Data Analysis and Visualization by Jose Portilla https://www.udemy.com/learning-python-for-data-analysis-and-visualization/ Notes by Michael Brothers
Certified Data Science with Python Professional VS-1442
 Certified Data Science with Python Professional VS-1442 Certified Data Science with Python Professional Certified Data Science with Python Professional Certification Code VS-1442 Data science has become
INTRODUCTION TO DATA VISUALIZATION WITH PYTHON. Visualizing Regressions
 INTRODUCTION TO DATA VISUALIZATION WITH PYTHON Visualizing Regressions Seaborn https://stanford.edu/~mwaskom/software/seaborn/ Recap: Pandas DataFrames Labelled tabular data structure Labels on rows: index
Data Science and Machine Learning Essentials
 Data Science and Machine Learning Essentials Lab 3A Visualizing Data By Stephen Elston and Graeme Malcolm Overview In this lab, you will learn how to use R or Python to visualize data. If you intend to
CSC 1315! Data Science
 CSC 1315! Data Science Data Visualization Based on: Python for Data Analysis: http://hamelg.blogspot.com/2015/ Learning IPython for Interactive Computation and Visualization by C. Rossant Plotting with
Python for Data Analysis. Prof.Sushila Aghav-Palwe Assistant Professor MIT
 Python for Data Analysis Prof.Sushila Aghav-Palwe Assistant Professor MIT Four steps to apply data analytics: 1. Define your Objective What are you trying to achieve? What could the result look like? 2.
Command Line and Python Introduction. Jennifer Helsby, Eric Potash Computation for Public Policy Lecture 2: January 7, 2016
 Command Line and Python Introduction Jennifer Helsby, Eric Potash Computation for Public Policy Lecture 2: January 7, 2016 Today Assignment #1! Computer architecture Basic command line skills Python fundamentals
Matplotlib Python Plotting
 Matplotlib Python Plotting 1 / 6 2 / 6 3 / 6 Matplotlib Python Plotting Matplotlib is a Python 2D plotting library which produces publication quality figures in a variety of hardcopy formats and interactive
Ch.1 Introduction. Why Machine Learning (ML)? manual designing of rules requires knowing how humans do it.
? manual designing of rules requires knowing how humans do it.") Ch.1 Introduction Syllabus, prerequisites Notation: Means pencil-and-paper QUIZ Means coding QUIZ Code respository for our text: https://github.com/amueller/introduction_to_ml_with_python Why Machine Learning
Ch.1 Introduction Syllabus, prerequisites Notation: Means pencil-and-paper QUIZ Means coding QUIZ Code respository for our text: https://github.com/amueller/introduction_to_ml_with_python Why Machine Learning
Conda Documentation. Release latest
 Conda Documentation Release latest August 09, 2015 Contents 1 Installation 3 2 Getting Started 5 3 Building Your Own Packages 7 4 Getting Help 9 5 Contributing 11 i ii Conda Documentation, Release latest
Data Analyst Nanodegree Syllabus
 Data Analyst Nanodegree Syllabus Discover Insights from Data with Python, R, SQL, and Tableau Before You Start Prerequisites : In order to succeed in this program, we recommend having experience working
Data Analyst Nanodegree Syllabus
 Data Analyst Nanodegree Syllabus Discover Insights from Data with Python, R, SQL, and Tableau Before You Start Prerequisites : In order to succeed in this program, we recommend having experience working
KNIME Python Integration Installation Guide. KNIME AG, Zurich, Switzerland Version 3.7 (last updated on )
") KNIME Python Integration Installation Guide KNIME AG, Zurich, Switzerland Version 3.7 (last updated on 2019-02-05) Table of Contents Introduction.....................................................................
KNIME Python Integration Installation Guide KNIME AG, Zurich, Switzerland Version 3.7 (last updated on 2019-02-05) Table of Contents Introduction.....................................................................
Python With Data Science
 Course Overview This course covers theoretical and technical aspects of using Python in Applied Data Science projects and Data Logistics use cases. Who Should Attend Data Scientists, Software Developers,
Data Science and Machine Learning Essentials
 Data Science and Machine Learning Essentials Lab 3C Evaluating Models in Azure ML By Stephen Elston and Graeme Malcolm Overview In this lab, you will learn how to evaluate and improve the performance of
Seaborn is an open source, BSD-licensed Python library providing high level API for visualizing the data using Python programming language.
 i About the Tutorial Seaborn is an open source, BSD-licensed Python library providing high level API for visualizing the data using Python programming language. Audience This tutorial takes you through
Data Acquisition and Processing
 Data Acquisition and Processing Adisak Sukul, Ph.D., Lecturer,, adisak@iastate.edu http://web.cs.iastate.edu/~adisak/bigdata/ Topics http://web.cs.iastate.edu/~adisak/bigdata/ Data Acquisition Data Processing
Episode 8 Matplotlib, SciPy, and Pandas. We will start with Matplotlib. The following code makes a sample plot.
 Episode 8 Matplotlib, SciPy, and Pandas Now that we understand ndarrays, we can start using other packages that utilize them. In particular, we're going to look at Matplotlib, SciPy, and Pandas. Matplotlib
Metview s new Python interface first results and roadmap for further developments
 Metview s new Python interface first results and roadmap for further developments EGOWS 2018, ECMWF Iain Russell Development Section, ECMWF Thanks to Sándor Kertész Fernando Ii Stephan Siemen ECMWF October
About the Tutorial. Audience. Prerequisites. Copyright & Disclaimer
 i About the Tutorial Project is a comprehensive software suite for interactive computing, that includes various packages such as Notebook, QtConsole, nbviewer, Lab. This tutorial gives you an exhaustive
COSC 490 Computational Topology
 COSC 490 Computational Topology Dr. Joe Anderson Fall 2018 Salisbury University Course Structure Weeks 1-2: Python and Basic Data Processing Python commonly used in industry & academia Weeks 3-6: Group
Data Science and Machine Learning Essentials
 Data Science and Machine Learning Essentials Lab 3B Building Models in Azure ML By Stephen Elston and Graeme Malcolm Overview In this lab, you will learn how to use R or Python to engineer or construct
Pandas and Friends. Austin Godber Mail: Source:
 Austin Godber Mail: godber@uberhip.com Twitter: @godber Source: http://github.com/desertpy/presentations What does it do? Pandas is a Python data analysis tool built on top of NumPy that provides a suite
Data Science Essentials
 Data Science Essentials Lab 2 Working with Summary Statistics Overview In this lab, you will learn how to use either R or Python to compute and understand the basics of descriptive statistics. Descriptive
STATISTICAL THINKING IN PYTHON I. Introduction to Exploratory Data Analysis
 STATISTICAL THINKING IN PYTHON I Introduction to Exploratory Data Analysis Exploratory data analysis The process of organizing, plotting, and summarizing a data set Exploratory data analysis can never
JUPYTER (IPYTHON) NOTEBOOK CHEATSHEET
 NOTEBOOK CHEATSHEET") JUPYTER (IPYTHON) NOTEBOOK CHEATSHEET About Jupyter Notebooks The Jupyter Notebook is a web application that allows you to create and share documents that contain executable code, equations, visualizations
JUPYTER (IPYTHON) NOTEBOOK CHEATSHEET About Jupyter Notebooks The Jupyter Notebook is a web application that allows you to create and share documents that contain executable code, equations, visualizations
DSC 201: Data Analysis & Visualization
 DSC 201: Data Analysis & Visualization Python and Notebooks Dr. David Koop Computer-based visualization systems provide visual representations of datasets designed to help people carry out tasks more effectively.
Parallel Computing with ipyparallel
 Lab 1 Parallel Computing with ipyparallel Lab Objective: Most computers today have multiple processors or multiple processor cores which allow various processes to run simultaneously. To perform enormous
Discrete-Event Simulation and Performance Evaluation
 Discrete-Event Simulation and Performance Evaluation 01204525 Wireless Sensor Networks and Internet of Things Chaiporn Jaikaeo (chaiporn.j@ku.ac.th) Department of Computer Engineering Kasetsart University
Python for Data Analysis
 Python for Data Analysis Wes McKinney O'REILLY 8 Beijing Cambridge Farnham Kb'ln Sebastopol Tokyo Table of Contents Preface xi 1. Preliminaries " 1 What Is This Book About? 1 Why Python for Data Analysis?
OREKIT IN PYTHON ACCESS THE PYTHON SCIENTIFIC ECOSYSTEM. Petrus Hyvönen
 OREKIT IN PYTHON ACCESS THE PYTHON SCIENTIFIC ECOSYSTEM Petrus Hyvönen 2017-11-27 SSC ACTIVITIES Public Science Services Satellite Management Services Engineering Services 2 INITIAL REASON OF PYTHON WRAPPED
Machine learning using embedpy to apply LASSO regression
 Technical Whitepaper Machine learning using embedpy to apply LASSO regression Date October 2018 Author Samantha Gallagher is a kdb+ consultant for Kx and has worked in leading financial institutions for
Acquisition Description Exploration Examination Understanding what data is collected. Characterizing properties of data.
 Summary Statistics Acquisition Description Exploration Examination what data is collected Characterizing properties of data. Exploring the data distribution(s). Identifying data quality problems. Selecting
Getting Started with Python
 Getting Started with Python A beginner course to Python Ryan Leung Updated: 2018/01/30 yanyan.ryan.leung@gmail.com Links Tutorial Material on GitHub: http://goo.gl/grrxqj 1 Learning Outcomes Python as
STA 570 Spring Lecture 5 Tuesday, Feb 1
 STA 570 Spring 2011 Lecture 5 Tuesday, Feb 1 Descriptive Statistics Summarizing Univariate Data o Standard Deviation, Empirical Rule, IQR o Boxplots Summarizing Bivariate Data o Contingency Tables o Row
Installation and Introduction to Jupyter & RStudio
 Installation and Introduction to Jupyter & RStudio CSE 4/587 Data Intensive Computing Spring 2017 Prepared by Jacob Condello 1 Anaconda/Jupyter Installation 1.1 What is Anaconda? Anaconda is a freemium
Statistics Lecture 6. Looking at data one variable
 Statistics 111 - Lecture 6 Looking at data one variable Chapter 1.1 Moore, McCabe and Craig Probability vs. Statistics Probability 1. We know the distribution of the random variable (Normal, Binomial)
Latent Semantic Analysis. sci-kit learn. Vectorizing text. Document-term matrix
 Latent Semantic Analysis Latent Semantic Analysis (LSA) is a framework for analyzing text using matrices Find relationships between documents and terms within documents Used for document classification,
Data Science and Machine Learning Essentials
 Data Science and Machine Learning Essentials Lab 4C Working with Unsupervised Learning Models By Stephen Elston and Graeme Malcolm Overview The previous labs in this course have used supervised machine
VIP Documentation. Release Carlos Alberto Gomez Gonzalez, Olivier Wertz & VORTEX team
 VIP Documentation Release 0.8.9 Carlos Alberto Gomez Gonzalez, Olivier Wertz & VORTEX team Feb 17, 2018 Contents 1 Introduction 3 2 Documentation 5 3 Jupyter notebook tutorial 7 4 TL;DR setup guide 9
DSC 201: Data Analysis & Visualization
 DSC 201: Data Analysis & Visualization Visualization Design Dr. David Koop Definition Computer-based visualization systems provide visual representations of datasets designed to help people carry out tasks
Figure 1: The PMG GUI on startup
 Statistics involves a fair number of computations that can be made much more convenient using either a calculator or a computer. Although the basic TI-83 or 84 series of calculators can do most of the
Using jupyter notebooks on Blue Waters. Roland Haas (NCSA / University of Illinois)
") Using jupyter notebooks on Blue Waters https://goo.gl/4eb7qw Roland Haas (NCSA / University of Illinois) Email: rhaas@ncsa.illinois.edu Jupyter notebooks 2/18 interactive, browser based interface to Python
Using jupyter notebooks on Blue Waters https://goo.gl/4eb7qw Roland Haas (NCSA / University of Illinois) Email: rhaas@ncsa.illinois.edu Jupyter notebooks 2/18 interactive, browser based interface to Python
Introduction to Programming
 Introduction to Programming G. Bakalli March 8, 2017 G. Bakalli Introduction to Programming March 8, 2017 1 / 33 Outline 1 Programming in Finance 2 Types of Languages Interpreters Compilers 3 Programming
Deliverable 07. Proof of Concept (Python) A COMMON, OPEN SOURCE INTERFACE BETWEEN EARTH OBSERVATION DATA INFRASTRUCTURES AND FRONT-END APPLICATIONS
 A COMMON, OPEN SOURCE INTERFACE BETWEEN EARTH OBSERVATION DATA INFRASTRUCTURES AND FRONT-END APPLICATIONS") A COMMON, OPEN SOURCE INTERFACE BETWEEN EARTH OBSERVATION DATA INFRASTRUCTURES AND FRONT-END APPLICATIONS Deliverable 07 Version 1.0 from 2018/03/27 Proof of Concept (Python) Change history Issue Date
A COMMON, OPEN SOURCE INTERFACE BETWEEN EARTH OBSERVATION DATA INFRASTRUCTURES AND FRONT-END APPLICATIONS Deliverable 07 Version 1.0 from 2018/03/27 Proof of Concept (Python) Change history Issue Date
Scientific computing platforms at PGI / JCNS
 Member of the Helmholtz Association Scientific computing platforms at PGI / JCNS PGI-1 / IAS-1 Scientific Visualization Workshop Josef Heinen Outline Introduction Python distributions The SciPy stack Julia
STA Rev. F Learning Objectives. Learning Objectives (Cont.) Module 3 Descriptive Measures
 Module 3 Descriptive Measures") STA 2023 Module 3 Descriptive Measures Learning Objectives Upon completing this module, you should be able to: 1. Explain the purpose of a measure of center. 2. Obtain and interpret the mean, median, and
STA 2023 Module 3 Descriptive Measures Learning Objectives Upon completing this module, you should be able to: 1. Explain the purpose of a measure of center. 2. Obtain and interpret the mean, median, and
Introducing Categorical Data/Variables (pp )
") Notation: Means pencil-and-paper QUIZ Means coding QUIZ Definition: Feature Engineering (FE) = the process of transforming the data to an optimal representation for a given application. Scaling (see Chs.
Notation: Means pencil-and-paper QUIZ Means coding QUIZ Definition: Feature Engineering (FE) = the process of transforming the data to an optimal representation for a given application. Scaling (see Chs.
USING JUPYTERHUB IN THE CLASSROOM: SETUP AND LESSONS LEARNED
 USING JUPYTERHUB IN THE CLASSROOM: SETUP AND LESSONS LEARNED Jeff Brown Department of Mathematics and Statistics, University of North Carolina Wilmington ABSTRACT Jupyter notebooks, formerly known as ipython
LECTURE 22. Numerical and Scientific Computing Part 2
 LECTURE 22 Numerical and Scientific Computing Part 2 MATPLOTLIB We re going to continue our discussion of scientific computing with matplotlib. Matplotlib is an incredibly powerful (and beautiful!) 2-D
Ch.1 Introduction. Why Machine Learning (ML)?
?") Syllabus, prerequisites Ch.1 Introduction Notation: Means pencil-and-paper QUIZ Means coding QUIZ Why Machine Learning (ML)? Two problems with conventional if - else decision systems: brittleness: The
Syllabus, prerequisites Ch.1 Introduction Notation: Means pencil-and-paper QUIZ Means coding QUIZ Why Machine Learning (ML)? Two problems with conventional if - else decision systems: brittleness: The
Python ecosystem for scientific computing with ABINIT: challenges and opportunities. M. Giantomassi and the AbiPy group
 Python ecosystem for scientific computing with ABINIT: challenges and opportunities M. Giantomassi and the AbiPy group Frejus, May 9, 2017 Python package for: generating input files automatically post-processing
DSC 201: Data Analysis & Visualization
 DSC 201: Data Analysis & Visualization Exploratory Data Analysis Dr. David Koop What is Exploratory Data Analysis? "Detective work" to summarize and explore datasets Includes: - Data acquisition and input
Big Data Exercises. Fall 2016 Week 0 ETH Zurich
 Big Data Exercises Fall 2016 Week 0 ETH Zurich 1. Jupyter Basics Welcome to this Jupyter notebook. Jupyter is a web-based open-source tool based on Python that allows you to run python (and other types
Converting categorical data into numbers with Pandas and Scikit-learn -...
 1 of 6 11/17/2016 11:02 AM FastML Machine learning made easy RSS Home Contents Popular Links Backgrounds About Converting categorical data into numbers with Pandas and Scikit-learn 2014-04-30 Many machine
ME30_Lab1_18JUL18. August 29, ME 30 Lab 1 - Introduction to Anaconda, JupyterLab, and Python
 ME30_Lab1_18JUL18 August 29, 2018 1 ME 30 Lab 1 - Introduction to Anaconda, JupyterLab, and Python ME 30 ReDev Team 2018-07-18 Description and Summary: This lab introduces Anaconda, JupyterLab, and Python.
windrose Documentation Lionel Roubeyrie & Sebastien Celles
 Lionel Roubeyrie & Sebastien Celles Sep 04, 2018 Contents: 1 Install 3 1.1 Requirements............................................... 3 1.2 Install latest release version via pip...................................
Lecture 3: Processing Language Data, Git/GitHub. LING 1340/2340: Data Science for Linguists Na-Rae Han
 Lecture 3: Processing Language Data, Git/GitHub LING 1340/2340: Data Science for Linguists Na-Rae Han Objectives What do linguistic data look like? Homework 1: What did you process? How does collaborating
Python: Its Past, Present, and Future in Meteorology
 Python: Its Past, Present, and Future in Meteorology 7th Symposium on Advances in Modeling and Analysis Using Python 23 January 2016 Seattle, WA Ryan May (@dopplershift) UCAR/Unidata Outline The Past What
Interactive Mode Python Pylab
 Short Python Intro Gerald Schuller, Nov. 2016 Python can be very similar to Matlab, very easy to learn if you already know Matlab, it is Open Source (unlike Matlab), it is easy to install, and unlike Matlab
Reproducibility and Extensibility in Scientific Research. Jessica Forde
 Reproducibility and Extensibility in Scientific Research Jessica Forde Project Jupyter @projectjupyter @mybinderteam Project Jupyter IPython Jupyter Notebook Architecture of JupyterHub Overview The problem
CIS192 Python Programming
 CIS192 Python Programming Machine Learning in Python Robert Rand University of Pennsylvania October 22, 2015 Robert Rand (University of Pennsylvania) CIS 192 October 22, 2015 1 / 18 Outline 1 Machine Learning
lab_03 September 20, 2016
 lab_03 September 20, 2016 1 Data mapping In this session, we will build on all we have learnt so far about loading and manipulating (spatial) data and apply it to one of the most commonly used forms of
Applied Machine Learning
 Applied Machine Learning Lab 3 Working with Text Data Overview In this lab, you will use R or Python to work with text data. Specifically, you will use code to clean text, remove stop words, and apply
DATA SCIENCE INTRODUCTION QSHORE TECHNOLOGIES. About the Course:
 DATA SCIENCE About the Course: In this course you will get an introduction to the main tools and ideas which are required for Data Scientist/Business Analyst/Data Analyst/Analytics Manager/Actuarial Scientist/Business
LAB 1 INSTRUCTIONS DESCRIBING AND DISPLAYING DATA
 LAB 1 INSTRUCTIONS DESCRIBING AND DISPLAYING DATA This lab will assist you in learning how to summarize and display categorical and quantitative data in StatCrunch. In particular, you will learn how to
Introduction to Data Science. Introduction to Data Science with Python. Python Basics: Basic Syntax, Data Structures. Python Concepts (Core)
") Introduction to Data Science What is Analytics and Data Science? Overview of Data Science and Analytics Why Analytics is is becoming popular now? Application of Analytics in business Analytics Vs Data
Introduction to Data Science What is Analytics and Data Science? Overview of Data Science and Analytics Why Analytics is is becoming popular now? Application of Analytics in business Analytics Vs Data
Scientific Computing with Python. Quick Introduction
 Scientific Computing with Python Quick Introduction Libraries and APIs A library is a collection of implementations of behavior (definitions) An Application Programming Interface (API) describes that behavior
Plotting With matplotlib
 Lab Plotting With matplotlib and Mayavi Lab Objective: Introduce some of the basic plotting functions available in matplotlib and Mayavi. -D plotting with matplotlib The Python library matplotlib will
SAS Visual Analytics 8.2: Working with Report Content
 SAS Visual Analytics 8.2: Working with Report Content About Objects After selecting your data source and data items, add one or more objects to display the results. SAS Visual Analytics provides objects
Webgurukul Programming Language Course
 Webgurukul Programming Language Course Take One step towards IT profession with us Python Syllabus Python Training Overview > What are the Python Course Pre-requisites > Objectives of the Course > Who
Lab 9 - Linear Model Selection in Python
 Lab 9 - Linear Model Selection in Python March 7, 2016 This lab on Model Validation using Validation and Cross-Validation is a Python adaptation of p. 248-251 of Introduction to Statistical Learning with
SAS Visual Analytics 8.2: Getting Started with Reports
 SAS Visual Analytics 8.2: Getting Started with Reports Introduction Reporting The SAS Visual Analytics tools give you everything you need to produce and distribute clear and compelling reports. SAS Visual
Software Preparation for Modelling Workshop
 Software Preparation for Modelling Workshop Daniel Brown, Andreas Freise University of Birmingham Issue: Date: July 27, 2017 School of Physics and Astronomy University of Birmingham Birmingham, B15 2TT
Regression III: Advanced Methods
 Lecture 3: Distributions Regression III: Advanced Methods William G. Jacoby Michigan State University Goals of the lecture Examine data in graphical form Graphs for looking at univariate distributions
M7D1.a: Formulate questions and collect data from a census of at least 30 objects and from samples of varying sizes.
 M7D1.a: Formulate questions and collect data from a census of at least 30 objects and from samples of varying sizes. Population: Census: Biased: Sample: The entire group of objects or individuals considered
RIT REST API Tutorial
 RIT User Guide Build 1.00 RIT REST API Tutorial Table of Contents Introduction... 2 Python/Environment Setup... 3 Rotman Interactive Trader Install... 3 Text Editor... 3 Python Distribution... 3 Verifying
DSC 201: Data Analysis & Visualization
 DSC 201: Data Analysis & Visualization Visualization Tools Dr. David Koop Visualization for Exploration 2 MTA Fare Data Exploration 3 MTA Fare Data Exploration 4 MTA Fare Data Exploration 5 MTA Fare Data
STA Module 2B Organizing Data and Comparing Distributions (Part II)
") STA 2023 Module 2B Organizing Data and Comparing Distributions (Part II) Learning Objectives Upon completing this module, you should be able to 1 Explain the purpose of a measure of center 2 Obtain and
STA 2023 Module 2B Organizing Data and Comparing Distributions (Part II) Learning Objectives Upon completing this module, you should be able to 1 Explain the purpose of a measure of center 2 Obtain and
STA Learning Objectives. Learning Objectives (cont.) Module 2B Organizing Data and Comparing Distributions (Part II)
 Module 2B Organizing Data and Comparing Distributions (Part II)") STA 2023 Module 2B Organizing Data and Comparing Distributions (Part II) Learning Objectives Upon completing this module, you should be able to 1 Explain the purpose of a measure of center 2 Obtain and
STA 2023 Module 2B Organizing Data and Comparing Distributions (Part II) Learning Objectives Upon completing this module, you should be able to 1 Explain the purpose of a measure of center 2 Obtain and
Python for. Data Science. by Luca Massaron. and John Paul Mueller
 Python for Data Science by Luca Massaron and John Paul Mueller Table of Contents #»» *» «»>»»» Introduction 1 About This Book 1 Foolish Assumptions 2 Icons Used in This Book 3 Beyond the Book 4 Where to
SAS and Python: The Perfect Partners in Crime
 Paper 2597-2018 SAS and Python: The Perfect Partners in Crime Carrie Foreman, Amadeus Software Limited ABSTRACT Python is often one of the first languages that any programmer will study. In 2017, Python
Practical Statistics for Particle Physics Analyses: Introduction to Computing Examples
 Practical Statistics for Particle Physics Analyses: Introduction to Computing Examples Louis Lyons (Imperial College), Lorenzo Moneta (CERN) IPMU, 27-29 March 2017 Introduction Hands-on session based on
Lab 16 - Multiclass SVMs and Applications to Real Data in Python
 Lab 16 - Multiclass SVMs and Applications to Real Data in Python April 7, 2016 This lab on Multiclass Support Vector Machines in Python is an adaptation of p. 366-368 of Introduction to Statistical Learning
Business Analytics Nanodegree Syllabus
 Business Analytics Nanodegree Syllabus Master data fundamentals applicable to any industry Before You Start There are no prerequisites for this program, aside from basic computer skills. You should be
Using the Matplotlib Library in Python 3
 Using the Matplotlib Library in Python 3 Matplotlib is a Python 2D plotting library that produces publication-quality figures in a variety of hardcopy formats and interactive environments across platforms.
Getting started with Python
 Getting started with Python (i.e. installing and testing it) 2018 From original slides by Tony Cahill What is Python? Python is a free computer language that was created in 1991 It has many add-ons (called
CircuitPython with Jupyter Notebooks
 CircuitPython with Jupyter Notebooks Created by Brent Rubell Last updated on 2018-08-22 04:08:47 PM UTC Guide Contents Guide Contents Overview What's a Jupyter Notebook? The Jupyter Notebook is an open-source
DATA VISUALIZATION. In [2]: %matplotlib inline. import numpy as np import pandas as pd. import matplotlib.pyplot as plt
![DATA VISUALIZATION. In [2]: %matplotlib inline. import numpy as np import pandas as pd. import matplotlib.pyplot as plt](/thumbs/90/102611231.jpg "DATA VISUALIZATION. In [2]: %matplotlib inline. import numpy as np import pandas as pd. import matplotlib.pyplot as plt") DATA VISUALIZATION In [2]: %matplotlib inline import numpy as np import pandas as pd import matplotlib.pyplot as plt In [3]: # CASE 1: Potasium Ion Channel Kv1.2 # the input file has been generated by
DATA VISUALIZATION In [2]: %matplotlib inline import numpy as np import pandas as pd import matplotlib.pyplot as plt In [3]: # CASE 1: Potasium Ion Channel Kv1.2 # the input file has been generated by
ipywidgets_demo July 17, Interactive widgets for the Jupyter notebook (ipywidgets)
") ipywidgets_demo July 17, 2017 1 Interactive widgets for the Jupyter notebook (ipywidgets) Maarten Breddels - Kapteyn Astronomical Institute / RuG - Groningen Material on github https://github.com/maartenbreddels/ewass-2017
ipywidgets_demo July 17, 2017 1 Interactive widgets for the Jupyter notebook (ipywidgets) Maarten Breddels - Kapteyn Astronomical Institute / RuG - Groningen Material on github https://github.com/maartenbreddels/ewass-2017
Spyder Documentation. Release 3. Pierre Raybaut
 Spyder Documentation Release 3 Pierre Raybaut Aug 31, 2017 Contents 1 Overview 3 2 Installation 5 2.1 Installing on Windows Vista/7/8/10................................... 5 2.2 Installing on MacOS X..........................................
Data Science and Machine Learning Essentials
 Data Science and Machine Learning Essentials Lab 2B Transforming Data with Scripts By Graeme Malcolm and Stephen Elston Overview In this lab, you will learn how to use Python or R to manipulate and analyze
Lecture 6: more pandas (and git/github) LING 1340/2340: Data Science for Linguists Na-Rae Han
 LING 1340/2340: Data Science for Linguists Na-Rae Han") Lecture 6: more pandas (and git/github) LING 1340/2340: Data Science for Linguists Na-Rae Han Objectives git and GitHub: Let's be more disciplined! Python's pandas library Tools: Git and GitHub Jupyter
Lecture 6: more pandas (and git/github) LING 1340/2340: Data Science for Linguists Na-Rae Han Objectives git and GitHub: Let's be more disciplined! Python's pandas library Tools: Git and GitHub Jupyter
Introduction to Computer Vision Laboratories
 Introduction to Computer Vision Laboratories Antonino Furnari furnari@dmi.unict.it www.dmi.unict.it/~furnari/ Computer Vision Laboratories Format: practical session + questions and homeworks. Material
Index. Bessel function, 51 Big data, 1. Cloud-based version-control system, 226 Containerization, 30 application, 32 virtualize processes, 30 31
 Index A Amazon Web Services (AWS), 2 account creation, 2 EC2 instance creation, 9 Docker, 13 IP address, 12 key pair, 12 launch button, 11 security group, 11 stable Ubuntu server, 9 t2.micro type, 9 10
Special Review Section. Copyright 2014 Pearson Education, Inc.
 Special Review Section SRS-1--1 Special Review Section Chapter 1: The Where, Why, and How of Data Collection Chapter 2: Graphs, Charts, and Tables Describing Your Data Chapter 3: Describing Data Using
Bar Graphs and Dot Plots
 CONDENSED LESSON 1.1 Bar Graphs and Dot Plots In this lesson you will interpret and create a variety of graphs find some summary values for a data set draw conclusions about a data set based on graphs
Introduction to Python Part 2
 Introduction to Python Part 2 v0.2 Brian Gregor Research Computing Services Information Services & Technology Tutorial Outline Part 2 Functions Tuples and dictionaries Modules numpy and matplotlib modules
Data Mining: Exploring Data. Lecture Notes for Chapter 3
 Data Mining: Exploring Data Lecture Notes for Chapter 3 1 What is data exploration? A preliminary exploration of the data to better understand its characteristics. Key motivations of data exploration include