Using Patrol for BEA WebLogic to Accelerate the Value of WebLogic Server (WLS) Tuning Primary Tuning Considerations Execute Queues
|
|
|
- Hope Sharp
- 5 years ago
- Views:
Transcription
1 Using Patrol for BEA WebLogic to Accelerate the Value of WebLogic Server (WLS) Tuning The purpose of this paper is to explain how a customer of Patrol for BEA WebLogic from BMC Software can use the product to monitor the performance of BEA WebLogic Server (WLS). There are many BEA WebLogic performance-related configuration parameters available to the administrator who is interested in streamlining the efficiency of the Server. This paper attempts to demonstrate that focusing on a subset of those parameters will enable effective and rapid tuning and produce improved application throughput. The tuning information presented in this paper is based upon: a) WebLogic Server performance recommendations and instructions from BEA Systems as described in the WebLogic Server Performance and Tuning Guide; b) field observations with customers; c) experimentation in a lab environment; d) Course material from BEA Education Services Administration of BEA WebLogic Server; e) Java documentation from Sun Microsystems. This paper is meant to be complementary documentation to the Patrol for BEA WebLogic User Guide. Primary Tuning Considerations Performance of a WebLogic Server system is rated by its response time, latency, and throughput. Four main considerations, if carefully handled, will deliver information that can be used by administrators to provide stability and improve application throughput. These are: Execute Queues JVM Heap size JDBC Connection Pool efficiencies JMS Server throughput Execute Queues Consider those times when you and four hundred other travelers are queued up for Customs inspection at a major international airport. You observe there are only twelve inspection booths open out of twenty-two. The question that simmers in the minds of people is why don t they simply open the other booths? Like any other workflow process the airport customs procedure is not only dependent upon properly configured resource settings at that point (i.e. the number of inspectors), it is also linked and dependent
2 upon other properly configured resource settings for processes downstream. Too many inspection booths open can cause a backlog at some secondary step (i.e. mechanical processes such as escalators, secondary customs inspections, baggage handling, etc.). At London s Heathrow Airport, for example, the crush of passengers necessitates a tight control over the flow via staffed checkpoints at a variety of other locations aside from just the customs inspection point. The various checkpoints communicate with each other to ensure an orderly flow of passengers. If one checkpoint were to process passengers at too quick a rate, it would cause a backlog somewhere else in the facility. To increase the flow of travelers through the customs checkpoints will certainly provide immediate relief for passengers but will not necessarily decrease the total time it takes one to reach the departure gate. WebLogic things to remember - #1: Use the Execute Queues not just as a means to segregate applications. Use them as levers to control the flow of requests that the WebLogic Server must handle within the context of other work that the Server must perform. The role of the WebLogic Execute Queues is to act as a conduit for work that needs to be executed by the WebLogic Application Server. Too much throughput through too many Execute Queues could have a deleterious effect on Server performance. Because WebLogic Server performance is only as good as how well the JVM performs and if the JVM is not properly sized, WebLogic Server will not be able to handle the incoming work requests. Each work request uses a thread that is invoked from an execution queue. Threads consume memory. Too many threads can mean too much of the JVM s available memory is used consequently forcing the Server to perform needless I/O. Administrators need to treat Execute Queues as throttles or levers for controlling the performance of the WebLogic Application Server. Additionally, the work that needs to be executed can and probably should be categorized according to applications or the criticality of the tasks, thus providing an even stronger method for controlling the flow of work to be performed but down to the application level. In the airport analogy, this level of service would be delivered through the creation of separate queues to expedite passage for frequent pre-authorized travelers or flight crews. Expediting the processing of trusted passengers optimizes the available resources (inspectors) by making them more readily available to deal with those passengers who require more time for processing. Similarly, through careful settings within WebLogic the Execute Queues can be managed to optimize the throughput of trusted applications. Use the Patrol s BEAWLS_EXEC_QUEUE application class to report on the various Execute Queues.

3 Execute Queues interoperate with the WebLogic Server through the use of threads. Threads carry the requests that need to be executed by the application server. Close examination of the Execute Queues will provide an administrator with the information necessary to properly configure the maximum number of threads available for specific applications. Therefore, the administrator can control the throttle of the Execute Queues by controlling the number of threads assigned to each queue. My WebLogic implementation (lab) has four Application Server instances defined, each with its own set of Execute Queues. In the sample graph on the next page, I generated activity using the PetStore application that is shipped with BEA WebLogic, and that runs on the PetStore application server that is also shipped with the product. I signed in to the online store, loaded up my shopping cart, checked out, signed out, registered and signed in as a new customer, shopped for more pets, reviewed what I had selected and updated the amount, and finally checked out again. I inspected the Patrol console to see what was reported for that last five minutes of activity by the Execution Queue Throughput parameter. Execute Queues do not discriminate between objects so they handle all types of requests being submitted to the application server. Therefore, the queues will contain numbers that relate to all objects that need to be processed by the Application Server (EJBs, Servlets, JSPs, etc.). The graph can therefore display very high numbers, more than the user might think for what the application seems to deliver.

4 One can see that the shopping activity of a single user drove the throughput rate from zero to 1000 in a very brief period of time. That type of activity burst is very common in the Internet commerce world and administrators need to understand not only the nature of the application but also how WebLogic Server is designed. An understanding of the architecture will inform the administrator of how Execute Queues interoperate and are interdependent with other WebLogic Server components. As stated earlier, Execute Queues consume memory through the use of threads. Allocating a large number of threads for applications with the goal of improving application performance could have an unintended adverse affect. Threads that are simply waiting for work (known as Idle Threads) will rob the server of valuable memory thus degrading overall server performance. This is another reason why it is important to report on the Execute Queues. The administrator must not only consider facilitating individual application throughput, they must also be mindful of how that effort affects the performance of WebLogic Server as a whole. From a monitoring perspective, it would be helpful to be able to compare the activity levels of various Execute Queues that operate with a specific WebLogic Server instance. In the example below, I used the Patrol console and dragged and dropped three separate parameters for Idle Execute Thread Count from three Execute Queues and dropped them into the same graph. The resulting combined graph provides the administrator with a comparative view of how well the three queues are being used in relation to each other. A high Idle Thread Count relative to the others (meaning that the queue is not busy) should indicate that the number of threads for that queue could be scaled back or perhaps the queue should be eliminated entirely and all that application s

5 work be sent through the default Execution Queue. To be certain the administrator should only base this determination on a day s worth of data. Applications will typically report varying levels of activity throughout a 24-hour period. This simple graph can result in a reclaiming of memory thus making it available to other WebLogic components. WebLogic things to remember - #2: Look for high volume rates and a low Idle Thread Count through the Execution Queue for they signal a well-optimized queue. JVM HEAP Size WebLogic Server runs in an instance of the Java Virtual Machine. The JVM executes bytecodes in Java class files. JVM Heap size is the amount of memory used by the WebLogic Server on that CPU. Memory is the fundamental method that transaction managers, database managers, and application servers employ to deliver speedy response time. By caching frequently used objects in memory, WebLogic Server delivers quick request turnaround because it satisfies application data and object requirements by finding what it needs in memory without having to incur the overhead associated with I/O to disk. It is a double-edged sword though. Too much memory allocated to the
6 JVM will seriously degrade the application server s performance because it will make memory unavailable to other memory-dependent components (Execute Queues, connection pools). Conversely, if not enough memory is allocated to the JVM, WebLogic performance will suffer as too much time will be spent executing I/O to refresh data rather than being able to find the necessary objects in memory or cache. I/O means slower response time. This is a critical performance consideration and striking an ongoing balance is the best method for improving the overall performance of WebLogic Server. WebLogic things to remember - #3: A high value for the HeapSize parameter should be the first clue for the administrator to look for a) too much garbage in the JVM or; b) high activity rates for the Execute Queues and/or; c) high activity through the JMS Server. Adjusting garbage collection intervals, or the number of threads assigned to the Execute Queues, or the number of messages handled by the JMS Server may result in lower Heap Size use by the JVM without having to resort to increasing the amount of memory allocated to the JVM. What causes garbage to build up in the WebLogic JVM? In order to deliver optimal throughput and response time WebLogic uses memory to store frequently used objects. These objects will stay in memory even after the applications that called them are no longer active. An object is therefore considered garbage when there are no pointers to it from a running program. If memory is left unattended it will quickly fill and WebLogic Server will not be able to deliver the expected service. Therefore, periodic garbage collection is something that WebLogic executes to clear the JVM of objects that are no longer required. The administrator has the capability to tune the interval time between collections. WebLogic things to remember - #4: The goal of tuning heap size is to minimize the time that your JVM spends doing garbage collection while maximizing the number of clients that WebLogic Server can handle at a given time. Garbage collection is resource intensive for the WebLogic server, greatly degrading performance when it occurs. An optimally tuned Heap size will either minimize the frequency of garbage collection or shorten the time it takes to do the collection thus freeing the WebLogic server to be available to service more clients. Larger heap sizes mean less frequent collections but they will run longer; smaller heap sizes mean more frequent collections that run faster. Both strategies have their advantages. The following two graphs provide information regarding the health of the JVM Heap space. The first, Free JVM Heap Size, enables a WebLogic administrator to monitor whether the JVM is optimally configured at certain times of the day. If the graph shows


7 the free space is trending towards a very low number (5% is the default low value) it indicates that WebLogic is at risk of running out of memory and will need to resort to performing I/O to satisfy requests. As stated, I/O is very expensive in terms of time and resources. The next graph shows the total amount of heap used by WebLogic and all its applications. Careful monitoring of this information will enable an administrator to deliver a highly tuned WebLogic environment. Thresholds should be set to warn and alert when the Heap space used exceeds a certain amount for a certain period of time. Again, the goal of JVM Heap space monitoring is to strike a balance between the amount of memory allocated to WebLogic and the amount it actually uses. Although Patrol for BEA WebLogic has a KM command to perform garbage collection, this action should be avoided unless full garbage collection is required. See the graph
")
8 immediately below and the amount of memory reclaimed after the garbage collection action was invoked from the Patrol console. I triggered garbage collection here Setting up automated garbage collection based on accurate thresholds is a critical consideration since the alternative (manual triggering of garbage collection) can have severe consequences for WebLogic Server performance. BEA WebLogic Server exploits the Java 1.3 JVM HotSpot capability called Generational Garbage Collection. With that feature, garbage collection is performed based on the lifetime of an object. Whereas when manual collection is triggered the JVM will examine ALL objects in the Heap to determine which ones are dead and should be removed. This has a seriously negative effect on WebLogic Server performance because it will halt processing while collection occurs. Generational Garbage Collection on the other hand divides objects into Young and Old. The Young category is further divided into Eden and two Survivor spaces. New objects are created in the Eden space and when garbage collection occurs, those objects are copied into one of the two survivor spaces. When the next collection occurs, those objects are copied into the next survivor space. This process continues until the JVM Heap Size exceeds a predefined threshold at which point the objects are moved into the Old category. The advantage of Generational Garbage Collection is that the actual process of garbage collection is quicker because unlike regular garbage collection, it does not examine each object in the JVM. When Generational Garbage Collection is employed, WebLogic Server performs much of that analysis in advance of the collection and only the Old category is
9 cleared by the garbage collection. This is a much faster and less-resource intensive process than the pre-hotspot method. With that information in mind it is critical that the garbage collection rate be monitored to ensure that the frequency is sufficient to replenish memory before the JVM resorts to executing I/O to satisfy requests. The Patrol for BEA WebLogic user can monitor garbage collection rates through the Garbage Collection Count and the Garbage Collection Time parameters within the BEAWLS_JVMPROFILER application class. Note from Peter: Here I would like to add graphs showing the parameters mentioned above as well as corresponding graphs showing the impact that those garbage collections had on the JVM Heap Size. Connection Pools Java Database Connectivity (JDBC) is a standard Java API that allows developers to write database applications and execute SQL. Unfortunately, making JDBC connections with a database management system can be very slow. If an application requires multiple connections and they are repeatedly opened and closed, performance will be compromised. Connection Pools alleviate this problem by maintaining a pool of connections that are made when WebLogic Server is started. Physical connections are made and are available in the pool when applications request them. After they finish using the connection, the application will return the connection to the pool for reuse. By creating the connections at the startup of the pool WebLogic saves the overhead and the time it would normally take the application to make the physical connection on its own. However, as with most other things concerning WebLogic, JDBC Connection Pools carve out a chunk of JVM memory (heap) to deliver the database connection speed the applications require. The challenge for administrators is how to accurately configure the size of the connection pools to balance the necessary throughput of the applications to the database with the amount of memory those pools are using within the JVM. The graph below shows a critical JDBC parameter that an administrator should monitor. By examining the number of application requests that are waiting for a JDBC connection (i.e. waiting for another application to return the connection to the pool), the administrator can determine if the connection pools are properly configured. If the number of waiting requests grows then it most likely indicates the need to increase the size of the pool to handle the larger volume of application requests. The same reason applies for monitoring this parameter as the previous one. An application will be adversely affected if a thread cannot make a connection to the backend database. Connection pools are critical resources within WLS and careful consideration should be

10 taken to strike a balance between fast and instantaneous throughput and memory utilization (the larger the pool the larger the memory consumption). What about less-obvious slowdowns, those that are not so readily recognized as the example just given? Consider the graph below. User activity forced a lot of requests for a connection to a database. There is normally a default login delay defined for each connection (can be configured through the WebLogic admin console or through Patrol) but if that delay grows it could indicate a problem with the database server or it could simply mean the administrator should increase the login delay to compensate for a very busy database server.
 Server.")
11 Being made aware of these types of conditions in advance of when a problem actually occurs is essentially the strength of Patrol (i.e. being notified before the connection delay is so high it slows the application down to the point where users complain or worse, give up and go elsewhere). JMS Server Customers can use Patrol for BEA WebLogic to effectively monitor the Java Messaging Service (JMS) Server. This Java messaging component of WebLogic is a facility that facilitates communication between WebLogic components and also provides bridging connectivity for other messaging systems such as IBM s WebSphere MQ and Tibco s Enterprise for JMS. JMS is based on the idea of messages flowing to and through destinations (queues in the IBM MQ world). The message flow can be controlled to ensure prompt service and to limit the number of bytes and messages processed. Again, as with the other components of WebLogic previously discussed, the JMS Server uses memory within the JVM so care must be taken to ensure a balance is achieved. Patrol for BEA WebLogic has limited functionality with respect to JMS. The product monitors this component only has deep as the JMS Server level. It cannot monitor actual destinations, subscribers, and producers. Even so, Patrol can add value in situations where it is important to be forewarned that the JMS Server is busy and approaching the aggregate parameter settings.
 level a user of the product can still draw conclusions from the above")
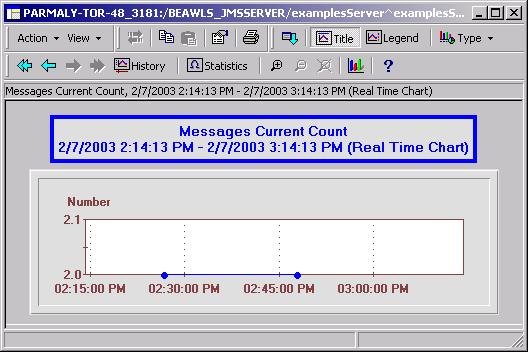
12 The Messages Received Count, shown above, can be used as a method of being forewarned when the JMS Server is experiencing an unusual spike in activity. Even though this version of Patrol for BEA WebLogic Server does not show information down to the actual Destinations (queues) level a user of the product can still draw conclusions from the above graph. For example, if over a period of time at the same time each day, the number of messages received by the JMS Server reach a certain level and at the same time the JVM Heap size reaches a dangerously low level, then it should be safe to conclude that JMS traffic is causing the JMS Server to consume a lot of memory and is therefore affecting WLS performance. Remember, if the Heap size reaches a certain low threshold WLS will begin performing I/O to satisfy requests. What can a Patrol for BEA WebLogic user do with this information? They could feel confident going into the WebLogic administrative console and establishing and configuring message flow control. Message Flow Control enables the JMS Server to tell producers of messages to slow down the flow of messages when a specific threshold has been reached. Conversely, it can tell producers to increase the flow when a specific threshold has been reached. The graph below shows the number of messages currently in the JMS Server. By monitoring this parameter a Patrol for BEA WebLogic Server user can monitor how efficient the JMS Server has been configured to handle message load. A graph that shows a consistently high number of messages might indicate a need to configure a feature called Message Paging. That feature allows JMS Server to page out persistent messages to disk at times of heavy load, thus freeing up valuable memory.
13
14 Enterprise Java Beans Section II Other Performance Considerations EJBs are fundamentally a Java specification that allows for reuse of services. Most commonly they act as bridges between the Web user and the back-end non-web components that make up the application. The nature of an EJB is to be portable and as flexible as possible so that a developer, for example, need not necessarily include code to make the service transactional. Freeing the developer from concerns centered on transactional behavior, security, and lifecycle management allows them to concentrate on implementing and improving the business logic of the application. Making changes to applications that employ EJBs is much simpler and faster because the developer can make attribute changes such as altering the transactional behavior without touching the business logic. That s the theory. Flexibility comes at a cost however. EJBs deployed with inefficient attributes can put a drag on the WebLogic Server and for that reason, monitoring their flow becomes an important performance goal. IdleBeanCount The graph below shows the number of EJBs currently idle within a pool that is managed by the Bean Container. The Bean Container provides services to EJBs, creating bean instances, managing pools of instances, and destroying them. It also handles threading, transaction support, data storage and retrieval for the beans. While a steady count of Idle Beans as shown in the graph is a normal event, a climbing graph would be a strong indicator that the container needs to destroy beans at a faster rate. A possible reason for an increased bean count is that a new application may have been deployed or an existing one modified so that the EJBs are stateful (contain session information across session restarts; a valid application method but not always necessary). This parameter should be monitored closely for anomalous conditions.

15 Caching Caching is one of the ways WebLogic Server improves response times for the application and the end user. It places user session information in memory in the form of EJBs. These session beans containing the user s session information are quickly and readily retrieved the next time the user visits that website. The administrator has control over how much session information is stored in the cache and needs to be mindful of striking a balance. From a user perspective it would be ideal if their session information was always found in the cache, thus ensuring a rapid response time when they visited the website. Isn t this the goal of IT managers? Yes it is but it is also their goal to optimize the use of WebLogic and ensure that the software is tuned to deliver the best service to all users. This means removing old session beans from the cache and to properly configure the cache size so that it does not consume too much memory of the JVM that WebLogic Server is running in. In the graph below we can see two parameters that have been combined into a single display. I dragged the CacheAccessCount parameter into the graph showing the CacheHitCount. Together they provide a visual showing the success or failure rate of how frequently the applications found the desired object in the cache (i.e. 10 access attempts resulted in 10 successful retrievals).

16
17 Summary The aim of this paper is to demonstrate that by focusing on the performance of a subset of WebLogic components, administrators of Patrol for BEA WebLogic Server can accelerate the time it takes to understand the architecture of BEA WebLogic Server to effectively tune the application server s performance. There are many more important BEA WebLogic configuration settings that are important and it is equally important to understand that Patrol for BEA WebLogic can monitor their behavior too.
White Paper. Major Performance Tuning Considerations for Weblogic Server
 White Paper Major Performance Tuning Considerations for Weblogic Server Table of Contents Introduction and Background Information... 2 Understanding the Performance Objectives... 3 Measuring your Performance
In the most general sense, a server is a program that provides information
 d524720 Ch01.qxd 5/20/03 8:37 AM Page 9 Chapter 1 Introducing Application Servers In This Chapter Understanding the role of application servers Meeting the J2EE family of technologies Outlining the major
Diagnostics in Testing and Performance Engineering
 Diagnostics in Testing and Performance Engineering This document talks about importance of diagnostics in application testing and performance engineering space. Here are some of the diagnostics best practices
Data Management in Application Servers. Dean Jacobs BEA Systems
 Data Management in Application Servers Dean Jacobs BEA Systems Outline Clustered Application Servers Adding Web Services Java 2 Enterprise Edition (J2EE) The Application Server platform for Java Java Servlets
Performance Best Practices Paper for IBM Tivoli Directory Integrator v6.1 and v6.1.1
 Performance Best Practices Paper for IBM Tivoli Directory Integrator v6.1 and v6.1.1 version 1.0 July, 2007 Table of Contents 1. Introduction...3 2. Best practices...3 2.1 Preparing the solution environment...3
WebLogic Server- Tips & Tricks for Troubleshooting Performance Issues. By: Abhay Kumar AST Corporation
 WebLogic Server- Tips & Tricks for Troubleshooting Performance Issues By: Abhay Kumar AST Corporation March 1st, 2016 Contents INTRODUCTION... 3 UNDERSTAND YOUR PERFORMANCE OBJECTIVES AND SET REALISTIC
J2EE DIAGNOSING J2EE PERFORMANCE PROBLEMS THROUGHOUT THE APPLICATION LIFECYCLE
 DIAGNOSING J2EE PERFORMANCE PROBLEMS THROUGHOUT THE APPLICATION LIFECYCLE ABSTRACT Many large-scale, complex enterprise applications are now built and deployed using the J2EE architecture. However, many
Best Practices. Deploying Optim Performance Manager in large scale environments. IBM Optim Performance Manager Extended Edition V4.1.0.
 IBM Optim Performance Manager Extended Edition V4.1.0.1 Best Practices Deploying Optim Performance Manager in large scale environments Ute Baumbach (bmb@de.ibm.com) Optim Performance Manager Development
J2EE: Best Practices for Application Development and Achieving High-Volume Throughput. Michael S Pallos, MBA Session: 3567, 4:30 pm August 11, 2003
 J2EE: Best Practices for Application Development and Achieving High-Volume Throughput Michael S Pallos, MBA Session: 3567, 4:30 pm August 11, 2003 Agenda Architecture Overview WebSphere Application Server
Enterprise J2EE Application Management
 Production Monitoring and Performance Management for BEA WebLogic Server, Portal & Integration Applications Acsera-Enterprise-J2EE-APM-04114003.doc The Agile Enterprise Adopts the J2EE Application Platform
WHITE PAPER Application Performance Management. The Case for Adaptive Instrumentation in J2EE Environments
 WHITE PAPER Application Performance Management The Case for Adaptive Instrumentation in J2EE Environments Why Adaptive Instrumentation?... 3 Discovering Performance Problems... 3 The adaptive approach...
Borland Optimizeit Enterprise Suite 6
 Borland Optimizeit Enterprise Suite 6 Feature Matrix The table below shows which Optimizeit product components are available in Borland Optimizeit Enterprise Suite and which are available in Borland Optimizeit
Java Without the Jitter
 TECHNOLOGY WHITE PAPER Achieving Ultra-Low Latency Table of Contents Executive Summary... 3 Introduction... 4 Why Java Pauses Can t Be Tuned Away.... 5 Modern Servers Have Huge Capacities Why Hasn t Latency
TUTORIAL: WHITE PAPER. VERITAS Indepth for the J2EE Platform PERFORMANCE MANAGEMENT FOR J2EE APPLICATIONS
 TUTORIAL: WHITE PAPER VERITAS Indepth for the J2EE Platform PERFORMANCE MANAGEMENT FOR J2EE APPLICATIONS 1 1. Introduction The Critical Mid-Tier... 3 2. Performance Challenges of J2EE Applications... 3
It Is a Difficult Question! The Goal of This Study. Specification. The Goal of This Study. History. Existing Benchmarks
 It Is a Difficult Question! J2EE and.net Reloaded Yet Another Performance Case Study The Middleware Company Case Study Team Presented by Mark Grechanik How to compare two functionally rich platforms? Benchmarks?
Chapter 9: Virtual Memory
 Chapter 9: Virtual Memory Silberschatz, Galvin and Gagne 2013 Chapter 9: Virtual Memory Background Demand Paging Copy-on-Write Page Replacement Allocation of Frames Thrashing Memory-Mapped Files Allocating
TOPLink for WebLogic. Whitepaper. The Challenge: The Solution:
 Whitepaper The Challenge: Enterprise JavaBeans (EJB) represents a new standard in enterprise computing: a component-based architecture for developing and deploying distributed object-oriented applications
ITERATIVE DEVELOPMENT: THE USE OF J2EE BEST PRACTICES
 TUTORIAL: WHITE PAPER VERITAS Indepth for the J2EE Platform ITERATIVE DEVELOPMENT: THE USE OF J2EE BEST PRACTICES By Owen Taylor Of The Middleware Company 1 1. Overview... 3 2. Selecting Appropriate Tools...
Java Performance Tuning
 443 North Clark St, Suite 350 Chicago, IL 60654 Phone: (312) 229-1727 Java Performance Tuning This white paper presents the basics of Java Performance Tuning and its preferred values for large deployments
Caching Use Cases in the Enterprise
 terracotta whitepaper: Caching Use Cases in the Enterprise What You Can Learn from Hundreds of Ehcache Users Around the Globe Eric J. Bruno Allure Technology, Inc www.alluretechnology.com I was recently
Rhapsody Interface Management and Administration
 Rhapsody Interface Management and Administration Welcome The Rhapsody Framework Rhapsody Processing Model Application and persistence store files Web Management Console Backups Route, communication and
WHITE PAPER: ENTERPRISE AVAILABILITY. Introduction to Adaptive Instrumentation with Symantec Indepth for J2EE Application Performance Management
 WHITE PAPER: ENTERPRISE AVAILABILITY Introduction to Adaptive Instrumentation with Symantec Indepth for J2EE Application Performance Management White Paper: Enterprise Availability Introduction to Adaptive
Chapter 1: Distributed Information Systems
 Chapter 1: Distributed Information Systems Contents - Chapter 1 Design of an information system Layers and tiers Bottom up design Top down design Architecture of an information system One tier Two tier
PATROL for BEA WebLogic User Guide. Version
 PATROL for BEA WebLogic User Guide Version 2.2.00 June 23, 2003 Copyright 2003 BMC Software, Inc., as an unpublished work. All rights reserved. BMC Software, the BMC Software logos, and all other BMC Software
Enterprise print management in VMware Horizon
 Enterprise print management in VMware Horizon Introduction: Embracing and Extending VMware Horizon Tricerat Simplify Printing enhances the capabilities of VMware Horizon environments by enabling reliable
Webcenter Application Performance Tuning guide
 Webcenter Application Performance Tuning guide Abstract This paper describe generic tuning guideline for webcenter portal, Webcenter content, JRockit, Database and Weblogic server Vinay Kumar 18-03-2014
Optimizing Parallel Access to the BaBar Database System Using CORBA Servers
 SLAC-PUB-9176 September 2001 Optimizing Parallel Access to the BaBar Database System Using CORBA Servers Jacek Becla 1, Igor Gaponenko 2 1 Stanford Linear Accelerator Center Stanford University, Stanford,
Database code in PL-SQL PL-SQL was used for the database code. It is ready to use on any Oracle platform, running under Linux, Windows or Solaris.
 Alkindi Software Technology Introduction Alkindi designed a state of the art collaborative filtering system to work well for both largeand small-scale systems. This document serves as an overview of how
Chapter 6 Enterprise Java Beans
 Chapter 6 Enterprise Java Beans Overview of the EJB Architecture and J2EE platform The new specification of Java EJB 2.1 was released by Sun Microsystems Inc. in 2002. The EJB technology is widely used
Hands-on Lab Session 9909 Introduction to Application Performance Management: Monitoring. Timothy Burris, Cloud Adoption & Technical Enablement
 Hands-on Lab Session 9909 Introduction to Application Performance Management: Monitoring Timothy Burris, Cloud Adoption & Technical Enablement Copyright IBM Corporation 2017 IBM, the IBM logo and ibm.com
Chapter 9: Virtual Memory. Operating System Concepts 9 th Edition
 Chapter 9: Virtual Memory Silberschatz, Galvin and Gagne 2013 Chapter 9: Virtual Memory Background Demand Paging Copy-on-Write Page Replacement Allocation of Frames Thrashing Memory-Mapped Files Allocating
Oracle Enterprise Manager. 1 Before You Install. System Monitoring Plug-in for Oracle Unified Directory User's Guide Release 1.0
 Oracle Enterprise Manager System Monitoring Plug-in for Oracle Unified Directory User's Guide Release 1.0 E24476-01 October 2011 The System Monitoring Plug-In for Oracle Unified Directory extends Oracle
Fundamentals of GC Tuning. Charlie Hunt JVM & Performance Junkie
 Fundamentals of GC Tuning Charlie Hunt JVM & Performance Junkie Who is this guy? Charlie Hunt Currently leading a variety of HotSpot JVM projects at Oracle Held various performance architect roles at Oracle,
Gustavo Alonso, ETH Zürich. Web services: Concepts, Architectures and Applications - Chapter 1 2
 Chapter 1: Distributed Information Systems Gustavo Alonso Computer Science Department Swiss Federal Institute of Technology (ETHZ) alonso@inf.ethz.ch http://www.iks.inf.ethz.ch/ Contents - Chapter 1 Design
Bipul Sinha, Amit Ganesh, Lilian Hobbs, Oracle Corp. Dingbo Zhou, Basavaraj Hubli, Manohar Malayanur, Fannie Mae
 ONE MILLION FINANCIAL TRANSACTIONS PER HOUR USING ORACLE DATABASE 10G AND XA Bipul Sinha, Amit Ganesh, Lilian Hobbs, Oracle Corp. Dingbo Zhou, Basavaraj Hubli, Manohar Malayanur, Fannie Mae INTRODUCTION
WebLogic JMS System Best Practices Daniel Joray Trivadis AG Bern
 WebLogic JMS System Best Practices Daniel Joray Trivadis AG Bern Keywords Weblogic, JMS, Performance, J2EE Introduction In many J2EE project the Java Message Service JMS is for exchange of information
Heap Management. Heap Allocation
 Heap Management Heap Allocation A very flexible storage allocation mechanism is heap allocation. Any number of data objects can be allocated and freed in a memory pool, called a heap. Heap allocation is
Web Serving Architectures
 Web Serving Architectures Paul Dantzig IBM Global Services 2000 without the express written consent of the IBM Corporation is prohibited Contents Defining the Problem e-business Solutions e-business Architectures
B M C S O F T W A R E, I N C. Ross Cochran Principal SW Consultant
 B M C S O F T W A R E, I N C. PATROL FOR WEBSPHERE APPLICATION SERVER ADVANCED BEST PRACTICES Ross Cochran Principal SW Consultant PAT R O L F O R W E B S P H E R E A P P L I C AT I O N S E R V E R ADVANCED
Using Automated Network Management at Fiserv. June 2012
 Using Automated Network Management at Fiserv June 2012 Brought to you by Join Group Vivit Network Automation Special Interest Group (SIG) Leaders: Chris Powers & Wendy Wheeler Your input is welcomed on
GlassFish v2.1 & Enterprise Manager. Alexis Moussine-Pouchkine Sun Microsystems
 GlassFish v2.1 & Enterprise Manager Alexis Moussine-Pouchkine Sun Microsystems 1 Some vocabulary Cluster a group a homogenous GlassFish instances administered as a whole Load-Balancing a strategy and implementation
Java Enterprise Edition
 Java Enterprise Edition The Big Problem Enterprise Architecture: Critical, large-scale systems Performance Millions of requests per day Concurrency Thousands of users Transactions Large amounts of data
Quest Central for DB2
 Quest Central for DB2 INTEGRATED DATABASE MANAGEMENT TOOLS Supports DB2 running on Windows, Unix, OS/2, OS/390 and z/os Integrated database management components are designed for superior functionality
Contents at a Glance. vii
 Contents at a Glance 1 Installing WebLogic Server and Using the Management Tools... 1 2 Administering WebLogic Server Instances... 47 3 Creating and Configuring WebLogic Server Domains... 101 4 Configuring
Internal Server Architectures
 Chapter3 Page 29 Friday, January 26, 2001 2:41 PM Chapter CHAPTER 3 Internal Server Architectures Often, it is important to understand how software works internally in order to fully understand why it
Key metrics for effective storage performance and capacity reporting
 Key metrics for effective storage performance and capacity reporting Key Metrics for Effective Storage Performance and Capacity Reporting Objectives This white paper will cover the key metrics in storage
IBM Security QRadar Deployment Intelligence app IBM
 IBM Security QRadar Deployment Intelligence app IBM ii IBM Security QRadar Deployment Intelligence app Contents QRadar Deployment Intelligence app.. 1 Installing the QRadar Deployment Intelligence app.
The G1 GC in JDK 9. Erik Duveblad Senior Member of Technical Staf Oracle JVM GC Team October, 2017
 The G1 GC in JDK 9 Erik Duveblad Senior Member of Technical Staf racle JVM GC Team ctober, 2017 Copyright 2017, racle and/or its affiliates. All rights reserved. 3 Safe Harbor Statement The following is
Servlet Performance and Apache JServ
 Servlet Performance and Apache JServ ApacheCon 1998 By Stefano Mazzocchi and Pierpaolo Fumagalli Index 1 Performance Definition... 2 1.1 Absolute performance...2 1.2 Perceived performance...2 2 Dynamic
Rapid Bottleneck Identification A Better Way to do Load Testing. An Oracle White Paper June 2008
 Rapid Bottleneck Identification A Better Way to do Load Testing An Oracle White Paper June 2008 Rapid Bottleneck Identification A Better Way to do Load Testing. RBI combines a comprehensive understanding
CS555: Distributed Systems [Fall 2017] Dept. Of Computer Science, Colorado State University
![CS555: Distributed Systems [Fall 2017] Dept. Of Computer Science, Colorado State University](/thumbs/92/108913314.jpg "CS555: Distributed Systems [Fall 2017] Dept. Of Computer Science, Colorado State University") CS 555: DISTRIBUTED SYSTEMS [THREADS] Shrideep Pallickara Computer Science Colorado State University Frequently asked questions from the previous class survey Shuffle less/shuffle better Which actions?
CS 555: DISTRIBUTED SYSTEMS [THREADS] Shrideep Pallickara Computer Science Colorado State University Frequently asked questions from the previous class survey Shuffle less/shuffle better Which actions?
Best Practices for memory management in Cast Iron 7.X
 IBM Software Group Best Practices for memory management in Cast Iron 7.X Subhashini Yegappan ( syegapp@us.ibm.com ) Software Support Engineer Shinsou (Al) Wang ( wangsh@us.ibm.com ) Software Support Engineer
Capacity Planning for Application Design
 WHITE PAPER Capacity Planning for Application Design By Mifan Careem Director - Solutions Architecture, WSO2 1. Introduction The ability to determine or forecast the capacity of a system or set of components,
<Insert Picture Here> WebLogic JMS Messaging Infrastructure WebLogic Server 11gR1 Labs
 WebLogic JMS Messaging Infrastructure WebLogic Server 11gR1 Labs Messaging Basics Built-in Best-of-Breed Messaging (JMS) Engine Years of hardening. Strong performance.
Deallocation Mechanisms. User-controlled Deallocation. Automatic Garbage Collection
 Deallocation Mechanisms User-controlled Deallocation Allocating heap space is fairly easy. But how do we deallocate heap memory no longer in use? Sometimes we may never need to deallocate! If heaps objects
J2EE Development. Course Detail: Audience. Duration. Course Abstract. Course Objectives. Course Topics. Class Format.
 J2EE Development Detail: Audience www.peaksolutions.com/ittraining Java developers, web page designers and other professionals that will be designing, developing and implementing web applications using
A Practical Approach to Balancing Application Performance and Instrumentation Information Using Symantec i 3 for J2EE
 WHITE PAPER: APPLICATION CUSTOMIZE PERFORMANCE MANAGEMENT Confidence in a connected world. A Practical Approach to Balancing Application Performance and Instrumentation Information Using Symantec i 3 for
Websphere Server 8.5 Best Practices Oracle FLEXCUBE Universal Banking Release [December] [2016]
![Websphere Server 8.5 Best Practices Oracle FLEXCUBE Universal Banking Release [December] [2016]](/thumbs/93/113919928.jpg "Websphere Server 8.5 Best Practices Oracle FLEXCUBE Universal Banking Release [December] [2016]") Websphere Server 8.5 Best Practices Oracle FLEXCUBE Universal Banking Release 12.3.0.0.0 [December] [2016] Table of Contents 1. INTRODUCTION... 1-1 1.1 BACKGROUND... 1-1 1.2 BASICS OF WEBSPHERE... 1-1
Websphere Server 8.5 Best Practices Oracle FLEXCUBE Universal Banking Release 12.3.0.0.0 [December] [2016] Table of Contents 1. INTRODUCTION... 1-1 1.1 BACKGROUND... 1-1 1.2 BASICS OF WEBSPHERE... 1-1
Chapter 8: Virtual Memory. Operating System Concepts Essentials 2 nd Edition
 Chapter 8: Virtual Memory Silberschatz, Galvin and Gagne 2013 Chapter 8: Virtual Memory Background Demand Paging Copy-on-Write Page Replacement Allocation of Frames Thrashing Memory-Mapped Files Allocating
WHITE PAPER AGILOFT SCALABILITY AND REDUNDANCY
 WHITE PAPER AGILOFT SCALABILITY AND REDUNDANCY Table of Contents Introduction 3 Performance on Hosted Server 3 Figure 1: Real World Performance 3 Benchmarks 3 System configuration used for benchmarks 3
Appendix A - Glossary(of OO software term s)
") Appendix A - Glossary(of OO software term s) Abstract Class A class that does not supply an implementation for its entire interface, and so consequently, cannot be instantiated. ActiveX Microsoft s component
Appendix A - Glossary(of OO software term s) Abstract Class A class that does not supply an implementation for its entire interface, and so consequently, cannot be instantiated. ActiveX Microsoft s component
Process- Concept &Process Scheduling OPERATING SYSTEMS
 OPERATING SYSTEMS Prescribed Text Book Operating System Principles, Seventh Edition By Abraham Silberschatz, Peter Baer Galvin and Greg Gagne PROCESS MANAGEMENT Current day computer systems allow multiple
Oracle Enterprise Manager
 Oracle Enterprise Manager System Monitoring Plug-in Installation Guide for Apache Tomcat 13.2.1.0 E73485-01 June 2016 Oracle Enterprise Manager System Monitoring Plug-in Installation Guide for Apache Tomcat,
SQL Tuning Reading Recent Data Fast
 SQL Tuning Reading Recent Data Fast Dan Tow singingsql.com Introduction Time is the key to SQL tuning, in two respects: Query execution time is the key measure of a tuned query, the only measure that matters
WebSphere Performance
 IBM WEBSPHERE WORKSHOP - LAB EXERCISE WebSphere 4.0 - Performance What This Exercise is About In this exercise you will look at some of the new performance features and tools available in WebSphere 4.0.
IBM Rational Application Developer for WebSphere Software, Version 7.0
 Visual application development for J2EE, Web, Web services and portal applications IBM Rational Application Developer for WebSphere Software, Version 7.0 Enables installation of only the features you need
BEAAquaLogic. Service Bus. MQ Transport User Guide
 BEAAquaLogic Service Bus MQ Transport User Guide Version: 3.0 Revised: February 2008 Contents Introduction to the MQ Transport Messaging Patterns......................................................
WebSphere Application Server, Version 5. What s New?
 WebSphere Application Server, Version 5 What s New? 1 WebSphere Application Server, V5 represents a continuation of the evolution to a single, integrated, cost effective, Web services-enabled, J2EE server
Chapter 2 FEATURES AND FACILITIES. SYS-ED/ Computer Education Techniques, Inc.
 Chapter 2 FEATURES AND FACILITIES SYS-ED/ Computer Education Techniques, Inc. Objectives You will learn: JDeveloper features. Java in the database. Simplified database access. IDE: Integrated Development
BEAAquaLogic. Service Bus. Native MQ Transport User Guide
 BEAAquaLogic Service Bus Native MQ Transport User Guide Version: 2.6 RP1 Revised: November 2007 Contents Introduction to the Native MQ Transport Advantages of Using the Native MQ Transport................................
Optimal Performance for your MacroView DMF Solution
 Adding Value Paper In this paper we identify 20 points to consider if you want to optimise the performance of your DMF solution. These points also apply to Message, the subset of DMF that runs in Outlook.
Java Performance: The Definitive Guide
 Java Performance: The Definitive Guide Scott Oaks Beijing Cambridge Farnham Kbln Sebastopol Tokyo O'REILLY Table of Contents Preface ix 1. Introduction 1 A Brief Outline 2 Platforms and Conventions 2 JVM
BEAWebLogic. Server. Automatic and Manual Service-level Migration
 BEAWebLogic Server Automatic and Manual Service-level Migration Version 10.3 Technical Preview Revised: March 2007 Service-Level Migration New in WebLogic Server 10.3: Automatic Migration of Messaging/JMS-Related
Chapter 9: Virtual-Memory
 Chapter 9: Virtual-Memory Management Chapter 9: Virtual-Memory Management Background Demand Paging Page Replacement Allocation of Frames Thrashing Other Considerations Silberschatz, Galvin and Gagne 2013
Data Sheet: Storage Management Veritas Storage Foundation for Oracle RAC from Symantec Manageability and availability for Oracle RAC databases
 Manageability and availability for Oracle RAC databases Overview Veritas Storage Foundation for Oracle RAC from Symantec offers a proven solution to help customers implement and manage highly available
J2EE Performance Tuning. Jayesh Patel Northern Virginia Java/BEA User Group January 11 th, 2005.
 J2EE Performance Tuning Jayesh Patel Northern Virginia Java/BEA User Group January 11 th, 2005. Presenter s Bio. Jayesh Patel currently works on EDS s TWAI project and responsible for J2EE application
IBM FileNet Content Manager 5.2. Asynchronous Event Processing Performance Tuning
 IBM FileNet Content Manager 5.2 April 2013 IBM SWG Industry Solutions/ECM IBM FileNet Content Manager 5.2 Asynchronous Event Processing Performance Tuning Copyright IBM Corporation 2013 Enterprise Content
IBM Tivoli Composite Application Manager for Microsoft Applications: Microsoft.NET Framework Agent Fix Pack 13.
 IBM Tivoli Composite Application Manager for Microsoft Applications: Microsoft.NET Framework Agent 6.3.1 Fix Pack 13 Reference IBM IBM Tivoli Composite Application Manager for Microsoft Applications:
Designing and debugging real-time distributed systems
 Designing and debugging real-time distributed systems By Geoff Revill, RTI This article identifies the issues of real-time distributed system development and discusses how development platforms and tools
ORACLE ENTERPRISE MANAGER 10g ORACLE DIAGNOSTICS PACK FOR NON-ORACLE MIDDLEWARE
 ORACLE ENTERPRISE MANAGER 10g ORACLE DIAGNOSTICS PACK FOR NON-ORACLE MIDDLEWARE Most application performance problems surface during peak loads. Often times, these problems are time and resource intensive,
Rational Application Developer 7 Bootcamp
 Rational Application Developer 7 Bootcamp Length: 1 week Description: This course is an intensive weeklong course on developing Java and J2EE applications using Rational Application Developer. It covers
Payments Weblogic JMS Configuration Oracle FLEXCUBE Payments Release [May] [2017]
![Payments Weblogic JMS Configuration Oracle FLEXCUBE Payments Release [May] [2017]](/thumbs/79/80188793.jpg "Payments Weblogic JMS Configuration Oracle FLEXCUBE Payments Release [May] [2017]") Payments Weblogic JMS Configuration Oracle FLEXCUBE Payments Release 12.4.0.0.0 [May] [2017] Table of Contents 1. INTRODUCTION... 1 1.1 PURPOSE... 1 1.2 INTRODUCTION... 1 1.3 WEBLOGIC 12C NEW FEATURES...
Payments Weblogic JMS Configuration Oracle FLEXCUBE Payments Release 12.4.0.0.0 [May] [2017] Table of Contents 1. INTRODUCTION... 1 1.1 PURPOSE... 1 1.2 INTRODUCTION... 1 1.3 WEBLOGIC 12C NEW FEATURES...
Optimizing RDM Server Performance
 TECHNICAL WHITE PAPER Optimizing RDM Server Performance A Raima Inc. Technical Whitepaper Published: August, 2008 Author: Paul Johnson Director of Marketing Copyright: Raima Inc., All rights reserved Abstract
SPECjAppServer2002 Statistics. Methodology. Agenda. Tuning Philosophy. More Hardware Tuning. Hardware Tuning.
 Scaling Up the JBoss Application Server. Peter Johnson JBoss World 2005 March 1, 2005 Conclusion Configuration. 8-CPU ES7000 (32-bit) SPECjAppServer 2002 JBoss Application Server 3.2.6 Unisys JVM 1.4.1_07
MTAT Enterprise System Integration. Lecture 2: Middleware & Web Services
 MTAT.03.229 Enterprise System Integration Lecture 2: Middleware & Web Services Luciano García-Bañuelos Slides by Prof. M. Dumas Overall view 2 Enterprise Java 2 Entity classes (Data layer) 3 Enterprise
As you learned in Chapter 1, the architectural variations you can construct using
 2 Installation and Configuration Overview As you learned in Chapter 1, the architectural variations you can construct using WebSphere Application Server V6 range from the very simple to the fairly complex.
BEAWebLogic Server. Introduction to BEA WebLogic Server and BEA WebLogic Express
 BEAWebLogic Server Introduction to BEA WebLogic Server and BEA WebLogic Express Version 10.0 Revised: March, 2007 Contents 1. Introduction to BEA WebLogic Server and BEA WebLogic Express The WebLogic
IBM InfoSphere Streams v4.0 Performance Best Practices
 Henry May IBM InfoSphere Streams v4.0 Performance Best Practices Abstract Streams v4.0 introduces powerful high availability features. Leveraging these requires careful consideration of performance related
EJB ENTERPRISE JAVA BEANS INTRODUCTION TO ENTERPRISE JAVA BEANS, JAVA'S SERVER SIDE COMPONENT TECHNOLOGY. EJB Enterprise Java
 EJB Enterprise Java EJB Beans ENTERPRISE JAVA BEANS INTRODUCTION TO ENTERPRISE JAVA BEANS, JAVA'S SERVER SIDE COMPONENT TECHNOLOGY Peter R. Egli 1/23 Contents 1. What is a bean? 2. Why EJB? 3. Evolution
IBM WebSphere Application Server V4.0. Performance. 10/02/01 Copyright 2001 IBM Corporation WS40ST11.prz Page 248 of of 28
 IBM WebSphere Application Server V4.0 Performance Page 248 of 401 1 of 28 Performance Enhancements to WebSphere V4.0 Performance Enhancement Overview Dynamic Caching of Servlets/JSPs Performance Monitoring
Operating- System Structures
 Operating- System Structures 2 CHAPTER Practice Exercises 2.1 What is the purpose of system calls? Answer: System calls allow user-level processes to request services of the operating system. 2.2 What
RED HAT ENTERPRISE LINUX. STANDARDIZE & SAVE.
 RED HAT ENTERPRISE LINUX. STANDARDIZE & SAVE. Is putting Contact us INTRODUCTION You know the headaches of managing an infrastructure that is stretched to its limit. Too little staff. Too many users. Not
Enhydra 6.2 Application Architecture. Tanja Jovanovic
 Enhydra 6.2 Application Architecture Tanja Jovanovic Table of Contents 1.Introduction...1 2. The Application Object... 2 3. The Presentation Object... 4 4. Writing Presentation Objects with XMLC... 6 5.
Algorithms for Dynamic Memory Management (236780) Lecture 4. Lecturer: Erez Petrank
 Lecture 4. Lecturer: Erez Petrank") Algorithms for Dynamic Memory Management (236780) Lecture 4 Lecturer: Erez Petrank!1 March 24, 2014 Topics last week The Copying Garbage Collector algorithm: Basics Cheney s collector Additional issues:
Algorithms for Dynamic Memory Management (236780) Lecture 4 Lecturer: Erez Petrank!1 March 24, 2014 Topics last week The Copying Garbage Collector algorithm: Basics Cheney s collector Additional issues:
Dynatrace FastPack for Liferay DXP
 Dynatrace FastPack for Liferay DXP The Dynatrace FastPack for Liferay Digital Experience Platform provides a preconfigured Dynatrace profile custom tailored to Liferay DXP environments. This FastPack contains
Chapter 8: Virtual Memory. Operating System Concepts
 Chapter 8: Virtual Memory Silberschatz, Galvin and Gagne 2009 Chapter 8: Virtual Memory Background Demand Paging Copy-on-Write Page Replacement Allocation of Frames Thrashing Memory-Mapped Files Allocating
A Technical Discussion about Search Solutions
 A Technical Discussion about Search Solutions By Alejandro Perez, Software Architect, Flaptor, Inc. In this paper we analyze several important aspects involved in defining search requirements, and discuss
Distributed Systems. Messaging and JMS Distributed Systems 1. Master of Information System Management
 Distributed Systems Messaging and JMS 1 Example scenario Scenario: Store inventory is low This impacts multiple departments Inventory Sends a message to the factory when the inventory level for a product
Part 2 (Disk Pane, Network Pane, Process Details & Troubleshooting)
") Note: This discussion is based on MacOS, 10.12.5 (Sierra). Some illustrations may differ when using other versions of macos or OS X. Credits: See the list at the end of this presentation Part 2 (Disk Pane,
Note: This discussion is based on MacOS, 10.12.5 (Sierra). Some illustrations may differ when using other versions of macos or OS X. Credits: See the list at the end of this presentation Part 2 (Disk Pane,
Migrating to the P8 5.2 Component Manager Framework
 Migrating to the P8 5.2 Component Manager Framework Contents Migrating to the P8 5.2 Component Manager Framework... 1 Introduction... 1 Revision History:... 2 Comparing the Two Component Manager Frameworks...