RTOS Debugger for ChibiOS/RT
|
|
|
- Philip Ward
- 5 years ago
- Views:
Transcription
1 RTOS Debugger for ChibiOS/RT TRACE32 Online Help TRACE32 Directory TRACE32 Index TRACE32 Documents... RTOS Debuggers... RTOS Debugger for ChibiOS/RT... 1 Overview... 3 Brief Overview of Documents for New Users... 4 Supported Versions... 4 Configuration... 5 Manual Configuration 5 Automatic Configuration 5 Quick Configuration Guide 6 Hooks & Internals in ChibiOS 6 Features... 7 Display of Kernel Resources 7 Task Stack Coverage 7 Task Related Breakpoints 8 Task Context Display 9 Dynamic Task Performance Measurement 10 Task Runtime Statistics 10 Function Runtime Statistics 11 ChibiOS specific Menu 14 ChibiOS Commands TASK.CONDvar Display condition variables 15 TASK.EVenT Display events 15 TASK.Heap Display heaps 16 TASK.MailBox Display mailboxes 16 TASK.MuTeX Display mutexes 17 TASK.Pool Display memory pools 17 TASK.Queue Display queues 18 TASK.SEMaphore Display semaphores 18 TASK.Thread Display threads 19 TASK.VTimer Display virtual timers 19 ChibiOS PRACTICE Functions RTOS Debugger for ChibiOS/RT 1
2 Frequently-Asked Questions RTOS Debugger for ChibiOS/RT 2

3 RTOS Debugger for ChibiOS/RT Version 22-Mar-2018 Overview The RTOS Debugger for ChibiOS contains special extensions to the TRACE32 Debugger. This manual describes the additional features, such as additional commands and statistic evaluations. Note the terminology: while ChibiOS talks about threads, the RTOS Debugger uses the term task. They are used interchangeable in this context. RTOS Debugger for ChibiOS/RT 3
4 Brief Overview of Documents for New Users Architecture-independent information: Debugger Basics - Training (training_debugger.pdf): Get familiar with the basic features of a TRACE32 debugger. T32Start (app_t32start.pdf): T32Start assists you in starting TRACE32 PowerView instances for different configurations of the debugger. T32Start is only available for Windows. General Commands (general_ref_<x>.pdf): Alphabetic list of debug commands. Architecture-specific information: Processor Architecture Manuals : These manuals describe commands that are specific for the processor architecture supported by your debug cable. To access the manual for your processor architecture, proceed as follows: - Choose Help menu > Processor Architecture Manual. RTOS Debuggers (rtos_<x>.pdf): TRACE32 PowerView can be extended for operating systemaware debugging. The appropriate RTOS manual informs you how to enable the OS-aware debugging. Supported Versions Currently ChibiOS/RT is supported for the following versions: Versions 2.4.x, 2.6.x, 3.0.x, 16.1.x on ARM/Cortex. RTOS Debugger for ChibiOS/RT 4
5 Configuration The TASK.CONFIG command loads an extension definition file called chibios.t32 (directory ~~/demo/<arch>/kernel/chibios ). It contains all necessary extensions. Automatic configuration tries to locate the ChibiOS internals automatically. For this purpose all symbol tables must be loaded and accessible at any time the RTOS debugger is used. If a system symbol is not available or if another address should be used for a specific system variable then the corresponding argument must be set manually with the appropriate address. This can be done by manual configuration which can require some additional arguments. If you want do use the display functions On The Fly, i.e. displaying the OS objects, while the target is running, you need to have access to memory while running. In case of a ICE or FIRE, you have to map emulation or shadow memory to the address space of all used system tables. In case of ICD, you have to enable SYStem.MemAccess or SYStem.CpuAccess (CPU dependent). Manual Configuration Manual configuration is not necessary for the ChiboOS RTOS debugger. Automatic Configuration For system resource display and analyzer functionality, you can do an automatic configuration of the RTOS debugger. For this purpose it is necessary, that all system internal symbols are loaded and accessible at any time, the RTOS debugger is used. Each of the task.config arguments can be substituted by '0', which means, that this argument will be searched and configured automatically. For a full automatic configuration, omit all arguments: TASK.CONFIG chibios.t32 If a system symbol is not available, or if another address should be used for a specific system variable, then the corresponding argument must be set manually with the appropriate address. See also the example ~~/demo/<arch>/kernel/chibios/chibios.cmm. RTOS Debugger for ChibiOS/RT 5
6 Quick Configuration Guide To get a quick access to the features of the ChibiOS debugger with your application, follow the following roadmap: 1. Start the TRACE32 Debugger. 2. Load your application as normal. 3. Execute the command TASK.CONFIG ~~/demo/<arch>/kernel/chibios/chibios.t32 (See Automatic Configuration ). 4. Execute the command MENU.ReProgram ~~/demo/<arch>/kernel/chibios/chibios.men (See ChibiOS Specific Menu ). 5. Start your application. Now you can access the ChibiOS extensions through the menu. In case of any problems, please read carefully the previous configuration chapters. Hooks & Internals in ChibiOS No hooks are used in the kernel. For retrieving the kernel data and structures, the RTOS debugger uses the global kernel symbols and structure definitions. Ensure, that access to those structures is possible, every time when features of the RTOS debugger are used. In order to display the threads list, set the Chibios configuration CH_CFG_USE_REGISTRY as TRUE. Be sure, that your application is compiled and linked with debugging symbols switched on. RTOS Debugger for ChibiOS/RT 6
7 Features The RTOS debugger for ChibiOS supports the following features. Display of Kernel Resources The extension defines new PRACTICE commands to display various kernel resources. Information on the following ChibiOS components can be displayed: TASK.Threads TASK.SEMaphore TASK.MuTeX TASK.CONDvar TASK.MailBox TASK.Heap TASK.Pool TASK.Queue TASK.VTimer Threads Semaphores Mutexes Condition Variables Mailboxes Heaps Memory pools Queues Virtual timers For a description of each command, refer to chapter ChibiOS Commands. If your hardware allows accessing the memory, while the target is running, these resources can be displayed On The Fly, i.e. while the application is running, without any intrusion to the application. Without this capability, the information will only be displayed, if the target application is stopped. Task Stack Coverage For stack usage coverage of the tasks, you can use the TASK.STacK command. Without any parameter, this command will set up a window with all active tasks. If you specify only a magic number as parameter, the stack area of this task will be automatically calculated. To use the calculation of the maximum stack usage, flag memory must be mapped to the task stack areas, when working with the emulation memory. When working with the target memory, a stack pattern must be defined with the command TASK.STacK.PATtern (default value is zero). To add/remove one task to/from the task stack coverage, you can either call the TASK.STacK.ADD or TASK.STacK.ReMove commands with the task magic number as parameter, or omit the parameter and select from the emerging TASK.STacK.* window. It is recommended, to display only the tasks, that you are interested in, because the evaluation of the used stack space is very time consuming and slows down the debugger display. RTOS Debugger for ChibiOS/RT 7

8 ChibiOS itself does not store information about the stack size of a task. To calculate the stack size and stack endings, the debugger tries to determine the symbol of the work area and uses the size of this symbol as stack size. If this fails, no stack coverage for this task is available. As a workaround, you can use a small script to set the stack characteristics of each task manually. Example to set the stack size of the test1 task to 1024 bytes: ; Adapt stack characteristics of a task ; Specify the task name, e.g. the test1 task: &task="test1" ; Specify the new task size in bytes for this task, e.g bytes: &stacksize=0x400 ; Open standard stack view and ensure a display update TASK.STacK.view SCREEN ; Calculate task magic and stack start address &magic=task.magic("test1") &stackstart=0x20020fe8 ; Remove the standard stack calculation for this task TASK.STacK.ReMove &magic ; And add the custom one: TASK.STacK.ADD &magic &stackstart++(&stacksize-1) Task Related Breakpoints Any breakpoint set in the debugger can be restricted to fire only if a specific task hits that breakpoint. This is especially useful when debugging code which is shared between several tasks. To set a task related breakpoint, use the command: Break.Set <address> <range> [/<option>] /TASK <task> Set task related breakpoint. Use a magic number, task ID, or task name for <task>. For information about the parameters, see What to know about Magic Numbers, Task IDs and Task Names (general_ref_t.pdf). By default, the task related breakpoint will be implemented by a conditional breakpoint inside the debugger. I.e., the target will always halt at that breakpoint, but the debugger immediately resumes execution if the current running task is not equal to the specified task. NOTE: Task related breakpoints impact the real-time behavior of the application. RTOS Debugger for ChibiOS/RT 8

9 On some architectures it is possible to set a task related breakpoint with on-chip debug logic that is less intrusive. Specify additionally the option /Onchip to use this. The debugger then uses the on-chip resources to reduce the number of breaks to the minimum, by pre-filtering the tasks. E.g. on ARM architectures, if the RTOS serves the Context ID register at task switches, and if the debug logic provides the Context ID comparison, you may use this register for less intrusive task related breakpoints: TrOnchip.ContextID ON will enable the comparison to the whole Context ID register. TrOnchip.ASID ON will enable the comparison to the ASID part only. If TASK.List.tasks provides a trace ID (traceid column), the debugger will use this ID for comparison. Without the trace ID, it uses the magic number (magic column) for comparison. For a general description of the Break.Set command, please see its documentation. When single stepping, the debugger halts on the next instruction, regardless of which task hits this breakpoint. When debugging shared code, stepping over an OS function may lead to a task switch and coming back to the same place - but with a different task. If you want to stick the debugging within the current task you can set up the debugger with SETUP.StepWithinTask ON to use task related breakpoints for single stepping. In this case, single stepping will always stay within the current task. Other tasks using the same code will not be halted on these events. If you want to halt program execution as soon as a specific task is scheduled to run by the OS, you can use the Break.SetTask command. Task Context Display You can switch the whole viewing context to a task that is currently not being executed. This means that all register and stack related information (such as Register, Data.List, Frame etc.) will be shown according to this task. Be aware that this is only for displaying information. When continuing debugging the application (Step or Go), the debugger will switch back to the current context. For displaying a specific task context, use the command: Frame.TASK [<task>] Display task context. Use a magic number, task ID, or task name for <task>. For information about the parameters, see What to know about Magic Numbers, Task IDs and Task Names (general_ref_t.pdf). To switch back to the current context, omit all parameters. RTOS Debugger for ChibiOS/RT 9


10 For displaying the call stack of a specific task, you can use the following command: Frame /Task <task> Display call stack of a task. If you d like to see the application code where the task was preempted, execute the command Frame /Caller /Task <task> to open a window of the same name. Double click on the line showing the OS service call. Dynamic Task Performance Measurement The debugger may execute a dynamic performance measurement by evaluating the current running task in changing time intervals. Start the measurement with the commands PERF.Mode TASK and PERF.Arm, and view the contents with PERF.ListTASK. The evaluation is done by reading the magic location (= current running task) in memory. This memory read may be non-intrusive or intrusive, depending on the PERF.METHOD used. If PERF collects the PC for function profiling of processes in MMU based operating systems (SYStem.Option MMUSPACES ON), then you need to set PERF.MMUSPACES, too. For a general description of the PERF command, refer to General Commands Reference Guide P (general_ref_p.pdf). Task Runtime Statistics Out of the recordings done by the Trace (if available), the debugger is able to evaluate the time spent in a task and display it statistically and graphically. Using this feature requires that the on-chip trace generation logic can generated task information. For details refer to OS-aware Tracing (glossary.pdf). RTOS Debugger for ChibiOS/RT 10
 Trace.")

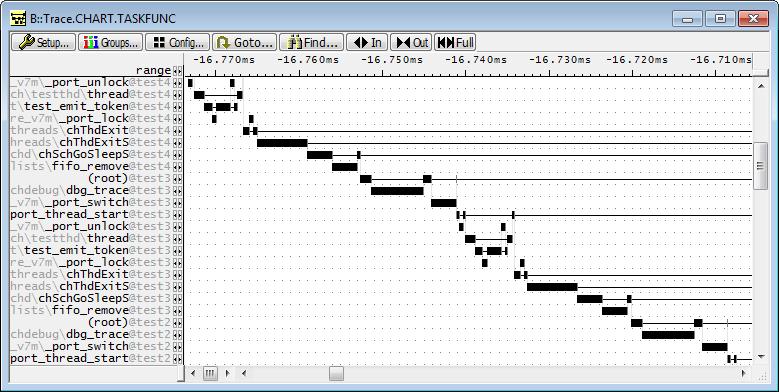
11 To evaluate the contents of the trace buffer, use these commands: Trace.List List.TASK DEFault Trace.STATistic.TASK Trace.Chart.TASK Trace.PROfileSTATistic.TASK Trace.PROfileChart.TASK Trace.FindAll Address task.config(magic) Trace.FindAll CYcle owner OR CYcle context Display trace buffer and task switches Display task runtime statistic evaluation Display task runtime timechart Display task runtime within fixed time intervals statistically Display task runtime within fixed time intervals as colored graph Display all data access records to the magic location Display all context ID records The start of the recording time, when the calculation doesn t know, which task is running, is calculated as (unknown). Function Runtime Statistics NOTE: This feature is only available if your debugger equipment is able to trace memory data accesses (program flow trace is not sufficient). All function-related statistic and time chart evaluations can be used with task-specific information. The function timings will be calculated dependent on the task that called this function. To do this, in addition to the function entries and exits, the task switches must be recorded. RTOS Debugger for ChibiOS/RT 11
12 To do a selective recording on task-related function runtimes with flow traces (ICD, e.g. ETM and NEXUS trace), based on the data accesses, use the following PRACTICE command: ; Enable flow trace an accesses to the magic location Break.Set TASK.CONFIG(magic) /TraceData To do a selective recording on task-related function runtimes with flow traces, based on the context ID, use the following PRACTICE command: ; Enable flow trace with context ID (e.g. 32bit) ETM.ContextID 32 To do a selective recording on task-related function runtimes with state analyzers (ICE and FIRE), use the following PRACTICE commands: ; Mark the magic location with an Alpha breakpoint Break.Set TASK.CONFIG(magic)++(TASK.CONFIG(magicsize)-1) /Alpha ; Mark the function entries/exits with Alpha/Beta breakpoints Break.SetFunc ; Program the Analyzer to record function entries/exits and task switches Analyzer.ReProgram ( Sample.Enable if AlphaBreak BetaBreak Mark.A if AlphaBreak Mark.B if BetaBreak ) To evaluate the contents of the trace buffer, use these commands: Trace.ListNesting Trace.STATistic.Func Trace.STATistic.TREE Trace.STATistic.sYmbol /SplitTASK Trace.Chart.Func Trace.Chart.sYmbol /SplitTASK Display function nesting Display function runtime statistic Display functions as call tree Display flat runtime analysis Display function timechart Display flat runtime timechart The start of the recording time, when the calculation doesn t know which task is running, is calculated as (unknown). RTOS Debugger for ChibiOS/RT 12

13 RTOS Debugger for ChibiOS/RT 13

14 ChibiOS specific Menu The file chibios.men contains an alternate menu with ChibiOS specific topics. Load this menu with the MENU.ReProgram command. You will find a new pull down menu called ChibiOS/RT. The Display topics launch the appropriate kernel resource display windows. The Stack Coverage submenu starts and resets the ChibiOS specific stack coverage, and provide an easy way to add or remove threads from the stack coverage window. The Trace pull-down menu is extended. In the List submenu, you can choose for an trace list window showing only thread switches (if any) or thread switches together with default display. The Perf menu contains additional submenus for thread runtime statistics, thread related function runtime statistics or statistics on task states. RTOS Debugger for ChibiOS/RT 14


15 ChibiOS Commands TASK.CONDvar Display condition variables TASK.CONDvar <condvar> Displays detailed information about a condition variable. Specify a variable or address that contains the condition variable. The field magic and other fields are mouse sensitive, double clicking on them opens appropriate windows. Right clicking on them will show a local menu. TASK.EVenT Display events TASK.EVenT <event> Displays detailed information about an event. Specify a variable or address that contains the event. The field magic and other fields are mouse sensitive, double clicking on them opens appropriate windows. Right clicking on them will show a local menu. RTOS Debugger for ChibiOS/RT 15

16 TASK.Heap Display heaps TASK.Heap <heap> Displays detailed information about a heap. Specify a variable or address that contains the heap. The field magic and other fields are mouse sensitive, double clicking on them opens appropriate windows. Right clicking on them will show a local menu. TASK.MailBox Display mailboxes TASK.MailBox <mailbox> Displays detailed information about a mailbox. Specify a variable or address that contains the mailbox. The field magic and other fields are mouse sensitive, double clicking on them opens appropriate windows. Right clicking on them will show a local menu. RTOS Debugger for ChibiOS/RT 16

17 TASK.MuTeX Display mutexes TASK.MuTeX <mutex> Displays detailed information about a mutex. Specify a variable or address that contains the mutex. The field magic and other fields are mouse sensitive, double clicking on them opens appropriate windows. Right clicking on them will show a local menu. TASK.Pool Display memory pools TASK.Pool <pool> Displays detailed information about a memory pool. Specify a variable or address that contains the pool. The field magic and other fields are mouse sensitive, double clicking on them opens appropriate windows. Right clicking on them will show a local menu. RTOS Debugger for ChibiOS/RT 17


18 TASK.Queue Display queues TASK.Queue <queue> Displays detailed information about a queue. Specify a variable or address that contains the queue. The field magic and other fields are mouse sensitive, double clicking on them opens appropriate windows. Right clicking on them will show a local menu. TASK.SEMaphore Display semaphores TASK.SEMaphore <semaphore> Displays detailed information about a semaphore. Specify a variable or address that contains the semaphore. The field magic and other fields are mouse sensitive, double clicking on them opens appropriate windows. Right clicking on them will show a local menu. RTOS Debugger for ChibiOS/RT 18
![TASK.Thread Display threads TASK.Thread [<thread>] Displays the thread table of ChibiOS or detailed information about one specific thread.](/docs-images/85/92542947/images/19-0.jpg "Without any arguments, a table with all created threads will be shown. Specify a thread name or magic number to display detailed information on that thread.")

19 TASK.Thread Display threads TASK.Thread [<thread>] Displays the thread table of ChibiOS or detailed information about one specific thread. Without any arguments, a table with all created threads will be shown. Specify a thread name or magic number to display detailed information on that thread. magic is a unique ID, used by the RTOS Debugger to identify a specific threads (address of the thread structure). The field magic and other fields are mouse sensitive, double clicking on them opens appropriate windows. Right clicking on them will show a local menu. TASK.VTimer Display virtual timers TASK.VTimer Displays a list of all created virtual timers. The field magic and other fields are mouse sensitive, double clicking on them opens appropriate windows. Right clicking on them will show a local menu. RTOS Debugger for ChibiOS/RT 19
20 ChibiOS PRACTICE Functions There are special definitions for ChibiOS specific PRACTICE functions. TASK.CONFIG(magic) Returns the address for the magic number TASK.CONFIG(magicsize) Returns the size of the magic number (1,2 or 4) Frequently-Asked Questions No information available RTOS Debugger for ChibiOS/RT 20
RTOS Debugger for RTX-ARM
 RTOS Debugger for RTX-ARM TRACE32 Online Help TRACE32 Directory TRACE32 Index TRACE32 Documents... RTOS Debuggers... RTOS Debugger for RTX-ARM... 1 Overview... 2 Brief Overview of Documents for New Users...
RTOS Debugger for MicroC/OS-III
 RTOS Debugger for MicroC/OS-III TRACE32 Online Help TRACE32 Directory TRACE32 Index TRACE32 Documents... RTOS Debuggers... RTOS Debugger for MicroC/OS-III... 1 Overview... 2 Brief Overview of Documents
RTOS Debugger for ThreadX
 RTOS Debugger for ThreadX TRACE32 Online Help TRACE32 Directory TRACE32 Index TRACE32 Documents... RTOS Debuggers... RTOS Debugger for ThreadX... 1 Overview... 3 Brief Overview of Documents for New Users...
RTOS Debugger for CMX
 RTOS Debugger for CMX TRACE32 Online Help TRACE32 Directory TRACE32 Index TRACE32 Documents... RTOS Debuggers... RTOS Debugger for CMX... 1 Overview... 2 Brief Overview of Documents for New Users... 3
OS Awareness Manual Sciopta
 OS Awareness Manual Sciopta TRACE32 Online Help TRACE32 Directory TRACE32 Index TRACE32 Documents... OS Awareness Manuals... OS Awareness Manual Sciopta... 1 History... 2 Overview... 2 Brief Overview of
RTOS Debugger for FreeRTOS
 RTOS Debugger for FreeRTOS TRACE32 Online Help TRACE32 Directory TRACE32 Index TRACE32 Documents... RTOS Debuggers... RTOS Debugger for FreeRTOS... 1 Overview... 2 Brief Overview of Documents for New Users...
RTOS Debugger for MQX
 RTOS Debugger for MQX TRACE32 Online Help TRACE32 Directory TRACE32 Index TRACE32 Documents... RTOS Debuggers... RTOS Debugger for MQX... 1 Overview... 3 Brief Overview of Documents for New Users... 4
RTOS Debugger for MicroC/OS-II
 RTOS Debugger for MicroC/OS-II TRACE32 Online Help TRACE32 Directory TRACE32 Index TRACE32 Documents... RTOS Debuggers... RTOS Debugger for MicroC/OS-II... 1 Overview... 3 Brief Overview of Documents for
RTOS Debugger for RTXC Quadros
 RTOS Debugger for RTXC Quadros TRACE32 Online Help TRACE32 Directory TRACE32 Index TRACE32 Documents... RTOS Debuggers... RTOS Debugger for RTXC Quadros... 1 Overview... 3 Brief Overview of Documents for
Hypervisor Awareness for Wind River Hypervisor
 Hypervisor Awareness for Wind River Hypervisor TRACE32 Online Help TRACE32 Directory TRACE32 Index TRACE32 Documents... Hypervisor Support... Hypervisor Awareness for Wind River Hypervisor... 1 Overview...
RTOS Debugger for RTXC Quadros
 RTOS Debugger for RTXC Quadros TRACE32 Online Help TRACE32 Directory TRACE32 Index TRACE32 Documents... RTOS Debuggers... RTOS Debugger for RTXC Quadros... 1 Overview... 3 Brief Overview of Documents for
OS Awareness Manual OSEK/ORTI
 OS Awareness Manual OSEK/ORTI TRACE32 Online Help TRACE32 Directory TRACE32 Index TRACE32 Documents... OS Awareness Manuals... OS Awareness for OSEK/ORTI... OS Awareness Manual OSEK/ORTI... 1 History...
OS Awareness Manual OSE Epsilon
 OS Awareness Manual OSE Epsilon TRACE32 Online Help TRACE32 Directory TRACE32 Index TRACE32 Documents... OS Awareness Manuals... OS Awareness Manual OSE Epsilon... 1 History... 2 Overview... 2 Brief Overview
OS Awareness Manual OSE Delta
 OS Awareness Manual OSE Delta TRACE32 Online Help TRACE32 Directory TRACE32 Index TRACE32 Documents... OS Awareness Manuals... OS Awareness Manual OSE Delta... 1 History... 3 Overview... 3 Brief Overview
RTOS Debugger for Windows Standard
 RTOS Debugger for Windows Standard TRACE32 Online Help TRACE32 Directory TRACE32 Index TRACE32 Documents... RTOS Debuggers... RTOS Debugger for Windows Standard... 1 Overview... 4 Brief Overview of Documents
RTOS Debugger for LynxOS
 RTOS Debugger for LynxOS TRACE32 Online Help TRACE32 Directory TRACE32 Index TRACE32 Documents... RTOS Debuggers... RTOS Debugger for LynxOS... 1 Overview... 3 Brief Overview of Documents for New Users...
OS Awareness Manual uclinux
 OS Awareness Manual uclinux TRACE32 Online Help TRACE32 Directory TRACE32 Index TRACE32 Documents... OS Awareness Manuals... OS Awareness Manual uclinux... 1 History... 4 Overview... 5 Brief Overview of
RTOS Debugger for Windows CE6/EC7/EC2013
 RTOS Debugger for Windows CE6/EC7/EC2013 TRACE32 Online Help TRACE32 Directory TRACE32 Index TRACE32 Documents... RTOS Debuggers... RTOS Debugger for Windows CE6/EC7/EC2013... 1 Overview... 4 Brief Overview
RTOS Debugger for RTX51 tiny
 RTOS Debugger for RTX51 tiny TRACE32 Online Help TRACE32 Directory TRACE32 Index TRACE32 Documents... RTOS Debuggers... RTOS Debugger for RTX51 tiny... 1 Overview... 3 Brief Overview of Documents for New
RTOS Debugger for psos+
 RTOS Debugger for psos+ TRACE32 Online Help TRACE32 Directory TRACE32 Index TRACE32 Documents... RTOS Debuggers... RTOS Debugger for psos+... 1 Overview... 3 Brief Overview of Documents for New Users...
RTOS Debugger for OS-9
 RTOS Debugger for OS-9 TRACE32 Online Help TRACE32 Directory TRACE32 Index TRACE32 Documents... RTOS Debuggers... RTOS Debugger for OS-9... 1 Overview... 3 Brief Overview of Documents for New Users...
Integration for CodeWright
 Integration for CodeWright TRACE32 Online Help TRACE32 Directory TRACE32 Index TRACE32 Documents... 3rd Party Tool Integrations... Integration for CodeWright... 1 Overview... 2 Brief Overview of Documents
RTOS Debugger for QNX - Run Mode
 RTOS Debugger for QNX - Run Mode TRACE32 Online Help TRACE32 Directory TRACE32 Index TRACE32 Documents... RTOS Debuggers... RTOS Debugger for QNX - Run Mode... 1 Basic Concepts... 2 pdebug... 2 Switching
TRACE32 Glossary Terms, Abbreviations, and Definitions... 2
 TRACE32 Glossary TRACE32 Online Help TRACE32 Directory TRACE32 Index TRACE32 Glossary... 1 Terms, Abbreviations, and Definitions... 2 Terms with Explanations and Examples... 4 Access Classes 4 Build Path
TRACE32 Documents... ICD In-Circuit Debugger... Processor Architecture Manuals... TriCore... TriCore Monitor... 1
 TriCore Monitor TRACE32 Online Help TRACE32 Directory TRACE32 Index TRACE32 Documents... ICD In-Circuit Debugger... Processor Architecture Manuals... TriCore... TriCore Monitor... 1 Brief Overview of Documents
Run Mode Debugging Manual Symbian
 Run Mode Debugging Manual Symbian TRACE32 Online Help TRACE32 Directory TRACE32 Index TRACE32 Documents... OS Awareness Manuals... OS Awareness and Run Mode Debugging for Symbian... Run Mode Debugging
Application Note for the SNOOPer Trace
 Application Note for the SNOOPer Trace TRACE32 Online Help TRACE32 Directory TRACE32 Index TRACE32 Documents... Trace Analysis... Trace Application Notes... Application Note for the SNOOPer Trace... 1
TRACE32 Getting Started... ICD In-Circuit Debugger Getting Started... ICD Introduction... 1
 ICD Introduction TRACE32 Online Help TRACE32 Directory TRACE32 Index TRACE32 Getting Started... ICD In-Circuit Debugger Getting Started... ICD Introduction... 1 Introduction... 2 What is an In-Circuit
RTOS Debugger for Linux - Run Mode
 RTOS Debugger for Linux - Run Mode TRACE32 Online Help TRACE32 Directory TRACE32 Index TRACE32 Documents... RTOS Debuggers... RTOS Debugger for Linux... RTOS Debugger for Linux - Run Mode... 1 Debugging
Introduction to the ThreadX Debugger Plugin for the IAR Embedded Workbench C-SPYDebugger
 C-SPY plugin Introduction to the ThreadX Debugger Plugin for the IAR Embedded Workbench C-SPYDebugger This document describes the IAR C-SPY Debugger plugin for the ThreadX RTOS. The ThreadX RTOS awareness
TRACE32 Documents... ICD In-Circuit Debugger... Processor Architecture Manuals... NS NS32000 Monitor... 1
 NS32000 Monitor TRACE32 Online Help TRACE32 Directory TRACE32 Index TRACE32 Documents... ICD In-Circuit Debugger... Processor Architecture Manuals... NS32000... NS32000 Monitor... 1 Brief Overview of Documents
The ThreadX C-SPY plugin
 The ThreadX C-SPY plugin Introduction to the ThreadX Debugger Plugin for the IAR Embedded Workbench C-SPY Debugger This document describes the IAR C-SPY Debugger plugin for the ThreadX RTOS. The ThreadX
ARM Application Note for MXC Chips
 ARM Application Note for MXC Chips TRACE32 Online Help TRACE32 Directory TRACE32 Index TRACE32 Documents... ICD In-Circuit Debugger... Processor Architecture Manuals... ARM/CORTEX/XSCALE... ARM Application
embos Real-Time Operating System embos plug-in for IAR C-Spy Debugger Document: UM01025 Software Version: 3.0 Revision: 0 Date: September 18, 2017
 embos Real-Time Operating System embos plug-in for IAR C-Spy Debugger Document: UM01025 Software Version: 3.0 Revision: 0 Date: September 18, 2017 A product of SEGGER Microcontroller GmbH & Co. KG www.segger.com
Integration for CodeBlocks
 Integration for CodeBlocks TRACE32 Online Help TRACE32 Directory TRACE32 Index TRACE32 Documents... 3rd Party Tool Integrations... Integration for CodeBlocks... 1 Overview... 2 Supported Code::Blocks versions...
Lab 3-2: Exploring the Heap
 Lab 3-2: Exploring the Heap Objectives Become familiar with the Windows Embedded CE 6.0 heap Prerequisites Completed Lab 2-1 Estimated time to complete this lab: 30 minutes Lab Setup To complete this lab,
embos Real-Time Operating System embos plug-in for IAR C-Spy Debugger Document: UM01025 Software Version: 3.1 Revision: 0 Date: May 3, 2018
 embos Real-Time Operating System Document: UM01025 Software Version: 3.1 Revision: 0 Date: May 3, 2018 A product of SEGGER Microcontroller GmbH www.segger.com 2 Disclaimer Specifications written in this
_ V Renesas R8C In-Circuit Emulation. Contents. Technical Notes
 _ V9.12. 225 Technical Notes Renesas R8C In-Circuit Emulation This document is intended to be used together with the CPU reference manual provided by the silicon vendor. This document assumes knowledge
Native Process Debugger
 Native Process Debugger TRACE32 Online Help TRACE32 Directory TRACE32 Index TRACE32 Documents... Native Process Debugger... 1 Operation Theory... 3 Quick Start... 4 Starting a new process 4 Attach to a
TRACE32 Debugger Getting Started... ICD Tutorial About the Tutorial... 2
 ICD Tutorial TRACE32 Online Help TRACE32 Directory TRACE32 Index TRACE32 Debugger Getting Started... ICD Tutorial... 1 About the Tutorial... 2 Working with the Debugger... 3 Set up the Program Environment
_ V Intel 8085 Family In-Circuit Emulation. Contents. Technical Notes
 _ V9.12. 225 Technical Notes Intel 8085 Family In-Circuit Emulation This document is intended to be used together with the CPU reference manual provided by the silicon vendor. This document assumes knowledge
Trace Getting Started V8.02
 Trace Getting Started V8.02 1. Introduction This paper helps the user to entirely exploit the trace and troubleshoot most often situations that the developer is confronted with while debugging the application.
XDS560 Trace. Technology Showcase. Daniel Rinkes Texas Instruments
 XDS560 Trace Technology Showcase Daniel Rinkes Texas Instruments Agenda AET / XDS560 Trace Overview Interrupt Profiling Statistical Profiling Thread Aware Profiling Thread Aware Dynamic Call Graph Agenda
Converter from GEL to PRACTICE
 Converter from GEL to PRACTICE TRACE32 Online Help TRACE32 Directory TRACE32 Index TRACE32 Documents... PRACTICE Script Language... Application Notes for PRACTICE... Converter from GEL to PRACTICE... 1
Rudi Dienstbeck June 07, ARM TrustZone and Hypervisor Debugging
 ARM TrustZone and Hypervisor Debugging Agenda 2 / 46 TrustZone And CPU Modes In TRACE32 Default Behavior Of The Debugger Special TrustZone Support Outlook To Multiple Guests Agenda TrustZone And CPU Modes
General Commands Reference Guide O
 General Commands Reference Guide O TRACE32 Online Help TRACE32 Directory TRACE32 Index TRACE32 Documents... General Commands... General Commands Reference Guide O... 1 OCP... 4 OCP OpenCoreProtocol WatchPoint
TRACE32 Documents... ICD In-Circuit Debugger... Processor Architecture Manuals... MCS08... MCS08 Debugger... 1
 MCS08 Debugger TRACE32 Online Help TRACE32 Directory TRACE32 Index TRACE32 Documents... ICD In-Circuit Debugger... Processor Architecture Manuals... MCS08... MCS08 Debugger... 1 Brief Overview of Documents
Efficient and Large Scale Program Flow Tracing in Linux. Alexander Shishkin, Intel
 Efficient and Large Scale Program Flow Tracing in Linux Alexander Shishkin, Intel 16.09.2013 Overview Program flow tracing - What is it? - What is it good for? Intel Processor Trace - Features / capabilities
Renesas 78K/78K0R/RL78 Family In-Circuit Emulation
 _ Technical Notes V9.12.225 Renesas 78K/78K0R/RL78 Family In-Circuit Emulation This document is intended to be used together with the CPU reference manual provided by the silicon vendor. This document
Operating Systems Design Fall 2010 Exam 1 Review. Paul Krzyzanowski
 Operating Systems Design Fall 2010 Exam 1 Review Paul Krzyzanowski pxk@cs.rutgers.edu 1 Question 1 To a programmer, a system call looks just like a function call. Explain the difference in the underlying
Tracking the Virtual World
 Tracking the Virtual World Synopsys: For many years the JTAG interface has been used for ARM-based SoC debugging. With this JTAG style debugging, the developer has been granted the ability to debug software
TRACE32 Documents... TRACE32 Instruction Set Simulators... Simulator for ARC... 1
 Simulator for ARC TRACE32 Online Help TRACE32 Directory TRACE32 Index TRACE32 Documents... TRACE32 Instruction Set Simulators... Simulator for ARC... 1 Introduction... 3 Supported ARC Cores 3 Brief Overview
Application Note for the Trace.Find Command
 Application Note for the Trace.Find Command TRACE32 Online Help TRACE32 Directory TRACE32 Index TRACE32 Documents... Trace Analysis... Trace Application Notes... Application Note for the Trace.Find Command...
Process Context & Interrupts. New process can mess up information in old process. (i.e. what if they both use the same register?)
") 1 Process Context 1.1 What is context? A process is sometimes called a task, subroutine or program. Process context is all the information that the process needs to keep track of its state. Registers Temporary
1 Process Context 1.1 What is context? A process is sometimes called a task, subroutine or program. Process context is all the information that the process needs to keep track of its state. Registers Temporary
_ V ST STM8 Family On-Chip Emulation. Contents. Technical Notes
 _ V9.12. 225 Technical Notes ST STM8 Family On-Chip Emulation This document is intended to be used together with the CPU reference manual provided by the silicon vendor. This document assumes knowledge
Advanced Debugging using the Ashling MPC5500 tools
 Ashling Product Brief APB200 Advanced Debugging using the Ashling MPC5500 tools 1. Contents 1. Contents 1 2. Introduction 1 3. Break on Data Access 1 4. Tracing Accesses to a Variable 3 4.1 Cycle accurate
NEW CEIBO DEBUGGER. Menus and Commands
 NEW CEIBO DEBUGGER Menus and Commands Ceibo Debugger Menus and Commands D.1. Introduction CEIBO DEBUGGER is the latest software available from Ceibo and can be used with most of Ceibo emulators. You will
Simulator for H8/300, H8/300H and H8S
 Simulator for H8/300, H8/300H and H8S TRACE32 Online Help TRACE32 Directory TRACE32 Index TRACE32 Documents... TRACE32 Instruction Set Simulators... Simulator for H8/300, H8/300H and H8S... 1 TRACE32 Simulator
XDS560 Trace. Advanced Use Cases for Profiling. Daniel Rinkes Texas Instruments
 XDS560 Trace Advanced Use Cases for Profiling Daniel Rinkes Texas Instruments Agenda AET / XDS560Trace Overview Interrupt Profiling Statistical Profiling Thread Aware Profiling Thread Aware Dynamic Call
Eclipse-Based CodeWarrior Debugger
 July 14-16, 2009 Eclipse-Based CodeWarrior Debugger QorIQ Multicore Linux Kernel Debug Bogdan Irimia CodeWarrior Software Engineer Tool used to develop software running on Freescale Power Architecture
RTX64 Features by Release IZ-DOC-X R3
 RTX64 Features by Release IZ-DOC-X64-0089-R3 January 2014 Operating System and Visual Studio Support WINDOWS OPERATING SYSTEM RTX64 2013 Windows 8 No Windows 7 (SP1) (SP1) Windows Embedded Standard 8 No
Chapter 12 Visual Program Debugger
 Chapter 12 Visual Program Debugger In the previous chapter on programs a section titled Getting programs to do what you want discussed using the log to trace how programs execute. That is a useful technique
Simulator for TriCore
 Simulator for TriCore TRACE32 Online Help TRACE32 Directory TRACE32 Index TRACE32 Documents... TRACE32 Instruction Set Simulators... Simulator for TriCore... 1 TRACE32 Simulator License... 4 Brief Overview
TRACE32 Documents... ICD In-Circuit Debugger... Processor Architecture Manuals... MMDSP... MMDSP Debugger General Note... 3
 MMDSP Debugger TRACE32 Online Help TRACE32 Directory TRACE32 Index TRACE32 Documents... ICD In-Circuit Debugger... Processor Architecture Manuals... MMDSP... MMDSP Debugger... 1 General Note... 3 Brief
NEC 78K0- Family On-Chip Emulation
 _ Technical Notes V9.9.86 NEC 78K0- Family On-Chip Emulation Contents Contents... 1 1 Introduction... 2 2 Emulation options... 3 2.1 Hardware Options... 3 3 CPU Setup... 6 3.1 General Options... 6 3.2
Integration for exdi2 on Windows CE Platform Builder
 Integration for exdi2 on Windows CE Platform Builder TRACE32 Online Help TRACE32 Directory TRACE32 Index TRACE32 Documents... 3rd Party Tool Integrations... Integration for exdi2 on Windows CE Platform
A brief intro to MQX Lite. Real work: hands-on labs. Overview, Main features and Code Size
 October 2013 A brief intro to MQX Lite Overview, Main features and Code Size Real work: hands-on labs Create a new MQX-Lite project, add ConsoleIO and BitIO components Create tasks, watch the flashing
Integration for Rhapsody in C/C++
 Integration for Rhapsody in C/C++ TRACE32 Online Help TRACE32 Directory TRACE32 Index TRACE32 Documents... 3rd Party Tool Integrations... Integration for Rhapsody in C/C++... 1 Overview... 2 Architecture
MPLAB SIM. MPLAB IDE Software Simulation Engine Microchip Technology Incorporated MPLAB SIM Software Simulation Engine
 MPLAB SIM MPLAB IDE Software Simulation Engine 2004 Microchip Technology Incorporated MPLAB SIM Software Simulation Engine Slide 1 Welcome to this web seminar on MPLAB SIM, the software simulator that
QorIQ Debugger and NEXUS Trace
 QorIQ Debugger and NEXUS Trace TRACE32 Online Help TRACE32 Directory TRACE32 Index TRACE32 Documents... ICD In-Circuit Debugger... Processor Architecture Manuals... QORIQ... QorIQ Debugger and NEXUS Trace...
RTOS Debugger for Windows CE4/CE5
 RTOS Debugger for Windows CE4/CE5 TRACE32 Online Help TRACE32 Directory TRACE32 Index TRACE32 Documents... RTOS Debuggers... RTOS Debugger for Windows CE4/CE5... 1 Overview... 4 Brief Overview of Documents
Training Android Debugging
 Training Android Debugging TRACE32 Online Help TRACE32 Directory TRACE32 Index TRACE32 Training... Training Android Debugging... Training Android Debugging... 1 Introduction... 2 Basic terms on Android...
Debugging in Small Basic is the process of analysing a program to detect and fix errors or improve functionality in some way.
 How to Debug Introduction Debugging in Small Basic is the process of analysing a program to detect and fix errors or improve functionality in some way. In order to debug a program it must first compile
Putting it All Together
 EE445M/EE360L.12 Embedded and Real-Time Systems/ Real-Time Operating Systems : Commercial RTOS, Final Exam, Review 1 Putting it All Together Micrium μcos-ii Reference: www.micrium.com Application Note
NIOS II Instantiating the Off-chip Trace Logic
 NIOS II Instantiating the Off-chip Trace Logic TRACE32 Online Help TRACE32 Directory TRACE32 Index TRACE32 Documents... ICD In-Circuit Debugger... Processor Architecture Manuals... NIOS... NIOS II Application
Integration for Visual Basic Interface
 Integration for Visual Basic Interface TRACE32 Online Help TRACE32 Directory TRACE32 Index TRACE32 Documents... 3rd Party Tool Integrations... Integration for Visual Basic Interface... 1 Brief Overview
TRACE32 Documents... ICD In-Circuit Debugger... Processor Architecture Manuals... Andes... Andes Debugger... 1
 Andes Debugger TRACE32 Online Help TRACE32 Directory TRACE32 Index TRACE32 Documents... ICD In-Circuit Debugger... Processor Architecture Manuals... Andes... Andes Debugger... 1 Brief Overview of Documents
The CMXBug Manual. The CMXBug Manual
 The CMX CMXBug TM debugger provides the ability to view and modify different aspects of the CMX multitasking operating system environment, while application code is running. CMXBug runs as a task, usually
What is this? How do UVMs work?
 An introduction to UVMs What is this? UVM support is a unique Xenomai feature, which allows running a nearly complete realtime system embodied into a single multi threaded Linux process in user space,
Supplement: Visual C++ Debugging
 Supplement: Visual C++ Debugging For Introduction to C++ Programming By Y. Daniel Liang Note: The screen shots are taken from VC++ 2010. It is the same for the later version. 1 Introduction The debugger
What s An OS? Cyclic Executive. Interrupts. Advantages Simple implementation Low overhead Very predictable
 What s An OS? Provides environment for executing programs Process abstraction for multitasking/concurrency scheduling Hardware abstraction layer (device drivers) File systems Communication Do we need an
General Commands Reference Guide G
 General Commands Reference Guide G TRACE32 Online Help TRACE32 Directory TRACE32 Index TRACE32 Documents... General Commands... General Commands Reference Guide G... 1 History... 3 GLOBALON... 4 GLOBALON
What s New in Platform Builder 7
 What s New in Platform Builder 7 1 What s New in Platform Builder 7 Windows Embedded Compact 7 Technical Article Writer: John Hughes Technical Reviewer: Carlos Alayo Published: March 2011 Applies To: Windows
ARM Processors for Embedded Applications
 ARM Processors for Embedded Applications Roadmap for ARM Processors ARM Architecture Basics ARM Families AMBA Architecture 1 Current ARM Core Families ARM7: Hard cores and Soft cores Cache with MPU or
embos Real-Time Operating System CPU & Compiler specifics for embos Visual Studio Simulation
 embos Real-Time Operating System CPU & Compiler specifics for Document: UM01060 Software Version: 5.02 Revision: 0 Date: July 25, 2018 A product of SEGGER Microcontroller GmbH www.segger.com 2 Disclaimer
BASICS OF THE RENESAS SYNERGY PLATFORM
 BASICS OF THE RENESAS SYNERGY PLATFORM TM Richard Oed 2018.11 02 CHAPTER 11 EVENT ANALYSIS WITH TRACEX CONTENTS 11 EVENT ANALYSIS WITH TRACEX 03 11.1 An Introduction to TraceX 03 11.2 Built-in Views and
CODE TIME TECHNOLOGIES. Abassi RTOS. Porting Document. ARM Cortex-A9 CCS
 CODE TIME TECHNOLOGIES Abassi RTOS Porting Document ARM Cortex-A9 CCS Copyright Information This document is copyright Code Time Technologies Inc. 2012. All rights reserved. No part of this document may
embos Real Time Operating System CPU & Compiler specifics for ARM core with ARM RealView Developer Suite 3.0 Document Rev. 1
 embos Real Time Operating System CPU & Compiler specifics for ARM core with ARM RealView Developer Suite 3.0 Document Rev. 1 A product of SEGGER Microcontroller GmbH & Co. KG www.segger.com 2/25 embos
CS370 Operating Systems
 CS370 Operating Systems Colorado State University Yashwant K Malaiya Spring 2018 L20 Virtual Memory Slides based on Text by Silberschatz, Galvin, Gagne Various sources 1 1 Questions from last time Page
TRACE32 Documents... ICD In-Circuit Debugger... Processor Architecture Manuals... XC XC800 Debugger... 1
 XC800 Debugger TRACE32 Online Help TRACE32 Directory TRACE32 Index TRACE32 Documents... ICD In-Circuit Debugger... Processor Architecture Manuals... XC800... XC800 Debugger... 1 Introduction... 3 Brief
Embedded Systems. 5. Operating Systems. Lothar Thiele. Computer Engineering and Networks Laboratory
 Embedded Systems 5. Operating Systems Lothar Thiele Computer Engineering and Networks Laboratory Embedded Operating Systems 5 2 Embedded Operating System (OS) Why an operating system (OS) at all? Same
RTX64 Features by Release
 RTX64 Features by Release IZ-DOC-X64-0089-R4 January 2015 Operating System and Visual Studio Support WINDOWS OPERATING SYSTEM RTX64 2013 RTX64 2014 Windows 8 No Yes* Yes* Yes Windows 7 Yes (SP1) Yes (SP1)
TRACE32 as GDB Back-End
 TRACE32 as GDB Back-End TRACE32 Online Help TRACE32 Directory TRACE32 Index TRACE32 Documents... GDB Support... TRACE32 as GDB Back-End... 1 Basic Concepts... 2 Introduction 2 Operating of the API Requests
Training Simulator and Demo Software
 Training Simulator and Demo Software TRACE32 Online Help TRACE32 Directory TRACE32 Index TRACE32 Training... Training Simulator and Demo Software... 1 About the Demo... 2 Starting the TRACE32 Simulator...
ITRON Project Overview
 ITRON Project Overview Haruyasu Ito 1 ITRON Project One of the subprojects of the TRON Project A project to standardize RTOS and related spec. for embedded systems ( esp. small-scale embedded systems )
API for Auxiliary Processing Unit
 API for Auxiliary Processing Unit TRACE32 Online Help TRACE32 Directory TRACE32 Index TRACE32 Documents... Misc... API for Auxiliary Processing Unit... 1 Introduction... 3 Release Information 3 Features
MCUXpresso IDE FreeRTOS Debug Guide. Rev November, 2017
 MCUXpresso IDE FreeRTOS Debug Guide User guide 14 November, 2017 Copyright 2017 All rights reserved. ii 1. Introduction... 1 2. LinkServer FreeRTOS Thread Aware Debugging... 2 2.1. Behavior when thread
An unrivalled feature-set and unprecedented integration
 Atollic TrueSTUDIO An unrivalled feature-set and unprecedented integration ARM and x86 C/C++ build and debug tools (GNU) for development of embedded MCU and PC applications Parallel compilation and multi-core
TRACE32 Documents... ICD In-Circuit Debugger... Processor Architecture Manuals... Blackfin... Blackfin Debugger General Note...
 Blackfin Debugger TRACE32 Online Help TRACE32 Directory TRACE32 Index TRACE32 Documents... ICD In-Circuit Debugger... Processor Architecture Manuals... Blackfin... Blackfin Debugger... 1 General Note...
x386 and x486 Monitor
 x386 and x486 Monitor TRACE32 Online Help TRACE32 Directory TRACE32 Index TRACE32 Documents... ICD In-Circuit Debugger... Processor Architecture Manuals... x386 and x486... x386 and x486 Monitor... 1 Brief