JVM Performance Study Comparing Oracle HotSpot and Azul Zing Using Apache Cassandra
|
|
|
- Marcia Wright
- 5 years ago
- Views:
Transcription

1 JVM Performance Study Comparing Oracle HotSpot and Azul Zing Using Apache Cassandra
2 Legal Notices Apache Cassandra, Spark and Solr and their respective logos are trademarks or registered trademarks of the Apache Software Foundation in the US and/or other countries. Azul Systems, Zing and the Azul logo are trademarks or registered trademarks of Azul Systems, Inc. Linux is a registered trademark of Linus Torvalds. CentOS is the property of the CentOS project. Oracle, Java, and HotSpot are trademarks or registered trademarks of Oracle Corporation and/or its affiliates. Intel and Intel Xeon are trademarks or registered trademarks of Intel Corporation or its subsidiaries in the United States and other countries. GitHub is a registered trademark of GitHub, Inc. Other marks are the property of their respective owners and are used here only for identification purposes Copyright 2017 Azul Systems, Inc. All rights reserved. 2
3 Table of Contents Legal Notices Executive Summary Background Testing Environment Testing Methodology Results Conclusion References Appendix
4 1 Executive Summary Big data technologies are transforming enterprise operations by making it possible to process massive datasets and deliver new and innovative solutions, such as web personalization, product recommendations, catalogue lookups, real-time analytics, fraud detection and drug discovery. But ensuring consistent, low latency performance isn t a guarantee for all Java-based big data applications. Careful attention to product choices, runtime components and deployment topologies are essential to maximizing the values of these new big data solutions, including Apache Cassandra and supporting components such as Spark and Solr. This benchmark study compares the response time performance of two different Java Virtual Machines (JVMs), namely Azul Zing and Oracle HotSpot, while running Apache Cassandra at different throughput levels. All benchmark results were derived using the cassandra-stress framework, a utility for load testing and benchmarking a Cassandra cluster, and the jhiccup Java Virtual Machine (JVM) measurement tool. The testing methodology was designed to measure JVM response time consistency based on percentiles (e.g. 99%, 99.9%, 99.99%, etc.) and Cassandra application max outliers at different throughput rates. The benchmark was configured with three Cassandra data nodes and one load server. The jhiccup measurement tool was used to capture and graph the response time distribution of the two JVMs for all benchmark runs. The results of the benchmark show that response time distributions and runtime consistency vary dramatically between the two JVMs. For Oracle HotSpot, which employs a stop-the-world young generation collector, response time variance ranged between 1 millisecond (msec) to a maximum of 667 msec. In contrast the Azul Zing runtime showed response time consistency at all throughput rates (e.g. 10K to 60K OPS). When comparing Cassandra max outliers at different throughput rates, Zing deployments were 14x to 51x better than similarly configured Oracle HotSpot deployments. This difference in response time profile of the two JVMs suggests that for Cassandra deployments that require consistent low latency (i.e. have implicit or explicit SLAs), only the Azul Zing JVM can ensure runtime consistency that will not stall the application and contribute to Cassandra response time variations. 4
5 This paper describes the testing environment, testing methodology and resulting response time profiles of the two JVMs while supporting an Apache Cassandra application. Companies deploying or running big data applications, including Cassandra, can use this information to ensure they are using the correct JVM to meet their specific business requirements or they can leverage this benchmark to design their own testing scenarios. 2 Background Cassandra is a NoSQL database that can scale elastically and enables sub-second response times with linear scalability. DataStax Enterprise (DSE), built on Apache Cassandra, is a distributed database for online applications that require fast performance with no downtime. Because Apache Cassandra, Spark, Solr and other DSE components are written in Java, they require a Java Virtual Machine (JVM) for runtime deployment. Since not all JVMs are the same and employ different garbage collection algorithms (e.g. Concurrent Mark Sweep, C4, etc.), the benchmark was configured to capture JVM response time variances as well as application max outliers at different throughput rates (i.e. operations per second or OPS). For this performance study the cassandra-stress 2.1 load tool, a Java-based stress testing utility for load testing and benchmarking Cassandra clusters, was used to provide a reproducible way to simulate a specific transaction load and measure the performance of the individual Cassandra nodes, including max response times. To ensure accurate runtime measurements of the two JVMs, including the contributions of Java garbage collection (GC) pauses, jhiccup was added to the cassandra-stress benchmarking framework and used to capture and graph JVM response time profiles by percentiles (e.g. 99%, 99.9%, 99.99%, etc.). Designed to only measure JVM responsiveness, jhiccup charts shows the best possible response time the application could have experienced at given percentile (e.g. 99%). jhiccup is not an end-to-end performance measurement tool and does not capture the additional overhead of the Cassandra application or related transaction logic. 3 Testing Environment The test environment consisted of four nearly identical Iron Systems servers: Cassandra servers A, B, and C (i.e. nodes 1, 2 and 3) Cassandra-stress load server Each Cassandra server had 4 Intel Xeon processors with 512 GB of memory, running CentOS 6.0 and DataStax Enterprise version that includes Cassandra version 2.0. The three Cassandra machines and the load server were directly interconnected using Solarflare Communications Solarstorm SFC GbE network cards. The exact configurations are listed below: Machine Configuration Cassandra Server A (node 1) Manufacturer Iron Systems Processors (x 4) Intel Xeon CPU 2.00GHz Memory (x 32) 16GB RDIMM, 1066MHz, Low Volt, Dual Rank Networking 1 x Solarflare Communications SFC9020 OS CentOS 6.0 5
6 Machine Configuration Cassandra Server B (node 2) Manufacturer Iron Systems Processors (x 4) Intel Xeon CPU E Memory (x 32) 16GB RDIMM, 1333MHz, Low Volt, Dual Rank Networking 1 x Solarflare Communications SFC9020 OS CentOS 6.0 Machine Configuration Cassandra Server C (node 3) Manufacturer Iron Systems Processors (x 4) Intel Xeon CPU E Memory (x 32) 16GB RDIMM, 1333MHz, Low Volt, Dual Rank Networking 1 x Solarflare Communications SFC9020 OS CentOS 6.0 As recommended to maximize performance, Cassandra was configured with a Replication Factor of 3 and with the Quorum set to 3. Cassandra-stress 2.1 was configured with a master process on the load server and issued requests directly to the Cassandra cluster. jhiccup version was used to capture JVM response times across all 3 Cassandra nodes and graph the response time distribution up to the th percentile. Both Oracle HotSpot and Azul Zing where configured on the Cassandra servers to use 16 GB heaps. The Oracle HotSpot JVM was configured to use the CMS collector and as recommended to maximize performance was configured using the following flags: -Xms16G -Xmx16G -Xmn8G -Xss256k -XX:StringTableSize= XX:+UseParNewGC -XX:+UseConcMarkSweepGC -XX:+CMSParallelRemarkEnabled -XX:SurvivorRatio=8 -XX:MaxTenuringThreshold=1 -XX:CMSInitiatingOccupancyFraction=75 -XX:+UseCMSInitiatingOccupancyOnly -XX:+UseTLAB -XX:+CMSParallelInitialMarkEnabled -XX:+CMSEdenChunksRecordAlways -XX:+UseCondCardMark -XX:+PrintGCApplicationStoppedTime -Djava.net.preferIPv4Stack=true -Dcom.sun.management.jmxremote.port=$JMX_PORT -Dcom.sun.management.jmxremote.rmi.port=$JMX_PORT -Dcom.sun.management.jmxremote.ssl=false -Dcom.sun.management.jmxremote.authenticate=false -Xloggc:/var/log/cassandra/gc.log -XX:+PrintGCDetails -verbose:gc -javaagent:/home/bsilva/jhiccup-2.0.2/jhiccup.jar=""-d,30000"" The Azul Zing runtime employed few runtime flags and used the default Azul C4 pauseless collector. For both Zing and Oracle HotSpot, the CentOS operating system was configured to use LargePages. -Xmx16G -XX:+UseLargePages -javaagent:/home/bsilva/jhiccup-2.0.2/jhiccup.jar=""-d,30000"" 6
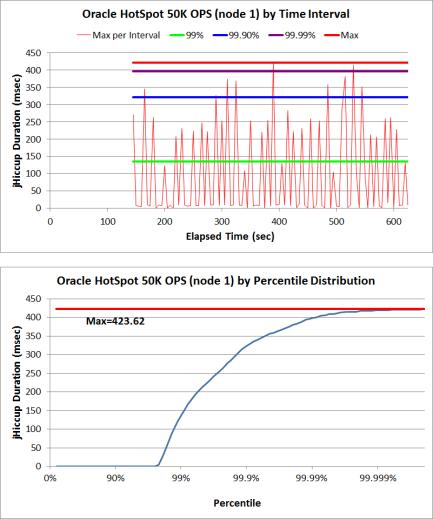
7 Java Configuration Azul Zing Oracle HotSpot JVM Version java version "1.7.0-zing_ " Zing Runtime Environment for Java Applications (build zing_ b4) Zing 64-Bit Tiered VM (build zing_ b15-productazlinuxM-X86_64, mixed mode) java version "1.7.0_45" Java SE Runtime Environment (build 1.7.0_45-b18) Java HotSpot 64-Bit Server VM (build b08, mixed mode) 4 Testing Methodology The cassandra-stress tool is a Java-based stress testing utility for basic benchmarking and load testing a Cassandra cluster. The load generator attempts to produce a load of xx,xxx transactions per second, of a given transaction type mix, and measure the observed transaction latencies. This tool is commonly used to support capacity planning decisions. Since the objective of this performance study was to measure JVM response times and max application outliers at a given throughput, performance runs for Zing and HotSpot ranged from 10K to 60K operations per second (OPS). Cassandra was configured for 3 nodes with a Replication Factor of 3 and with the Quorum set to 3 across three physical servers. The Cassandra transactional mixed for each run was set using the following string (only the TARGET_OPS was varied from run to run): $ cassandra-stress user profile=$stress_directory/tools/bin/stress/stress320.yaml ops\(insert=33,read=66,delete=1\) n=$n cl=quorum -rate threads=80 limit=${target_ops}/s -mode native cql3 -node file=$stress_directory/tools/bin/stress/nodes -log $LOG_PARAMS The reported latencies from the cassandra-stress tool suffer from Coordinated Omission (see pages 30-46), as do many other load generators. As such, only the op rate, partition rate, row rate and latency max were saved for each run: Results: op rate : partition rate : 5323 row rate : 5323 latency max : To compensate for this measurement and for latency percentiles calculation errors, JVM results were captured and charted using the open source jhiccup agent which attached to each Cassandra process on each node. A sample jhiccup chart for Oracle HotSpot is shown below: 7
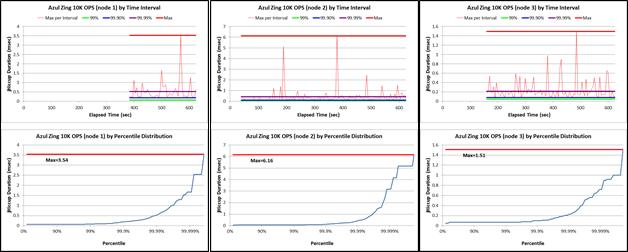
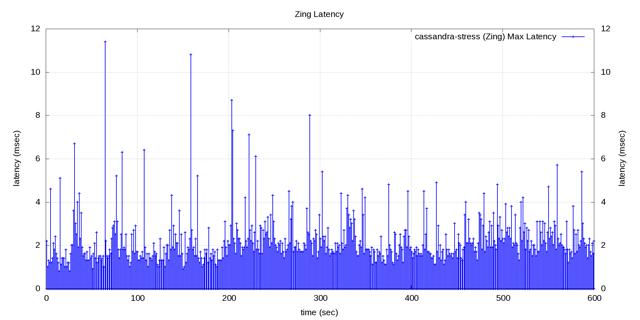
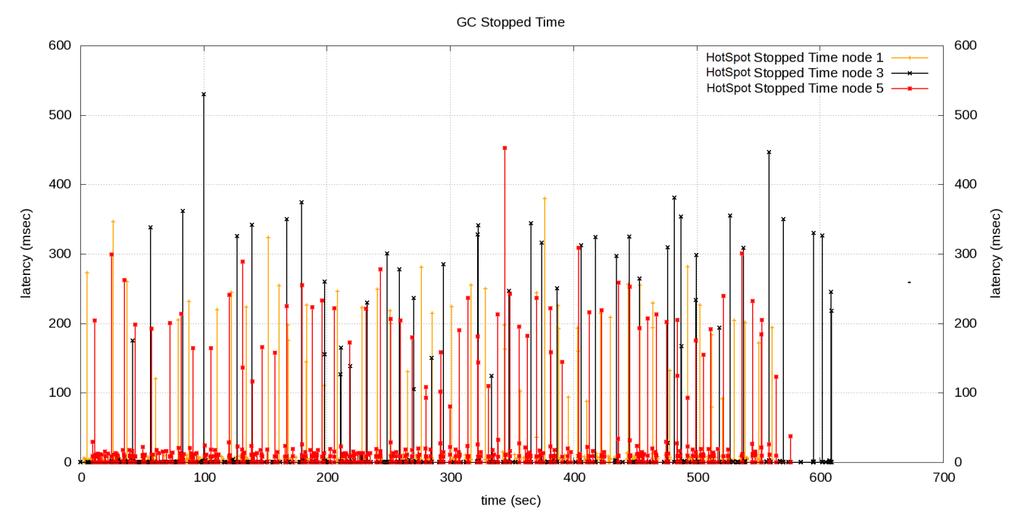
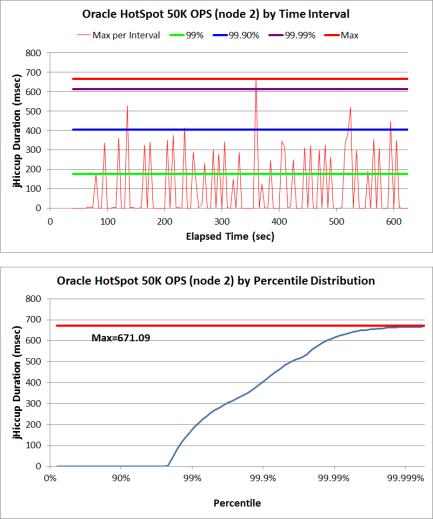
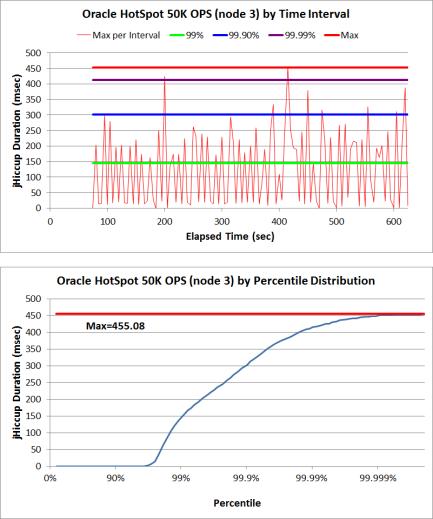
8 Figure 1 Individual Hiccup Charts for Oracle HotSpot on 3 Nodes at 40K OPS 5 Results By aggregating the different Cassandra application max outliers at different OPS for both the Azul Zing and Oracle HotSpot JVMs, we can accurately compare response times variances of the two Java runtimes (e.g. at 30K OPS Cassandra on Zing had a max response time of 11.8 msec vs. HotSpot deployment which had a msec max). Figure 2 Aggregated Cassandra-Stress Max Application Outliers in Milliseconds If we look at the individual jhiccup charts for Zing and HotSpot (e.g. 30K OPS), we again see different JVM response time profiles. While Oracle HotSpot generally performed well at the 95 th percentile, it starts to encounter response variances at 99 th and higher percentiles which was directly associated with its young generation, stop-the-world CMS (Concurrent Mark Sweep) collector. If we look specifically at the jhiccup histogram for Oracle HotSpot at 30K OPS, we see that over this relatively short 10 minute benchmark run JVM encountered 9 GC spikes over 200 msec; one of which exceeded 360 msec. Meanwhile, Azul Zing never 8
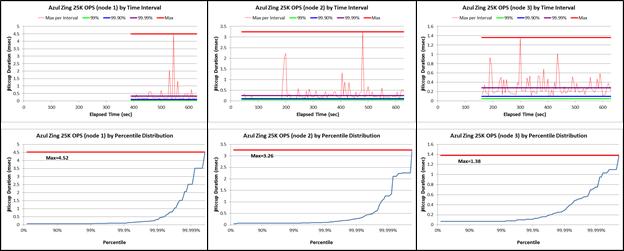
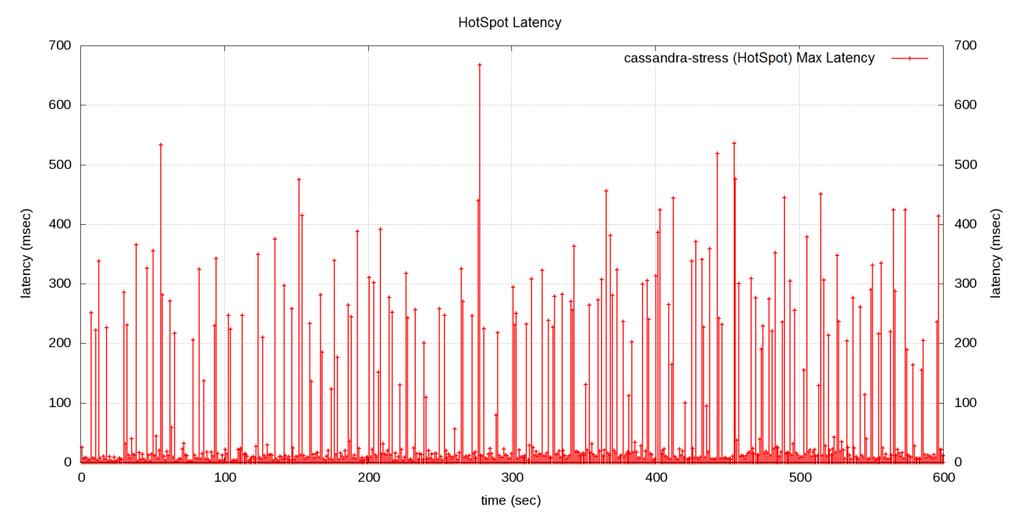
9 exceeded 1.6 msec throughout the entire run for the same throughput rate and transactional mix. Figure 3 Oracle HotSpot and Azul Zing jhiccup Charts for Node #3 at 30K OPS If we examine the Oracle HotSpot GC Stopped Time histogram (figure 5) over the length of the run, we ll see several spikes related to garbage collection pauses (similar to what was reported by jhiccup in figure 3). At higher operations per second, HotSpot pauses increased and at 60K OPS, which was near saturation for HotSpot, the max Cassandra outlier exceeded 640 msec, while the related JVM max latency was over 600 msec as captured by the jhiccup tool (figure 4). Figure 4 Oracle HotSpot jhiccup Charts for Nodes 1, 2 and 3 at 60K OPS 9
10 Figure 5 Oracle HotSpot GC Stopped Time & cassandra-stress response OPS 6 Conclusion This benchmark study demonstrates that application performance and runtime consistency are affected by the choice of JVM used with Cassandra. Since different JVMs employ different garbage collection (GC) algorithms, application response time consistency can vary based on which collector is used (i.e. not all Java runtimes are the same). For applications that have real-time use cases (e.g. fraud detection) or have explicit or implicit SLAs, careful attention to application characteristics, such as heap size, live set size, objection allocation rates, and mutation rates are important factors when choosing a JVM and garbage collector that can meet your specific deployment requirements. When metrics such as Sustained Throughput (i.e. a throughput rate which never exceeds a specific response time SLA), and time-to-production are important, Azul Zing can provide better Java runtime metrics with less JVM tuning and reduce devastating application pauses. For big data solutions such as Cassandra and use cases that require runtime consistency or can benefit from larger Java heaps (e.g. Solr, Spark), Azul Zing provides greater runtime consistency and a viable alternative to Oracle HotSpot. When Cassandra is deployed with strict SLAs, e.g milliseconds, only Azul Zing can guarantee deployment success. 10
11 7 References DataStax Enterprise Azul Systems C4 Continuously Concurrent Compacting Collector (ISMM paper) Understanding Java Garbage Collection White Paper Blog post: If you re not measuring and/or plotting the Max, what are you hiding (from)? The cassandra-stress tool JHiccup open source performance measurement tool Azul Inspector Contact Azul Systems Phone: Web: 11
12 8 Appendix 8.1 Test Durations and Settings Cassandra Cluster Configuration Nodes 3 Replication 3 Quorum Setting 3 Cassandra-stress Configuration Run Duration 10 minutes (600 seconds) Operations/sec 10,000-60,000 Transaction mix 33% insert, 66% read, 1% delete 8.2 Hiccup Charts for All Runs Oracle HotSpot 10K OPS (actual 10,003 OPS) Results: op rate : partition rate : 5323 row rate : 5323 latency max : (msec) Total operation time : 00:09:59 END 12
13 Azul Zing 10K OPS (actual 10,003) Results: op rate : partition rate : 5318 row rate : 5318 latency max : 8.8 (msec) Total operation time : 00:09:59 END 13
14 14

15 Azul Zing 15K OPS (actual 15,007 OPS) Results: op rate : partition rate : 7878 row rate : 7878 latency max : 7.8 (msec) Total operation time : 00:05:33 15
16 Oracle HotSpot 20K OPS (actual 20,004 OPS) Results: op rate : partition rate : row rate : latency max : (msec) Total operation time : 00:09:59 END 16

17 Azul Zing 25K OPS (actually 25,002 OPS) Results: op rate : partition rate : row rate : latency max : 11.4 (msec) Total operation time : 00:09:59 END 17
18 18

19 Azul Zing 30K OPS (actual 30,011 OPS) Results: op rate : partition rate : row rate : latency max : 11.8 (msec) Total operation time : 00:09:59 END 19
20 Oracle HotSpot 30K OPS (actual 30,004 OPS) Results: op rate : partition rate : row rate : latency max : (mec) Total operation time : 00:09:59 END 20

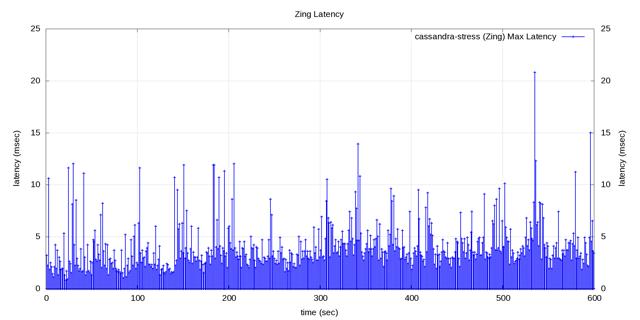
21 Azul Zing 40K OPS (actual 40,003 OPS) Results: op rate : partition rate : row rate : latency max : 20.8 (msec) Total operation time : 00:09:59 END 21
22 22

23 Oracle HotSpot 40K OPS (actual 40,006 OPS) Results: op rate : partition rate : row rate : latency max : (msec) Total operation time : 00:09:59 END 23

 Total operation time : 00:09:59")
24 Azul Zing 50K OPS (actual 50,006 OPS) Results: op rate : partition rate : row rate : latency max : 27.5 (msec) Total operation time : 00:09:59 END 24

25 Oracle HotSpot 50K OPS (actual 50,007 OPS) Results: op rate : partition rate : row rate : latency max : (msec) Total operation time : 00:09:59 END 25
26 26

27 Azul Zing 60K OPS (actual 60,0019 OPS) Results: op rate : partition rate : row rate : latency max : 45.8 (msec) Total operation time : 00:09:59 END 27
28 Oracle HotSpot 60K OPS (actual 59,995 OPS) Results: op rate : partition rate : row rate : latency max : (msec) Total operation time : 00:10:00 END 28
29 29
JVM Performance Study Comparing Java HotSpot to Azul Zing Using Red Hat JBoss Data Grid
 JVM Performance Study Comparing Java HotSpot to Azul Zing Using Red Hat JBoss Data Grid Legal Notices JBoss, Red Hat and their respective logos are trademarks or registered trademarks of Red Hat, Inc.
How NOT to Measure Latency
 How NOT to Measure Latency Matt Schuetze Product Management Director, Azul Systems QCon NY Brooklyn, New York 1 @azulsystems Understanding Latency and Application Responsiveness Matt Schuetze Product Management
Enabling Java in Latency Sensitive Environments
 Enabling Java in Latency Sensitive Environments Gil Tene, CTO & co-founder, Azul Systems 2011 Azul Systems, Inc. High level agenda Intro, jitter vs. JITTER Java in a low latency application world The (historical)
Finally! Real Java for low latency and low jitter
 Finally! Real Java for low latency and low jitter Gil Tene, CTO & co-founder, Azul Systems High level agenda Java in a low latency application world Why Stop-The-World is a problem (Duh?) Java vs. actual,
Java Without the Jitter
 TECHNOLOGY WHITE PAPER Achieving Ultra-Low Latency Table of Contents Executive Summary... 3 Introduction... 4 Why Java Pauses Can t Be Tuned Away.... 5 Modern Servers Have Huge Capacities Why Hasn t Latency
How NOT to Measure Latency
 How NOT to Measure Latency Matt Schuetze South Bay (LA) Java User Group Product Management Director, Azul Systems El Segundo, California 1 @azulsystems Understanding Latency and Application Responsiveness
Understanding Java Garbage Collection
 Understanding Java Garbage Collection A Shallow Dive into the Deep End of the JVM A presentation to the Detroit JUG November 3, 2014 Matt Schuetze, Director of Product Management Azul Systems This Talk
Understanding Application Hiccups
 Understanding Application Hiccups and what you can do about them An introduction to the Open Source jhiccup tool Gil Tene, CTO & co-founder, Azul Systems About me: Gil Tene co-founder, CTO @Azul Systems
Understanding Java Garbage Collection
 Understanding Java Garbage Collection and what you can do about it A presentation to the New York Java Special Interest Group March 27, 2014 Matt Schuetze, Director of Product Management Azul Systems This
Understanding Garbage Collection
 Understanding Garbage Collection Gil Tene, CTO Azul Systems High level agenda Some GC fundamentals, terminology & mechanisms Classifying current commercially available collectors Why Stop-The-World is
Understanding Latency and Response Time Behavior
 Understanding Latency and Response Time Behavior Pitfalls, Lessons and Tools Matt Schuetze Director of Product Management Azul Systems Latency Behavior Latency: The time it took one operation to happen
Understanding Java Garbage Collection
 Understanding Java Garbage Collection A Shallow Dive into the Deep End of the JVM A presentation to the Philadelphia JUG April 14, 2014 Matt Schuetze, Director of Product Management Azul Systems This Talk
Accelerating Enterprise Search with Fusion iomemory PCIe Application Accelerators
 WHITE PAPER Accelerating Enterprise Search with Fusion iomemory PCIe Application Accelerators Western Digital Technologies, Inc. 951 SanDisk Drive, Milpitas, CA 95035 www.sandisk.com Table of Contents
Diffusion TM 5.0 Performance Benchmarks
 Diffusion TM 5.0 Performance Benchmarks Contents Introduction 3 Benchmark Overview 3 Methodology 4 Results 5 Conclusion 7 Appendix A Environment 8 Diffusion TM 5.0 Performance Benchmarks 2 1 Introduction
Concurrent Garbage Collection
 Concurrent Garbage Collection Deepak Sreedhar JVM engineer, Azul Systems Java User Group Bangalore 1 @azulsystems azulsystems.com About me: Deepak Sreedhar JVM student at Azul Systems Currently working
Page 2 of 6 SUT Model Form Factor CPU CPU Characteristics Number of Systems 1 Nodes Per System 1 Chips Per System 2 Hardware hw_1 Cores Per System 44
 Page 1 of 6 SPECjbb2015 Copyright 2015-2016 Standard Performance Evaluation Corporation Cisco Systems Cisco UCS C220 M4 Tested by: Cisco Systems SPEC license #: 9019 94667 SPECjbb2015-Multi max-jops 71951
Enabling Java in Latency Sensitive Environments
 Enabling Java in Latency Sensitive Environments 1 Matt Schuetze Azul Director of Product Management Matt Schuetze, Product Manager, Azul Systems Utah JUG, Murray UT, November 20, 2014 Gateway Java Users
TECHNOLOGY WHITE PAPER. Azul Pauseless Garbage Collection. Providing continuous, pauseless operation for Java applications
 TECHNOLOGY WHITE PAPER Azul Pauseless Garbage Collection Providing continuous, pauseless operation for Java applications The garbage collection process automatically frees the heap space used by objects
Azul Pauseless Garbage Collection
 TECHNOLOGY WHITE PAPER Azul Pauseless Garbage Collection Providing continuous, pauseless operation for Java applications Executive Summary Conventional garbage collection approaches limit the scalability
Understanding Java Garbage Collection
 Understanding Java Garbage Collection and what you can do about it Gil Tene, CTO & co-founder, Azul Systems 1 This Talk s Purpose / Goals This talk is focused on GC education This is not a how to use flags
Java Performance Tuning and Optimization Student Guide
 Java Performance Tuning and Optimization Student Guide D69518GC10 Edition 1.0 June 2011 D73450 Disclaimer This document contains proprietary information and is protected by copyright and other intellectual
Oracle Event Processing Extreme Performance on Sparc T5
 Oracle Event Processing Extreme Performance on Sparc T5 An Oracle Event Processing (OEP) Whitepaper ORACLE WHITE PAPER AUGUST 2014 Table of Contents Introduction 2 OEP Architecture 2 Server Architecture
Understanding Java Garbage Collection
 Understanding Java Garbage Collection and what you can do about it Gil Tene, CTO & co-founder, Azul Systems This Talk s Purpose / Goals This talk is focused on GC education This is not a how to use flags
JVM and application bottlenecks troubleshooting
 JVM and application bottlenecks troubleshooting How to find problems without using sophisticated tools Daniel Witkowski, EMEA Technical Manager, Azul Systems Daniel Witkowski - About me IT consultant and
DataStax Enterprise 4.0 In-Memory Option A look at performance, use cases, and anti-patterns. White Paper
 DataStax Enterprise 4.0 In-Memory Option A look at performance, use cases, and anti-patterns White Paper Table of Contents Abstract... 3 Introduction... 3 Performance Implications of In-Memory Tables...
OS-caused Long JVM Pauses - Deep Dive and Solutions
 OS-caused Long JVM Pauses - Deep Dive and Solutions Zhenyun Zhuang LinkedIn Corp., Mountain View, California, USA https://www.linkedin.com/in/zhenyun Zhenyun@gmail.com 2016-4-21 Outline q Introduction
The Application Memory Wall
 The Application Memory Wall Thoughts on the state of the art in Garbage Collection Gil Tene, CTO & co-founder, Azul Systems 2011 Azul Systems, Inc. About me: Gil Tene co-founder, CTO @Azul Systems Have
Disclaimer This presentation may contain product features that are currently under development. This overview of new technology represents no commitme
 VIRT1068BU Virtualizing and Tuning In-Memory Databases #VMworld # VIRT1068BU Disclaimer This presentation may contain product features that are currently under development. This overview of new technology
Disclaimer This presentation may contain product features that are currently under development. This overview of new technology represents no commitme
 VIRT1068BE Virtualizing and Tuning In-Memory Databases VMworld 2017 Content: Not for publication Emad Benjamin, Chief Technologist for Application Platforms, VMware, Inc. #VMworld #VIRT1068BE @vmjavabook
Java & Coherence Simon Cook - Sales Consultant, FMW for Financial Services
 Java & Coherence Simon Cook - Sales Consultant, FMW for Financial Services with help from Adrian Nakon - CMC Markets & Andrew Wilson - RBS 1 Coherence Special Interest Group Meeting 1 st March 2012 Presentation
Runtime Application Self-Protection (RASP) Performance Metrics
 Performance Metrics") Product Analysis June 2016 Runtime Application Self-Protection (RASP) Performance Metrics Virtualization Provides Improved Security Without Increased Overhead Highly accurate. Easy to install. Simple to
Product Analysis June 2016 Runtime Application Self-Protection (RASP) Performance Metrics Virtualization Provides Improved Security Without Increased Overhead Highly accurate. Easy to install. Simple to
Scaling Up Performance Benchmarking
 Scaling Up Performance Benchmarking -with SPECjbb2015 Anil Kumar Runtime Performance Architect @Intel, OSG Java Chair Monica Beckwith Runtime Performance Architect @Arm, Java Champion FaaS Serverless Frameworks
TRASH DAY: COORDINATING GARBAGE COLLECTION IN DISTRIBUTED SYSTEMS
 TRASH DAY: COORDINATING GARBAGE COLLECTION IN DISTRIBUTED SYSTEMS Martin Maas* Tim Harris KrsteAsanovic* John Kubiatowicz* *University of California, Berkeley Oracle Labs, Cambridge Why you should care
Java Application Performance Tuning for AMD EPYC Processors
 Java Application Performance Tuning for AMD EPYC Processors Publication # 56245 Revision: 0.70 Issue Date: January 2018 Advanced Micro Devices 2018 Advanced Micro Devices, Inc. All rights reserved. The
Java Performance Tuning
 443 North Clark St, Suite 350 Chicago, IL 60654 Phone: (312) 229-1727 Java Performance Tuning This white paper presents the basics of Java Performance Tuning and its preferred values for large deployments
TPC-E testing of Microsoft SQL Server 2016 on Dell EMC PowerEdge R830 Server and Dell EMC SC9000 Storage
 TPC-E testing of Microsoft SQL Server 2016 on Dell EMC PowerEdge R830 Server and Dell EMC SC9000 Storage Performance Study of Microsoft SQL Server 2016 Dell Engineering February 2017 Table of contents
IBM Power Systems solution for SugarCRM
 IBM Power Systems solution for SugarCRM Performance and scaling overview of Sugar on IBM Power Systems running Linux featuring the new IBM POWER8 technology Steve Pratt, Mark Nellen IBM Systems and Technology
How Not to Measure Latency
 How Not to Measure Latency An attempt to confer wisdom... Gil Tene, CTO & co-founder, Azul Systems This Talk s Purpose / Goals This is not a there is only one right way talk This is a talk about the common
Enabling Java-based VoIP backend platforms through JVM performance tuning
 Enabling Java-based VoIP backend platforms through JVM performance tuning (Bruno Van Den Bossche, Filip De Turck, April 3rd 2006) 3 April, 2006, 1 Outline Introduction Java 4 Telecom Evaluation Setup Hardware
webmethods Task Engine 9.9 on Red Hat Operating System
 webmethods Task Engine 9.9 on Red Hat Operating System Performance Technical Report 1 2015 Software AG. All rights reserved. Table of Contents INTRODUCTION 3 1.0 Benchmark Goals 4 2.0 Hardware and Software
Real Time: Understanding the Trade-offs Between Determinism and Throughput
 Real Time: Understanding the Trade-offs Between Determinism and Throughput Roland Westrelin, Java Real-Time Engineering, Brian Doherty, Java Performance Engineering, Sun Microsystems, Inc TS-5609 Learn
A JVM Does What? Eva Andreasson Product Manager, Azul Systems
 A JVM Does What? Eva Andreasson Product Manager, Azul Systems Presenter Eva Andreasson Innovator & Problem solver Implemented the Deterministic GC of JRockit Real Time Awarded patents on GC heuristics
Oracle Business Activity Monitoring 12c Best Practices ORACLE WHITE PAPER DECEMBER 2015
 Oracle Business Activity Monitoring 12c Best Practices ORACLE WHITE PAPER DECEMBER 2015 Disclaimer The following is intended to outline our general product direction. It is intended for information purposes
JVM Memory Model and GC
 JVM Memory Model and GC Developer Community Support Fairoz Matte Principle Member Of Technical Staff Java Platform Sustaining Engineering, Copyright 2015, Oracle and/or its affiliates. All rights reserved.
Accelerating Hadoop Applications with the MapR Distribution Using Flash Storage and High-Speed Ethernet
 WHITE PAPER Accelerating Hadoop Applications with the MapR Distribution Using Flash Storage and High-Speed Ethernet Contents Background... 2 The MapR Distribution... 2 Mellanox Ethernet Solution... 3 Test
Aerospike Scales with Google Cloud Platform
 Aerospike Scales with Google Cloud Platform PERFORMANCE TEST SHOW AEROSPIKE SCALES ON GOOGLE CLOUD Aerospike is an In-Memory NoSQL database and a fast Key Value Store commonly used for caching and by real-time
Reduce Costs & Increase Oracle Database OLTP Workload Service Levels:
 Reduce Costs & Increase Oracle Database OLTP Workload Service Levels: PowerEdge 2950 Consolidation to PowerEdge 11th Generation A Dell Technical White Paper Dell Database Solutions Engineering Balamurugan
Infor M3 on IBM POWER7+ and using Solid State Drives
 Infor M3 on IBM POWER7+ and using Solid State Drives IBM Systems & Technology Group Robert Driesch cooter@us.ibm.com This document can be found on the web, Version Date: January 31, 2014 Table of Contents
Typical Issues with Middleware
 Typical Issues with Middleware HrOUG 2016 Timur Akhmadeev October 2016 About Me Database Consultant at Pythian 10+ years with Database and Java Systems Performance and Architecture OakTable member 3 rd
Fusion iomemory PCIe Solutions from SanDisk and Sqrll make Accumulo Hypersonic
 WHITE PAPER Fusion iomemory PCIe Solutions from SanDisk and Sqrll make Accumulo Hypersonic Western Digital Technologies, Inc. 951 SanDisk Drive, Milpitas, CA 95035 www.sandisk.com Table of Contents Executive
PERFORMANCE ANALYSIS AND OPTIMIZATION OF SKIP LISTS FOR MODERN MULTI-CORE ARCHITECTURES
 PERFORMANCE ANALYSIS AND OPTIMIZATION OF SKIP LISTS FOR MODERN MULTI-CORE ARCHITECTURES Anish Athalye and Patrick Long Mentors: Austin Clements and Stephen Tu 3 rd annual MIT PRIMES Conference Sequential
SCYLLA: NoSQL at Ludicrous Speed. 主讲人 :ScyllaDB 软件工程师贺俊
 SCYLLA: NoSQL at Ludicrous Speed 主讲人 :ScyllaDB 软件工程师贺俊 Today we will cover: + Intro: Who we are, what we do, who uses it + Why we started ScyllaDB + Why should you care + How we made design decisions to
Talkative Engage Mitel Architecture Guide. Version 1.0
 Talkative Engage Mitel Architecture Guide Version 1.0 This document contains confidential information that is proprietary to Talkative. No part of its contents may be used, disclosed or conveyed to any
HBase Practice At Xiaomi.
 HBase Practice At Xiaomi huzheng@xiaomi.com About This Talk Async HBase Client Why Async HBase Client Implementation Performance How do we tuning G1GC for HBase CMS vs G1 Tuning G1GC G1GC in XiaoMi HBase
Accelerating Microsoft SQL Server 2016 Performance With Dell EMC PowerEdge R740
 Accelerating Microsoft SQL Server 2016 Performance With Dell EMC PowerEdge R740 A performance study of 14 th generation Dell EMC PowerEdge servers for Microsoft SQL Server Dell EMC Engineering September
An Oracle White Paper September Oracle Utilities Meter Data Management Demonstrates Extreme Performance on Oracle Exadata/Exalogic
 An Oracle White Paper September 2011 Oracle Utilities Meter Data Management 2.0.1 Demonstrates Extreme Performance on Oracle Exadata/Exalogic Introduction New utilities technologies are bringing with them
Extreme Performance Platform for Real-Time Streaming Analytics
 Extreme Performance Platform for Real-Time Streaming Analytics Achieve Massive Scalability on SPARC T7 with Oracle Stream Analytics O R A C L E W H I T E P A P E R A P R I L 2 0 1 6 Disclaimer The following
Flash Storage Complementing a Data Lake for Real-Time Insight
 Flash Storage Complementing a Data Lake for Real-Time Insight Dr. Sanhita Sarkar Global Director, Analytics Software Development August 7, 2018 Agenda 1 2 3 4 5 Delivering insight along the entire spectrum
Low Latency Java in the Real World
 Low Latency Java in the Real World LMAX Exchange and the Zing JVM Mark Price, Senior Developer, LMAX Exchange Gil Tene, CTO & co-founder, Azul Systems Low Latency in the Java Real World LMAX Exchange and
@joerg_schad Nightmares of a Container Orchestration System
 @joerg_schad Nightmares of a Container Orchestration System 2017 Mesosphere, Inc. All Rights Reserved. 1 Jörg Schad Distributed Systems Engineer @joerg_schad Jan Repnak Support Engineer/ Solution Architect
IBM Rational ClearCase Remote Client Version 7.1 Performance Report (Windows)
") IBM Rational ClearCase Remote Client Version 7.1 Performance Report (Windows) This report compares Rational ClearCase Remote Client (CCRC) server performance and scalability for the 7.0.1 and 7.1 releases.
IBM Rational ClearCase Remote Client Version 7.1 Performance Report (Windows) This report compares Rational ClearCase Remote Client (CCRC) server performance and scalability for the 7.0.1 and 7.1 releases.
JVM Troubleshooting MOOC: Troubleshooting Memory Issues in Java Applications
 JVM Troubleshooting MOOC: Troubleshooting Memory Issues in Java Applications Poonam Parhar JVM Sustaining Engineer Oracle Lesson 1 HotSpot JVM Memory Management Poonam Parhar JVM Sustaining Engineer Oracle
Qlik Sense Performance Benchmark
 Technical Brief Qlik Sense Performance Benchmark This technical brief outlines performance benchmarks for Qlik Sense and is based on a testing methodology called the Qlik Capacity Benchmark. This series
SPECjbb2013 Copyright Standard Performance Evaluation Corporation
 Page 1 of 5 SPECjbb2013 Copyright 2012-2014 Standard Performance Evaluation Corporation Express5800/A2040b Tested by: () SPEC license #: 9006 177753 SPECjbb2013-MultiJVM max-jops 65529 SPECjbb2013-MultiJVM
Deploying and Managing Dell Big Data Clusters with StackIQ Cluster Manager
 Deploying and Managing Dell Big Data Clusters with StackIQ Cluster Manager A Dell StackIQ Technical White Paper Dave Jaffe, PhD Solution Architect Dell Solution Centers Greg Bruno, PhD VP Engineering StackIQ,
Red Hat Ceph Storage and Samsung NVMe SSDs for intensive workloads
 Red Hat Ceph Storage and Samsung NVMe SSDs for intensive workloads Power emerging OpenStack use cases with high-performance Samsung/ Red Hat Ceph reference architecture Optimize storage cluster performance
Accelerating Big Data: Using SanDisk SSDs for Apache HBase Workloads
 WHITE PAPER Accelerating Big Data: Using SanDisk SSDs for Apache HBase Workloads December 2014 Western Digital Technologies, Inc. 951 SanDisk Drive, Milpitas, CA 95035 www.sandisk.com Table of Contents
Azul Disrupts the ROI Equation for High Performance Applications
 Azul Disrupts the ROI Equation for High Performance Applications Table of Contents Executive Summary... 3 Challenges of the Real-time Enterprise... 4 The ROI Conundrum with Java... 4 Introducing Zing:
MODULE 1 JAVA PLATFORMS. Identifying Java Technology Product Groups
 MODULE 1 JAVA PLATFORMS Identifying Java Technology Product Groups Java SE Platform Versions Year Developer Version (JDK) Platform 1996 1.0 1 1997 1.1 1 1998 1.2 2 2000 1.3 2 2002 1.4 2 2004 1.5 5 2006
Oracle Big Data Connectors
 Oracle Big Data Connectors Oracle Big Data Connectors is a software suite that integrates processing in Apache Hadoop distributions with operations in Oracle Database. It enables the use of Hadoop to process
New Oracle NoSQL Database APIs that Speed Insertion and Retrieval
 New Oracle NoSQL Database APIs that Speed Insertion and Retrieval O R A C L E W H I T E P A P E R F E B R U A R Y 2 0 1 6 1 NEW ORACLE NoSQL DATABASE APIs that SPEED INSERTION AND RETRIEVAL Introduction
DELL EMC ISILON F800 AND H600 I/O PERFORMANCE
 DELL EMC ISILON F800 AND H600 I/O PERFORMANCE ABSTRACT This white paper provides F800 and H600 performance data. It is intended for performance-minded administrators of large compute clusters that access
An Oracle White Paper December Accelerating Deployment of Virtualized Infrastructures with the Oracle VM Blade Cluster Reference Configuration
 An Oracle White Paper December 2010 Accelerating Deployment of Virtualized Infrastructures with the Oracle VM Blade Cluster Reference Configuration Introduction...1 Overview of the Oracle VM Blade Cluster
Oracle Database 12c: JMS Sharded Queues
 Oracle Database 12c: JMS Sharded Queues For high performance, scalable Advanced Queuing ORACLE WHITE PAPER MARCH 2015 Table of Contents Introduction 2 Architecture 3 PERFORMANCE OF AQ-JMS QUEUES 4 PERFORMANCE
Contents Overview of the Performance and Sizing Guide... 5 Architecture Overview... 7 Performance and Scalability Considerations...
 Unifier Performance and Sizing Guide for On-Premises Version 17 July 2017 Contents Overview of the Performance and Sizing Guide... 5 Architecture Overview... 7 Performance and Scalability Considerations...
High-Performance Lustre with Maximum Data Assurance
 High-Performance Lustre with Maximum Data Assurance Silicon Graphics International Corp. 900 North McCarthy Blvd. Milpitas, CA 95035 Disclaimer and Copyright Notice The information presented here is meant
HP SAS benchmark performance tests
 HP SAS benchmark performance tests technology brief Abstract... 2 Introduction... 2 Test hardware... 2 HP ProLiant DL585 server... 2 HP ProLiant DL380 G4 and G4 SAS servers... 3 HP Smart Array P600 SAS
Accelerate Database Performance and Reduce Response Times in MongoDB Humongous Environments with the LSI Nytro MegaRAID Flash Accelerator Card
 Accelerate Database Performance and Reduce Response Times in MongoDB Humongous Environments with the LSI Nytro MegaRAID Flash Accelerator Card The Rise of MongoDB Summary One of today s growing database
SAP BusinessObjects Explorer Sizing Guide SAP BusinessObjects Enterprise 4.0 Support Package 03
 SAP BusinessObjects Explorer Sizing Guide SAP BusinessObjects Enterprise 4.0 Support Package 03 01-07-16 Copyright 01 SAP AG. All rights reserved.sap, R/3, SAP NetWeaver, Duet, PartnerEdge, ByDesign, SAP
Hosted Microsoft Exchange Server 2003 Deployment Utilizing Network Appliance Storage Solutions
 Hosted Microsoft Exchange Server 23 Deployment Utilizing Network Appliance Storage Solutions Large-Scale, 68,-Mailbox Exchange Server Proof of Concept Lee Dorrier, Network Appliance, Inc. Eric Johnson,
Dell PowerEdge R730xd Servers with Samsung SM1715 NVMe Drives Powers the Aerospike Fraud Prevention Benchmark
 Dell PowerEdge R730xd Servers with Samsung SM1715 NVMe Drives Powers the Aerospike Fraud Prevention Benchmark Testing validation report prepared under contract with Dell Introduction As innovation drives
A High-Performance Storage and Ultra- High-Speed File Transfer Solution for Collaborative Life Sciences Research
 A High-Performance Storage and Ultra- High-Speed File Transfer Solution for Collaborative Life Sciences Research Storage Platforms with Aspera Overview A growing number of organizations with data-intensive
vsan 6.6 Performance Improvements First Published On: Last Updated On:
 vsan 6.6 Performance Improvements First Published On: 07-24-2017 Last Updated On: 07-28-2017 1 Table of Contents 1. Overview 1.1.Executive Summary 1.2.Introduction 2. vsan Testing Configuration and Conditions
Cassandra Integration User Guide
 Cassandra Integration User Guide Functional Area: Cassandra Integration Geneos Release: v4.7 Document Version: v1.0.0 Date Published: 24 May 2018 Copyright 2018. ITRS Group Ltd. All rights reserved. Information
SUPERMICRO, VEXATA AND INTEL ENABLING NEW LEVELS PERFORMANCE AND EFFICIENCY FOR REAL-TIME DATA ANALYTICS FOR SQL DATA WAREHOUSE DEPLOYMENTS
 TABLE OF CONTENTS 2 THE AGE OF INFORMATION ACCELERATION Vexata Provides the Missing Piece in The Information Acceleration Puzzle The Vexata - Supermicro Partnership 4 CREATING ULTRA HIGH-PERFORMANCE DATA
How to keep capacity predictions on target and cut CPU usage by 5x
 How to keep capacity predictions on target and cut CPU usage by 5x Lessons from capacity planning a Java enterprise application Kansas City, Sep 27 2016 Stefano Doni stefano.doni@moviri.com @stef3a linkedin.com/in/stefanodoni
Upgrade to Microsoft SQL Server 2016 with Dell EMC Infrastructure
 Upgrade to Microsoft SQL Server 2016 with Dell EMC Infrastructure Generational Comparison Study of Microsoft SQL Server Dell Engineering February 2017 Revisions Date Description February 2017 Version 1.0
Hadoop 2.x Core: YARN, Tez, and Spark. Hortonworks Inc All Rights Reserved
 Hadoop 2.x Core: YARN, Tez, and Spark YARN Hadoop Machine Types top-of-rack switches core switch client machines have client-side software used to access a cluster to process data master nodes run Hadoop
The Z Garbage Collector Scalable Low-Latency GC in JDK 11
 The Z Garbage Collector Scalable Low-Latency GC in JDK 11 Per Lidén (@perliden) Consulting Member of Technical Staff Java Platform Group, Oracle October 24, 2018 Safe Harbor Statement The following is
A Rational software Whitepaper 05/25/03. IBM Rational Rapid Developer Scalability and Performance Benchmark
 A Rational software Whitepaper 05/25/03 IBM Rational Rapid Developer Scalability and Performance Benchmark 1 Executive Summary This document describes a performance benchmark for Rational s estore application
NG2C: Pretenuring Garbage Collection with Dynamic Generations for HotSpot Big Data Applications
 NG2C: Pretenuring Garbage Collection with Dynamic Generations for HotSpot Big Data Applications Rodrigo Bruno Luis Picciochi Oliveira Paulo Ferreira 03-160447 Tomokazu HIGUCHI Paper Information Published
SCALING UP VS. SCALING OUT IN A QLIKVIEW ENVIRONMENT
 SCALING UP VS. SCALING OUT IN A QLIKVIEW ENVIRONMENT QlikView Technical Brief February 2012 qlikview.com Introduction When it comes to the enterprise Business Discovery environments, the ability of the
Oracle Java SE Advanced for ISVs
 Oracle Java SE Advanced for ISVs Oracle Java SE Advanced for ISVs is designed to enhance the Java based solutions that ISVs are providing to their enterprise customers. It brings together industry leading
Albis: High-Performance File Format for Big Data Systems
 Albis: High-Performance File Format for Big Data Systems Animesh Trivedi, Patrick Stuedi, Jonas Pfefferle, Adrian Schuepbach, Bernard Metzler, IBM Research, Zurich 2018 USENIX Annual Technical Conference
April 21, 2017 Revision GridDB Reliability and Robustness
 April 21, 2017 Revision 1.0.6 GridDB Reliability and Robustness Table of Contents Executive Summary... 2 Introduction... 2 Reliability Features... 2 Hybrid Cluster Management Architecture... 3 Partition
New Java performance developments: compilation and garbage collection
 New Java performance developments: compilation and garbage collection Jeroen Borgers @jborgers #jfall17 Part 1: New in Java compilation Part 2: New in Java garbage collection 2 Part 1 New in Java compilation
Red Hat JBoss Data Grid 7.0
 Red Hat JBoss Data Grid 7.0 Performance Tuning Guide For use with Red Hat JBoss Data Grid 7.0 Last Updated: 2017-11-20 Red Hat JBoss Data Grid 7.0 Performance Tuning Guide For use with Red Hat JBoss Data
ORACLE ENTERPRISE MANAGER 10g ORACLE DIAGNOSTICS PACK FOR NON-ORACLE MIDDLEWARE
 ORACLE ENTERPRISE MANAGER 10g ORACLE DIAGNOSTICS PACK FOR NON-ORACLE MIDDLEWARE Most application performance problems surface during peak loads. Often times, these problems are time and resource intensive,
Consolidating OLTP Workloads on Dell PowerEdge R th generation Servers
 Consolidating OLTP Workloads on Dell PowerEdge R720 12 th generation Servers B Balamurugan Phani MV Dell Database Solutions Engineering March 2012 This document is for informational purposes only and may
Oracle JD Edwards EnterpriseOne Object Usage Tracking Performance Characterization Using JD Edwards EnterpriseOne Object Usage Tracking
 Oracle JD Edwards EnterpriseOne Object Usage Tracking Performance Characterization Using JD Edwards EnterpriseOne Object Usage Tracking ORACLE WHITE PAPER NOVEMBER 2017 Disclaimer The following is intended