EES Program Overview
|
|
|
- Emmeline McGee
- 5 years ago
- Views:
Transcription
1 EES Program Overview EES (pronounced 'ease') is an acronym for Engineering Equation Solver. The basic function provided by EES is the numerical solution of a set of algebraic equations. EES can also be used to solve differential and integral equations, do optimization, provide uncertainty analyses and linear and non-linear regression, convert units and check unit consistency and generate publication-quality plots. EES is designed for use with all Microsoft Windows operating systems from Win95 and newer. There are two major differences between EES and other equation-solving programs. First, EES allows equations to be entered in any order with unknown variables placed anywhere in the equations; EES automatically reorders the equations for efficient solution. Second, EES provides many built-in mathematical and thermophysical property functions useful for engineering calculations. For example, the steam tables are implemented such that any thermodynamic property can be obtained from a built-in function call in terms of any two other properties. Similar capability is provided for most refrigerants, ammonia, methane, carbon dioxide and other fluids. Air tables are built-in, as are psychrometric functions and JANAF data for many common gases. Transport properties are also provided for all substances. The library of mathematical and thermophysical property functions in EES is extensive, but it is not possible to anticipate every user's need. EES allows the user to enter his or her own functional relationships in three ways. First, a facility for entering and interpolating tabular data is provided so that tabular data can be directly used in the solution of the equation set. Second, the EES language supports user-written functions, procedures, modules and subprograms. Functions and procedures are similar to those in Pascal and FORTRAN in which assignment statements rather than equalities are employed. EES modules subprograms are callable EES routines that use equalities. Functions, procedures, modules, and subprograms can be saved in library files which are automatically read in when EES is started. Third, compiled functions and procedures, written in a high-level language such as Pascal, C, or FORTRAN, can be dynamically-linked with EES. These three methods of adding functional relationships provide very powerful means of extending the capabilities of EES. The motivation for EES rose out of experience in teaching mechanical engineering thermodynamics and heat transfer. To learn the material in these courses, it is necessary for the student to work problems. However, much of the time and effort required to solve problems results from looking up property information and solving the appropriate equations. Once the student is familiar with the use of property tables, further use of the tables does not contribute to the student's grasp of the subject; nor does algebra. The time and effort required to do problems in the conventional manner may actually detract from learning the subject matter by forcing the student to be concerned with the order in which the equations should be solved (which really does not matter) and by making parametric studies too laborious. Interesting practical problems that may have implicit solutions, such as those involving both thermodynamic and heat transfer considerations, are often not assigned because of their mathematical complexity. EES allows the user to concentrate more on design by freeing him or her from mundane chores. EES is particularly useful for design problems in which the effects of one or more parameters need to be determined. The program provides this capability with its Parametric Table, which is similar to a spreadsheet. The user identifies the variables which are independent by entering their values in the table cells. EES will calculate the values of the dependent variables in the table. Plotting capability is provided to display the relationship between any two variables in the table. With EES, it is no more difficult to do design problems than it is to solve a problem for a fixed set of independent variables. EES offers the advantages of a simple set of intuitive commands which a novice can quickly learn to use for solving complex problems. The large data bank of thermodynamic and transport properties built into EES is helpful in solving problems in thermodynamics, fluid mechanics, and heat transfer. EES can be used for many engineering applications; it is ideally suited for instruction in mechanical engineering courses and for the practicing engineer faced with the need for solving practical problems. Online help is provided with the program and there is an extensive manual that can be downloaded. Background Information EES begins by displaying a dialog window which shows registration information, the version number and other information. The version number and registration information will be needed if you request technical support. Click the OK button to dismiss the dialog window. Detailed help is available at any point in EES. Pressing the F1 key will bring up a Help window relating to the foremost window. Clicking the Contents button will present the Help index shown below. Clicking on an underlined word (shown in green on color monitors) will provide help relating to that subject.

2 EES commands are distributed among nine pull-down menus. (A tenth user-defined menu can be placed to the right of the Help menu. A brief summary of their functions follows. Detailed descriptions of the commands appear in Chapter 3 of the EES manual.

3 Note the a toolbar is provided below the menu bar. The toolbar contains small buttons which provide rapid access to many of the most frequently used EES menu commands. If you move the cursor over a button and wait for a few second, a few words will appear to explain the function of that button. The toolbar can be hidden, if you wish, with a control in the Preferences dialog (Options menu). The System menu represented by the EES icon appears above the file menu. The System menu is not part of EES, but rather a feature of the Windows Operating System. It holds commands which allow window moving, resizing, and switching to other applications. The File menu provides commands for loading, merging and saving work files and libraries, and printing. The Edit menu provides the editing commands to cut, copy, and paste information. The Search menu provides Find and Replace commands for use in the Equations window. The Options menu provides commands for setting the guess values and bounds of variables, the unit system, default information, and program preferences. A command is also provided for displaying information on built-in and user-supplied functions. The Calculate menu contains the commands to check, format and solve the equation set. The Tables menu contains commands to set up and alter the contents of the Parametric and Lookup Tables and to do linear regression on the data in these tables. The Parametric Table, similar to a spreadsheet, allows the equation set to be solved repeatedly while varying the values of one or more variables. The Lookup table holds user-supplied data which can be interpolated and used in the solution of the equation set. The Plot menu provides commands to modify an existing plot or prepare a new plot of data in the Parametric, Lookup, or Array tables. Curve-fitting capability is also provided. The Windows menu provides a convenient method of bringing any of the EES windows to the front or to organize the windows. The Help menu provides commands for accessing the online help documentation. The basic capability provided by EES is the solution of a set of non-linear algebraic equations. To demonstrate this capability, start EES and enter this simple example problem in the Equations window. Note that EES makes no distinction between upper and lower case letters and the ^ sign (or **) is used to signify raising to a power. If you wish, you may view the equations in mathematical notation by selecting the Formatted Equations command from the Windows menu. Select the Solve command from the Calculate menu. A dialog window will appear indicating the progress of the solution. When the calculations are completed, the button changes from Abort to Continue.


4 Click the Continue button. The solution to this equation set will then be displayed. An Example Thermodynamics Problem A simple thermodynamics problem will be set up and solved in this section to illustrate the property function access and equation solving capability of EES. The problem, typical of that which may be encountered in an undergraduate thermodynamics course, is as follows. Refrigerant-134a enters a valve at 700 kpa, 50 C with a velocity of 15 m/s. At the exit of the valve, the pressure is 300 kpa. The inlet and outlet fluid areas are both m2. Determine the temperature, mass flow rate and velocity at the valve exit. To solve this problem, it is necessary to choose a system and then apply mass and energy balances. The system is the valve. The mass flow is steady, so that the mass balance is: where = mass flowrate [kg/s] A = cross-sectional area [m2] Vel = velocity [m/s] v = specific volume [m 3 /kg] We know that The valve is assumed to be well-insulated with no moving parts. The heat and work effects are both zero. A steady-state energy balance on the valve is:
![where h is the specific enthalpy and Vel 2 /2 is the specific kinetic energy. In SI units, specific enthalpy normally has units of [kj/kg] so some units conversions may be needed.](/docs-images/96/127724510/images/5-0.jpg "EES provides unit conversion capabilities with the CONVERT function.")
5 where h is the specific enthalpy and Vel 2 /2 is the specific kinetic energy. In SI units, specific enthalpy normally has units of [kj/kg] so some units conversions may be needed. EES provides unit conversion capabilities with the CONVERT function. From relationships between the properties of R134a: Ordinarily, the terms containing velocity are neglected, primarily because the kinetic energy effects are usually small and also because these terms make the problem difficult to solve. However, with EES, the computational difficulty is not a factor. The user can solve the problem with the kinetic energy terms and judge their importance. The values of T1, P1, A1, Vel11and P2 are known. There are nine unknowns: A2,,, Vel2, h1, v1, h2, v2, T2. Since there are 9 equations, the solution to the problem is defined. It is now only necessary to solve the equations. This is where EES can help. Start EES and select the New command from the File menu. A blank Equations window will appear. Before entering the equations, however, set the unit system for the built-in thermophysical properties functions. To view or change the unit system, select Unit System from the Options menu. EES is initially configured to be in SI units with T in C, P in kpa, and specific property values in their customary units on a mass basis. These defaults may have been changed during a previous use. Click on the controls to set the units as shown above. Click the OK button (or press the Return key) to accept the unit system settings. The equations can now be entered into the Equations window. Text is entered in the same manner as for any word processor. Formatting rules are as follows: 1. Upper and lower case letters are not distinguished. EES will (optionally) change the case of all variables to match the manner in which they first appear. 2. Blank lines and spaces may be entered as desired since they are ignored. 3. Comments must be enclosed within braces { } or within quote marks " ". Comments may span as many lines as needed. Comments within braces may be nested in which case only the outermost set of { } are recognized. Comments within quotes will also be displayed in the Formatted Equations window. 4. Variable names must start with a letter and consist of any keyboard characters except ( ) * / + - ^ { } : " or ;. Array variables are identified with square braces around the array index or indices, e.g., X[5,3]. String variables are identified with a $ as the last character in the variable name. The maximum length of a variable name is 30 characters. 5. Multiple equations may be entered on one line if they are separated by a semi-colon (;). The maximum line length is 255 characters.

6 6. The caret symbol ^ or ** is used to indicate raising to a power. 7. The order in which the equations are entered does not matter. 8. The position of knowns and unknowns in the equation does not matter. After entering the equations for this problem and (optionally) checking the syntax using the Check/Format command in the Calculate menu, the Equations window will appear as shown. Comments are normally displayed in blue on a color monitor. Other formatting options are set with the Preferences command in the Options menu. Note the use of the Convert function in this example to convert the units of the specific kinetic energy [m^2/s^2] to the units used for specific enthalpy [kj/kg]. The Convert function is most useful in these problems. The thermodynamic property functions, such as enthalpy and volume require a special format. The first argument of the function is the substance name, R134a in this case. The following arguments are the independent variables preceded by a single identifying letter and an equal sign. Allowable letters are T, P, H, U, S, V, and X, corresponding to temperature, pressure, specific enthalpy, specific internal energy, specific entropy, specific volume, and quality. (For psychrometric functions, additional allowable letters are W, R, D, and B, corresponding to humidity ratio, relative humidity, dewpoint temperature, and wetbulb temperature.) An easy way to enter functions, without needing to recall the format, is to use the Function Information command in the Options menu. This command will bring up the dialog window shown below. Click on the Thermophysical props radio button. The list of built-in thermophysical property function will appear on the left with the list of substances on the right. Select the property function by clicking on its name, using the scroll bar, if necessary, to bring it into view. Select a substance in the same manner. An example of the function showing the format will appear in the Example rectangle at the bottom. The information in the rectangle may be changed, if needed. Clicking the Paste button will copy the Example into the Equations window at the cursor position. Additional information is available by clicking the Info button.

7 It is usually a good idea to set the guess values and (possibly) the lower and upper bounds for the variables before attempting to solve the equations. This is done with the Variable Information command in the Options menu. Before displaying the Variable Information dialog, EES checks syntax and compiles newly entered and/or changed equations, and then solves all equations with one unknown. The Variable Information dialog will then appear. The Variable Information dialog contains a line for each variable appearing in the Equations window. By default, each variable has a guess value of 1.0 with lower and upper bounds of negative and positive infinity. (The lower and upper bounds are shown in italics if EES has previously calculated the value of the variable. In this case, the Guess value column displays the calculated value. These italicized values may still be edited, which will force EES to recalculate the value of that variable.) The A in the Display options column indicates that EES will automatically determine the display format for numerical value of the variable when it is displayed in the Solution window. In this case, EES will select an appropriate number of digits, so the digits column to the right of the A is disabled. Automatic formatting is the default. Alternative display options are F (for fixed number of digits to the right of the decimal point) and E (for exponential format). The display and other defaults can easily be changed with the Default Information command in the Options menu, discussed in Chapter 3. The third Display options column controls the hilighting effects such as normal (default), bold, boxed. The units of the variables can be specified, if desired. The units will be displayed with the variable in the Solution window and/or in the Parametric Table. EES does not automatically do unit conversions but it can provide unit conversions using the Convert function. The units information entered here is only for display purposes. With nonlinear equations, it is sometimes necessary to provide reasonable guess values and bounds in order to determine the desired solution. (It is not necessary for this problem.) The bounds of some variables are known from the physics of the problem. In the example problem, the enthalpy at the outlet, h2, should be reasonably close to the value of h1. Set its guess value to 100 and its lower bound to 0. Set the guess value of the outlet specific volume, v2, to 0.1 and its lower bound to 0. Scroll the variable information list to bring Vel2 into view. The lower bound of Vel2 should also be zero. To solve the equation set, select the Solve command from the Calculate menu. An information dialog will appear indicating the elapsed time, maximum residual (i.e., the difference between the left-hand side and right-hand side of an equation) and the maximum change in the values of the variables since the last iteration. When the calculations are completed, EES displays the total number of equations in the problem and the number of blocks. A block is a subset of equations which can be solved independently. EES automatically blocks the equation set, whenever possible, to improve the calculation efficiency, as described in Appendix B. When the calculations are completed, the button will change from Abort to Continue.


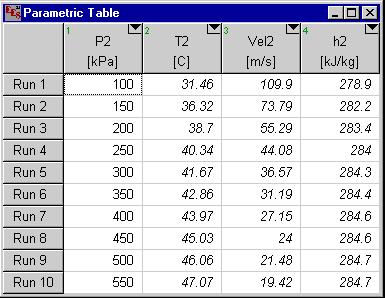
8 By default, the calculations are stopped when 100 iterations have occurred, the elapsed time exceeds 60 sec, the maximum residual is less than 10-6 or the maximum variable change is less than These defaults can be changed with the Stop Criteria command in the Options menu. If the maximum residual is larger than the value set for the stopping criteria, the equations were not correctly solved, possibly because the bounds on one or more variables constrained the solution. Clicking the Continue button will remove the information dialog and display the Solution window shown on the next page. The problem is now completed since the values of T2, m2, and Vel2 are determined. One of the most useful features of EES is its ability to provide parametric studies. For example, in this problem, it may be of interest to see how the throttle outlet temperature and outlet velocity vary with outlet pressure. A series of calculations can be automated and plotted using the commands in the Tables menu. Select the New Table command. A dialog will be displayed listing the variables appearing in the Equations window. In this case, we will construct a table containing the variables P2, T2, Vel2, and h2. Click on P2 from the variable list on the left. This will cause P2 to be highlighted and the Add button will become active. Now click the Add button to move P2 to the list of variables on the right. Repeat for T2, h2, and Vel2, using the scroll bar to bring the variable into view if necessary. (As a short cut, you can double-click on the variable name in the list on the left to


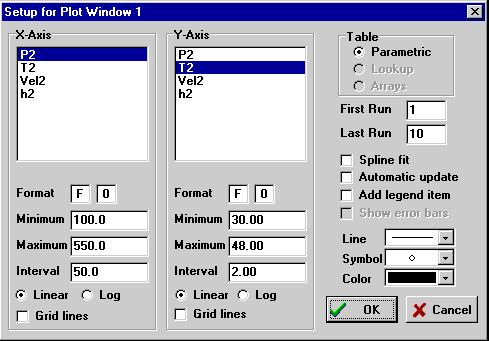
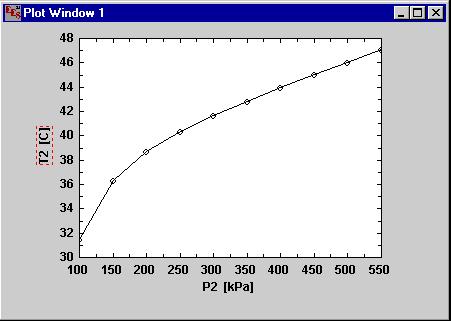
9 move it to the list on the right.). The table setup dialog should now appear as shown above. Click the OK button to create the table. The Parametric Table works much like a spreadsheet. You can type numbers directly into the cells. Numbers which you enter are shown in black and produce the same effect as if you set the variable to that value with an equation in the Equations window. Delete the P2 =300 equation currently in the Equations window or enclose it in comment brackets { }. This equation will not be needed because the value of P2 will be set in the table. Now enter the values of P2 for which T2 is be determined. Values of 100 to 550 have been chosen for this example. (The values could also be automatically entered using Alter Values in the Tables menu or by using the Alter Values control at the upper right of each table column header, as explained in Chapter 2.) The Parametric Table should now appear as shown below. Now, select Solve Table from the Calculate menu. The Solve Table dialog window will appear allowing you to choose the runs for which the calculations will be done. When the Update Guess Values control is selected, as shown, the solution for the last run will provide guess values for the following run. Click the OK button. A status window will be displayed, indicating the progress of the solution. When the calculations are completed, the values of T2, Vel2, and h2 will be entered into the table. The values calculated by EES will be displayed in blue, bold or italic type depending on the setting made in the Screen Display tab of the Preferences dialog window in the Options menu. The relationship between variables such as P2 and T2 is now apparent, but it can more clearly be seen with a plot. Select New Plot Window from the Plot menu. The New Plot Window dialog window shown below will appear. Choose P2 to be the x-axis by clicking on P2 in the x-axis list. Click on T2 in the y-axis list. Select the scale limits for P2 and T2, and set the number of divisions for the scale as shown. Grid lines make the plot easier to read. Click on the Grid Lines control for both the x and y axes. When you click the OK button, the plot will be constructed and the plot window will appear as shown.
10
11 Once created, there are a variety of ways in which the appearance of the plot can be changed as described in the Plot Windows section of Chapter 2 and in the Plot menu section of Chapter 3 in the EES manual. This example problem illustrates some of the capabilities of EES. With this example behind you, you should be able to solve many types of problems. However, EES has many more capabilities and features, such as curve-fitting, uncertainty analyses, complex variables, arrays. EES will change the way you work and the way you think. If you routinely solve equations, EES is for you. EES is a general equation- solving program capable of solving hundreds of non-linear algebraic and differential equations. EES has built-in functions for the thermodynamic and transport properties of many substances and the capability for you to easily add your own functions. EES can do regression and optimization. The plotting capability in EES is often claimed to be as good or better than stand-alone plotting programs.
E E S. Engineering Equation Solver. for Microsoft Windows Operating Systems. Commercial and Professional Versions
 E E S Engineering Equation Solver for Microsoft Windows Operating Systems Commercial and Professional Versions F-Chart Software http://www.fchart.com/ email: info@fchart.com Copyright 1992-2007 by S.A.
E E S. Engineering Equation Solver. for Microsoft Windows Operating Systems* Commercial and Professional Versions
 E E S Engineering Equation Solver for Microsoft Windows Operating Systems* Commercial and Professional Versions F-Chart Software http://www.fchart.com/ email: info@fchart.com *EES is designed to operate
E E S. Engineering Equation Solver. for Microsoft Windows Operating Systems* Commercial and Professional Versions
 E E S Engineering Equation Solver for Microsoft Windows Operating Systems* Commercial and Professional Versions F-Chart Software http://fchart.com/ email: info@fchart.com *EES is designed to operate in
EXCEL 2003 DISCLAIMER:
 EXCEL 2003 DISCLAIMER: This reference guide is meant for experienced Microsoft Excel users. It provides a list of quick tips and shortcuts for familiar features. This guide does NOT replace training or
Excel 2010: Getting Started with Excel
 Excel 2010: Getting Started with Excel Excel 2010 Getting Started with Excel Introduction Page 1 Excel is a spreadsheet program that allows you to store, organize, and analyze information. In this lesson,
Microsoft Word for Report-Writing (2016 Version)
") Microsoft Word for Report-Writing (2016 Version) Microsoft Word is a versatile, widely-used tool for producing presentation-quality documents. Most students are well-acquainted with the program for generating
Microsoft Word for Report-Writing (2016 Version) Microsoft Word is a versatile, widely-used tool for producing presentation-quality documents. Most students are well-acquainted with the program for generating
The Mathcad Workspace 7
 For information on system requirements and how to install Mathcad on your computer, refer to Chapter 1, Welcome to Mathcad. When you start Mathcad, you ll see a window like that shown in Figure 2-1. By
First Steps - Ball Valve Design
 COSMOSFloWorks 2004 Tutorial 1 First Steps - Ball Valve Design This First Steps tutorial covers the flow of water through a ball valve assembly before and after some design changes. The objective is to
Tutorial 1. Introduction to Using FLUENT: Fluid Flow and Heat Transfer in a Mixing Elbow
 Tutorial 1. Introduction to Using FLUENT: Fluid Flow and Heat Transfer in a Mixing Elbow Introduction This tutorial illustrates the setup and solution of the two-dimensional turbulent fluid flow and heat
Excel 2010: Basics Learning Guide
 Excel 2010: Basics Learning Guide Exploring Excel 2010 At first glance, Excel 2010 is largely the same as before. This guide will help clarify the new changes put into Excel 2010. The File Button The purple
INTRODUCTION... 1 UNDERSTANDING CELLS... 2 CELL CONTENT... 4
 Introduction to Microsoft Excel 2016 INTRODUCTION... 1 The Excel 2016 Environment... 1 Worksheet Views... 2 UNDERSTANDING CELLS... 2 Select a Cell Range... 3 CELL CONTENT... 4 Enter and Edit Data... 4
Dynamics and Vibration. Tutorial
 Dynamics and Vibration Tutorial Startup To use Dynamics and Vibration Analysis (DVA), you must first start TK Solver. Once in TK, select Dynamics & Vibration from the Applications Menu. The DVA Menu will
Introduction to the workbook and spreadsheet
 Excel Tutorial To make the most of this tutorial I suggest you follow through it while sitting in front of a computer with Microsoft Excel running. This will allow you to try things out as you follow along.
Heat Exchanger Efficiency
 6 Heat Exchanger Efficiency Flow Simulation can be used to study the fluid flow and heat transfer for a wide variety of engineering equipment. In this example we use Flow Simulation to determine the efficiency
This tutorial walks you through the process of using CC BATCH to simulate a batch distillation column.
 CC-BATCH Tutorial This tutorial walks you through the process of using CC BATCH to simulate a batch distillation column. Description of the Problem The simulation you will create is a five step batch distillation
Contents Microsoft Excel Lesson 1: Entering Text and Numbers...4 The Microsoft Excel Window...4 The Microsoft Office Button...
 Contents Microsoft Excel 2007...4 Lesson 1: Entering Text and Numbers...4 The Microsoft Excel Window...4 The Microsoft Office Button...5 The Quick Access Toolbar...5 The Title Bar...5 The Ribbon...5 Worksheets...6
EXCEL SPREADSHEET TUTORIAL
 EXCEL SPREADSHEET TUTORIAL Note to all 200 level physics students: You will be expected to properly format data tables and graphs in all lab reports, as described in this tutorial. Therefore, you are responsible
AEMLog Users Guide. Version 1.01
 AEMLog Users Guide Version 1.01 INTRODUCTION...2 DOCUMENTATION...2 INSTALLING AEMLOG...4 AEMLOG QUICK REFERENCE...5 THE MAIN GRAPH SCREEN...5 MENU COMMANDS...6 File Menu...6 Graph Menu...7 Analysis Menu...8
Microsoft Excel 2010 Basics
 Microsoft Excel 2010 Basics Starting Word 2010 with XP: Click the Start Button, All Programs, Microsoft Office, Microsoft Excel 2010 Starting Word 2010 with 07: Click the Microsoft Office Button with the
Microsoft Excel 2010 Handout
 Microsoft Excel 2010 Handout Excel is an electronic spreadsheet program you can use to enter and organize data, and perform a wide variety of number crunching tasks. Excel helps you organize and track
Appendix H: Introduction to Maple
 Appendix H: Introduction to Maple Maple is an application that can be used to analytically solve algebraic and differential equations. The capability to differentiate, integrate and algebraically manipulate
IT 374 C# and Applications/ IT695 C# Data Structures
 IT 374 C# and Applications/ IT695 C# Data Structures Module 2.1: Introduction to C# App Programming Xianrong (Shawn) Zheng Spring 2017 1 Outline Introduction Creating a Simple App String Interpolation
EESy Solutions Engineering Equation Solver Newsletter
 EESy Solutions Engineering Equation Solver Newsletter Inside this issue: Welcome 1 The 64-bit EES Application 1 The 64-bit License File 2 64-bit Number Representation 2 64-bit File Types 2 Example of Computational
Microsoft Excel 2010 Tutorial
 1 Microsoft Excel 2010 Tutorial Excel is a spreadsheet program in the Microsoft Office system. You can use Excel to create and format workbooks (a collection of spreadsheets) in order to analyze data and
Objective 1: Familiarize yourself with basic database terms and definitions. Objective 2: Familiarize yourself with the Access environment.
 Beginning Access 2007 Objective 1: Familiarize yourself with basic database terms and definitions. What is a Database? A Database is simply defined as a collection of related groups of information. Things
IDS 101 Introduction to Spreadsheets
 IDS 101 Introduction to Spreadsheets A spreadsheet will be a valuable tool in our analysis of the climate data we will examine this year. The specific goals of this module are to help you learn: how to
AEMLog users guide V User Guide - Advanced Engine Management 2205 West 126 th st Hawthorne CA,
 AEMLog users guide V 1.00 User Guide - Advanced Engine Management 2205 West 126 th st Hawthorne CA, 90250 310-484-2322 INTRODUCTION...2 DOCUMENTATION...2 INSTALLING AEMLOG...4 TRANSFERRING DATA TO AND
Excel Tutorial 1: Getting Started with Excel
 Excel Tutorial 1: Getting Started with Excel TRUE/FALSE 1. The name of the active workbook appears in the status bar of the Excel window. ANS: F PTS: 1 REF: EX 2 2. The formula bar displays the value or
Getting Started With Excel
 Chapter 1 Getting Started With Excel This chapter will familiarize you with various basic features of Excel. Specific features which you need to solve a problem will be introduced as the need arises. When
WEEK NO. 12 MICROSOFT EXCEL 2007
 WEEK NO. 12 MICROSOFT EXCEL 2007 LESSONS OVERVIEW: GOODBYE CALCULATORS, HELLO SPREADSHEET! 1. The Excel Environment 2. Starting A Workbook 3. Modifying Columns, Rows, & Cells 4. Working with Worksheets
Excel Primer CH141 Fall, 2017
 Excel Primer CH141 Fall, 2017 To Start Excel : Click on the Excel icon found in the lower menu dock. Once Excel Workbook Gallery opens double click on Excel Workbook. A blank workbook page should appear
Pre-Lab Excel Problem
 Pre-Lab Excel Problem Read and follow the instructions carefully! Below you are given a problem which you are to solve using Excel. If you have not used the Excel spreadsheet a limited tutorial is given
Microsoft Excel Using Excel in the Science Classroom
 Microsoft Excel Using Excel in the Science Classroom OBJECTIVE Students will take data and use an Excel spreadsheet to manipulate the information. This will include creating graphs, manipulating data,
SyncFirst Standard. Quick Start Guide User Guide Step-By-Step Guide
 SyncFirst Standard Quick Start Guide Step-By-Step Guide How to Use This Manual This manual contains the complete documentation set for the SyncFirst system. The SyncFirst documentation set consists of
Using DataQuest on a Handheld
 Using DataQuest on a Handheld Appendix B This appendix gives an overview of using the Vernier DataQuest application on a TI-Nspire handheld. It includes information on accessing the common tools in the
Gloucester County Library System. Excel 2010
 Gloucester County Library System Excel 2010 Introduction What is Excel? Microsoft Excel is an electronic spreadsheet program. It is capable of performing many different types of calculations and can organize
Microsoft Excel 2010
 Microsoft Excel 2010 omar 2013-2014 First Semester 1. Exploring and Setting Up Your Excel Environment Microsoft Excel 2010 2013-2014 The Ribbon contains multiple tabs, each with several groups of commands.
First Steps - Conjugate Heat Transfer
 COSMOSFloWorks 2004 Tutorial 2 First Steps - Conjugate Heat Transfer This First Steps - Conjugate Heat Transfer tutorial covers the basic steps to set up a flow analysis problem including conduction heat
Introduction to CFX. Workshop 2. Transonic Flow Over a NACA 0012 Airfoil. WS2-1. ANSYS, Inc. Proprietary 2009 ANSYS, Inc. All rights reserved.
 Workshop 2 Transonic Flow Over a NACA 0012 Airfoil. Introduction to CFX WS2-1 Goals The purpose of this tutorial is to introduce the user to modelling flow in high speed external aerodynamic applications.
EXCEL TUTORIAL.
 EXCEL TUTORIAL Excel is software that lets you create tables, and calculate and analyze data. This type of software is called spreadsheet software. Excel lets you create tables that automatically calculate
Tutorial 2. Modeling Periodic Flow and Heat Transfer
 Tutorial 2. Modeling Periodic Flow and Heat Transfer Introduction: Many industrial applications, such as steam generation in a boiler or air cooling in the coil of an air conditioner, can be modeled as
CHAPTER 1 GETTING STARTED
 GETTING STARTED WITH EXCEL CHAPTER 1 GETTING STARTED Microsoft Excel is an all-purpose spreadsheet application with many functions. We will be using Excel 97. This guide is not a general Excel manual,
Experiment 1 CH Fall 2004 INTRODUCTION TO SPREADSHEETS
 Experiment 1 CH 222 - Fall 2004 INTRODUCTION TO SPREADSHEETS Introduction Spreadsheets are valuable tools utilized in a variety of fields. They can be used for tasks as simple as adding or subtracting
Spreadsheet definition: Starting a New Excel Worksheet: Navigating Through an Excel Worksheet
 Copyright 1 99 Spreadsheet definition: A spreadsheet stores and manipulates data that lends itself to being stored in a table type format (e.g. Accounts, Science Experiments, Mathematical Trends, Statistics,
A Tutorial for Excel 2002 for Windows
 INFORMATION SYSTEMS SERVICES Data Manipulation with Microsoft Excel 2002 A Tutorial for Excel 2002 for Windows AUTHOR: Information Systems Services DATE: August 2004 EDITION: 1.0 TUT 130 UNIVERSITY OF
Outline. More on Excel. Review Entering Formulas. Review Excel Basics Home tab selected here Tabs Different ribbon commands. Copying Formulas (2/2)
") More on Excel Larry Caretto Mechanical Engineering 09 Programming for Mechanical Engineers January 6, 017 Outline Review last class Spreadsheet basics Entering and copying formulas Discussion of Excel
More on Excel Larry Caretto Mechanical Engineering 09 Programming for Mechanical Engineers January 6, 017 Outline Review last class Spreadsheet basics Entering and copying formulas Discussion of Excel
Standardized Tests: Best Practices for the TI-Nspire CX
 The role of TI technology in the classroom is intended to enhance student learning and deepen understanding. However, efficient and effective use of graphing calculator technology on high stakes tests
lab MS Excel 2010 active cell
 MS Excel is an example of a spreadsheet, a branch of software meant for performing different kinds of calculations, numeric data analysis and presentation, statistical operations and forecasts. The main
COPYRIGHTED MATERIAL INTRODUCTION TO ASPEN PLUS CHAPTER ONE
 CHAPTER ONE INTRODUCTION TO ASPEN PLUS Aspen Plus is based on techniques for solving flowsheets that were employed by chemical engineers many years ago. Computer programs were just beginning to be used,
CITS2401 Computer Analysis & Visualisation
 FACULTY OF ENGINEERING, COMPUTING AND MATHEMATICS CITS2401 Computer Analysis & Visualisation SCHOOL OF COMPUTER SCIENCE AND SOFTWARE ENGINEERING Topic 3 Introduction to Matlab Material from MATLAB for
GCSE CCEA GCSE EXCEL 2010 USER GUIDE. Business and Communication Systems
 GCSE CCEA GCSE EXCEL 2010 USER GUIDE Business and Communication Systems For first teaching from September 2017 Contents Page Define the purpose and uses of a spreadsheet... 3 Define a column, row, and
Compressible Flow in a Nozzle
 SPC 407 Supersonic & Hypersonic Fluid Dynamics Ansys Fluent Tutorial 1 Compressible Flow in a Nozzle Ahmed M Nagib Elmekawy, PhD, P.E. Problem Specification Consider air flowing at high-speed through a
Lecture- 5. Introduction to Microsoft Excel
 Lecture- 5 Introduction to Microsoft Excel The Microsoft Excel Window Microsoft Excel is an electronic spreadsheet. You can use it to organize your data into rows and columns. You can also use it to perform
CounselLink Reporting. Designer
 CounselLink Reporting Designer Contents Overview... 1 Introduction to the Document Editor... 2 Create a new document:... 2 Document Templates... 3 Datasets... 3 Document Structure... 3 Layout Area... 4
Data Acquisition with CP-2002/2003 Micro-GC Control
 Varian Analytical Instruments 2700 Mitchell Drive Walnut Creek, CA 94598 Star Chromatography Workstation Version 6 Data Acquisition with CP-2002/2003 Micro-GC Control Operation Manual Varian, Inc. 2002
Microsoft Excel Important Notice
 Microsoft Excel 2013 Important Notice All candidates who follow an ICDL/ECDL course must have an official ICDL/ECDL Registration Number (which is proof of your Profile Number with ICDL/ECDL and will track
Teacher Activity: page 1/9 Mathematical Expressions in Microsoft Word
 Teacher Activity: page 1/9 Mathematical Expressions in Microsoft Word These instructions assume that you are familiar with using MS Word for ordinary word processing *. If you are not comfortable entering
TUTORIAL - COMMAND CENTER
 FLOTHERM V3.1 Introductory Course TUTORIAL - COMMAND CENTER Introduction This tutorial covers the basic operation of the Command Center Application Window (CC) by walking the user through the main steps
Access 2003 Introduction to Report Design
 Access 2003 Introduction to Report Design TABLE OF CONTENTS CREATING A REPORT IN DESIGN VIEW... 3 BUILDING THE REPORT LAYOUT... 5 SETTING THE REPORT WIDTH... 5 DISPLAYING THE FIELD LIST... 5 WORKING WITH
TI-89 Calculator Workshop #1 The Basics
 page 1 TI-89 Calculator Workshop #1 The Basics After completing this workshop, students will be able to: 1. find, understand, and manipulate keys on the calculator keyboard 2. perform basic computations
Language Basics. /* The NUMBER GAME - User tries to guess a number between 1 and 10 */ /* Generate a random number between 1 and 10 */
 Overview Language Basics This chapter describes the basic elements of Rexx. It discusses the simple components that make up the language. These include script structure, elements of the language, operators,
Dealing with Data in Excel 2013/2016
 Dealing with Data in Excel 2013/2016 Excel provides the ability to do computations and graphing of data. Here we provide the basics and some advanced capabilities available in Excel that are useful for
MOVING FROM CELL TO CELL
 VCAE: EXCEL Lesson 1 Please send comments to Author: Zahra Siddiqui at zed_ess@hotmail.com Concepts Covered: Cell Address; Cell Pointer; Moving across Cells Constants: Entering, Editing, Formatting Using
Chapter 4. Microsoft Excel
 Chapter 4 Microsoft Excel Topic Introduction Spreadsheet Basic Screen Layout Modifying a Worksheet Formatting Cells Formulas and Functions Sorting and Filling Borders and Shading Charts Introduction A
Two-Dimensional Projectile Motion
 Two-Dimensional Projectile Motion I. Introduction. This experiment involves the study of motion using a CCD video camera in which a sequence of video frames (a movie ) is recorded onto computer disk and
µ = Pa s m 3 The Reynolds number based on hydraulic diameter, D h = 2W h/(w + h) = 3.2 mm for the main inlet duct is = 359
 = 3.2 mm for the main inlet duct is = 359") Laminar Mixer Tutorial for STAR-CCM+ ME 448/548 March 30, 2014 Gerald Recktenwald gerry@pdx.edu 1 Overview Imagine that you are part of a team developing a medical diagnostic device. The device has a millimeter
Laminar Mixer Tutorial for STAR-CCM+ ME 448/548 March 30, 2014 Gerald Recktenwald gerry@pdx.edu 1 Overview Imagine that you are part of a team developing a medical diagnostic device. The device has a millimeter
I/A Series Software Spreadsheet
 I/A Series Software Spreadsheet The I/A Series Spreadsheet is an interactive, easy-to-use tool, that allows process operators, engineers, and managers to manipulate data in a row/column format and graph
Excel 2003 Tutorial II
 This tutorial was adapted from a tutorial by see its complete version at http://www.fgcu.edu/support/office2000/excel/index.html Excel 2003 Tutorial II Charts Chart Wizard Chart toolbar Resizing a chart
Workbench Tutorial Flow Over an Airfoil, Page 1 ANSYS Workbench Tutorial Flow Over an Airfoil
 Workbench Tutorial Flow Over an Airfoil, Page 1 ANSYS Workbench Tutorial Flow Over an Airfoil Authors: Scott Richards, Keith Martin, and John M. Cimbala, Penn State University Latest revision: 17 January
Mastering EES. Sanford Klein and Gregory Nellis. Spatial temperature gradient (K/m) Temperature (K) x Time (s)
 Temperature (K) x Time (s)") Mastering EES Sanford Klein and Gregory Nellis Spatial temperature gradient (K/m) x 10 4 5 4 x=0.25 cm 3 x=0.5 cm x=0.75 cm 2 x=1.0 cm x=1.5 cm 1 x=2.0 cm 0 0 25 50 75 100 125 150 Time (s) 400 Temperature
Mastering EES Sanford Klein and Gregory Nellis Spatial temperature gradient (K/m) x 10 4 5 4 x=0.25 cm 3 x=0.5 cm x=0.75 cm 2 x=1.0 cm x=1.5 cm 1 x=2.0 cm 0 0 25 50 75 100 125 150 Time (s) 400 Temperature
Beginner s Guide to Microsoft Excel 2002
 Beginner s Guide to Microsoft Excel 2002 Microsoft Excel lets you create spreadsheets, which allow you to make budgets, track inventories, calculate profits, and design charts and graphs. 1. Open Start
Excel For Algebra. Conversion Notes: Excel 2007 vs Excel 2003
 Excel For Algebra Conversion Notes: Excel 2007 vs Excel 2003 If you re used to Excel 2003, you re likely to have some trouble switching over to Excel 2007. That s because Microsoft completely reworked
Microsoft Excel 2007
 Microsoft Excel 2007 1 Excel is Microsoft s Spreadsheet program. Spreadsheets are often used as a method of displaying and manipulating groups of data in an effective manner. It was originally created
Graphing Calculator Scientific Calculator Version 2.0
 Graphing Calculator Scientific Calculator Version 2.0 www.infinitysw.com/ets March 14, 2017 1 Table of Contents Table of Contents 1 Overview 3 2 Navigation 4 3 Using the Calculator 5 Display 5 Performing
Physics 251 Laboratory Introduction to Spreadsheets
 Physics 251 Laboratory Introduction to Spreadsheets Pre-Lab: Please do the lab-prep exercises on the web. Introduction Spreadsheets have a wide variety of uses in both the business and academic worlds.
Microsoft Excel Level 2
 Microsoft Excel Level 2 Table of Contents Chapter 1 Working with Excel Templates... 5 What is a Template?... 5 I. Opening a Template... 5 II. Using a Template... 5 III. Creating a Template... 6 Chapter
TABLE OF CONTENTS PART I: BASIC MICROSOFT WORD TOOLS... 1 PAGE BREAKS... 1 SECTION BREAKS... 3 STYLES... 6 TABLE OF CONTENTS... 8
 TABLE OF CONTENTS PART I: BASIC MICROSOFT WORD TOOLS... 1 PAGE BREAKS... 1 SECTION BREAKS... 3 STYLES... 6 TABLE OF CONTENTS... 8 LIST OF TABLES / LIST OF FIGURES... 11 PART II: FORMATTING REQUIREMENTS:
Figure 1: My Blocks are blue in color, and they appear in the Custom palette in NXT-G.
 What is a My Block? The Common and Complete palettes in the NXT-G programming system contain all of the built-in blocks that you can use to create an NXT program. The NXT-G software also allows you to
Graphing Calculator Tutorial
 Graphing Calculator Tutorial This tutorial is designed as an interactive activity. The best way to learn the calculator functions will be to work the examples on your own calculator as you read the tutorial.
Text and Lists Use Styles. What Are Styles?
 Creating Accessible Word Documents Using Microsoft Word 2003 Cassandra Tex, MBA Assistive Technology Specialist Student Disability Resource Center Humboldt State University Word documents are inherently
0 Graphical Analysis Use of Excel
 Lab 0 Graphical Analysis Use of Excel What You Need To Know: This lab is to familiarize you with the graphing ability of excels. You will be plotting data set, curve fitting and using error bars on the
Excel Spreadsheets and Graphs
 Excel Spreadsheets and Graphs Spreadsheets are useful for making tables and graphs and for doing repeated calculations on a set of data. A blank spreadsheet consists of a number of cells (just blank spaces
WORD XP/2002 USER GUIDE. Task- Formatting a Document in Word 2002
 University of Arizona Information Commons Training Page 1 of 21 WORD XP/2002 USER GUIDE Task- Formatting a Document in Word 2002 OBJECTIVES: At the end of this course students will have a basic understanding
Code::Blocks Student Manual
 Code::Blocks Student Manual Lawrence Goetz, Network Administrator Yedidyah Langsam, Professor and Theodore Raphan, Distinguished Professor Dept. of Computer and Information Science Brooklyn College of
Workbook Also called a spreadsheet, the Workbook is a unique file created by Excel. Title bar
 Microsoft Excel 2007 is a spreadsheet application in the Microsoft Office Suite. A spreadsheet is an accounting program for the computer. Spreadsheets are primarily used to work with numbers and text.
For many people, learning any new computer software can be an anxietyproducing
 1 Getting to Know Stata 12 For many people, learning any new computer software can be an anxietyproducing task. When that computer program involves statistics, the stress level generally increases exponentially.
Creating a data file and entering data
 4 Creating a data file and entering data There are a number of stages in the process of setting up a data file and analysing the data. The flow chart shown on the next page outlines the main steps that
Gloucester County Library System EXCEL 2007
 Gloucester County Library System EXCEL 2007 Introduction What is Excel? Microsoft E x c e l is an electronic s preadsheet program. I t is capable o f performing many diff e r e n t t y p e s o f c a l
 ("' du
 How to Make Graphs with Excel 2007
 Appendix A How to Make Graphs with Excel 2007 A.1 Introduction This is a quick-and-dirty tutorial to teach you the basics of graph creation and formatting in Microsoft Excel. Many of the tasks that you
Namma Kalvi COMPUTER APPLICATIONS
 COMPUTER APPLICATIONS 7. WORKING WITH OPEN OFFICE CALC SECTION A Choose the correct answer 1. Which is the first electronic spreadsheet? (A)Excel (B) Lotus 1-2-3 (C) Visicalc (D) OpenOffice Calc 2. Which
Free Convection Cookbook for StarCCM+
 ME 448/548 February 28, 2012 Free Convection Cookbook for StarCCM+ Gerald Recktenwald gerry@me.pdx.edu 1 Overview Figure 1 depicts a two-dimensional fluid domain bounded by a cylinder of diameter D. Inside
EXCEL 2007 TIP SHEET. Dialog Box Launcher these allow you to access additional features associated with a specific Group of buttons within a Ribbon.
 EXCEL 2007 TIP SHEET GLOSSARY AutoSum a function in Excel that adds the contents of a specified range of Cells; the AutoSum button appears on the Home ribbon as a. Dialog Box Launcher these allow you to
1. What specialist uses information obtained from bones to help police solve crimes?
 Mathematics: Modeling Our World Unit 4: PREDICTION HANDOUT VIDEO VIEWING GUIDE H4.1 1. What specialist uses information obtained from bones to help police solve crimes? 2.What are some things that can
SKILL AREA 210: USE A WORD PROCESSING SOFTWARE. Lesson 1: Getting Familiar with Microsoft Word 2007 for Windows...5
 Contents Microsoft Word 2007...5 Lesson 1: Getting Familiar with Microsoft Word 2007 for Windows...5 The Microsoft Office Button...6 The Quick Access Toolbar...6 The Title Bar...6 The Ribbon...6 The Ruler...6
Vensim PLE Quick Reference and Tutorial
 Vensim PLE Quick Reference and Tutorial Main Toolbar Sketch Tools Menu Title Bar Analysis Tools Build (Sketch)Window Status Bar General Points 1. File operations and cutting/pasting work in the standard
Our Strategy for Learning Fortran 90
 Our Strategy for Learning Fortran 90 We want to consider some computational problems which build in complexity. evaluating an integral solving nonlinear equations vector/matrix operations fitting data
Excel Basics Rice Digital Media Commons Guide Written for Microsoft Excel 2010 Windows Edition by Eric Miller
 Excel Basics Rice Digital Media Commons Guide Written for Microsoft Excel 2010 Windows Edition by Eric Miller Table of Contents Introduction!... 1 Part 1: Entering Data!... 2 1.a: Typing!... 2 1.b: Editing
proficient in applying mathematics knowledge/skills as specified in the Utah Core State Standards. The student generally content, and engages in
 ELEMENTARY MATH GRADE 6 PLD Standard Below Proficient Approaching Proficient Proficient Highly Proficient The Level 1 student is below The Level 2 student is The Level 3 student is The Level 4 student
Supersonic Flow Over a Wedge
 SPC 407 Supersonic & Hypersonic Fluid Dynamics Ansys Fluent Tutorial 2 Supersonic Flow Over a Wedge Ahmed M Nagib Elmekawy, PhD, P.E. Problem Specification A uniform supersonic stream encounters a wedge