GUIDE TO View3D. Introduction to View3D
|
|
|
- Pauline Skinner
- 6 years ago
- Views:
Transcription
1 View3D Guide Introduction to View3D... 1 Starting Hampson-Russell Software... 2 Starting View3D... 4 A Brief Summary of the View3D Process... 8 Loading the Seismic and Horizon Data... 8 Viewing the Data Scaling the Plot Saving the Viewing Parameters Stopping This Tutorial Adding Slices Displaying Attribute Values Changing Color Keys For Color Plots Showing Traces and Color Plots Together Top, Side and Other Points of View Special Zoom Views Birds' Eye View Magnifying Glass Zoom Oblique Slices, Fences and Probes Oblique Slices (Rotated Slices) Making Fences Probes Showing Well Log Data Selecting Which Wells to View Emphasing Value Ranges and Setting Transparency: Visual Control Removing Data From View3D Loading Data Slices as Horizons... 43

2 VIEW3D 1 GUIDE TO View3D Introduction to View3D View3D is a program used to view wellbore paths, well data, seismic data and attribute data as a three dimensional volume. The general objective is to better visualize, illustrate and spatially analyze the data from HRS programs. This tutorial takes you through the most important options and features of View3D. The data set for this tutorial consists of: A SEGY file, seismic.vol, which is a 3D post-stack data set. An attribute volume, scaled_porosity.vol, which is a 3D post-stack data set. 7 wells. Each well contains a sonic log (p wave), density log, porosity log and a checkshot file. A horizon file, Target_hrz. Two data slices: seismic target and scaled porosity, positioned at the same place as the horizon file.

3 2 VIEW3D Starting Hampson-Russell Software The first step is to start the GEOVIEW program. GEOVIEW is the application manager that acts as a launch pad for other Hampson-Russell programs. If you are unfamiliar with the use of GEOVIEW, please refer to the Guide to GEOVIEW and elog documentation. On a Unix workstation, go to a command window and typing: GEOVIEW <RETURN> On a PC, click the Start button and select the GEOVIEW option on the Programs / HRS applications menu. When you first launch GEOVIEW, the first window that you see is the Opened Database List, which displays your recently used databases. A database is identified by the extension wdb. For this tutorial, a database has already been created for you. To load this database for the first time, click Open to bring up the Directory Chooser. Click the view3d folder of the HRS/data directory to bring up a list of databases in that folder. Click the View3D.wdb item in the Available List and click OK.
4 VIEW3D 3 The GEOVIEW Well Explorer window appears, showing the seven wells within this database. For more on this window, see the GEOVIEW section of the Installation GEOVIEW and elog Guide. For now, click the X at the top right to close the window.

5 4 VIEW3D Starting View3D Now that the database has been opened in GEOVIEW, we are ready to start the View3D program. To do this, click the View3D button on the GEOVIEW window. The following window now appears:


6 VIEW3D 5 Note that you cannot start a new project in View3D. The program is intended as an add-on to other HRS programs, and not as a stand-alone program. Therefore, you would need to open a project first created in another HRS program. You can use View3D to view any project created through these and other HRS programs. Fortunately, we have provided a project for this tutorial. Check the Open Existing Project button and click OK to bring up the Directory Chooser. Click the View3DE_Guide folder in the View3D directory to show projects in the Available List. Click the View3D_sand.prj project in the Available List and click OK. If a message appears telling you that the pathway to the project has changed, select Switch.

7 6 VIEW3D The View3D Data and Display windows now appear: The Data window is used to select what data to load and unload data from the display. It will appear like this:

8 VIEW3D 7 Note that the wells may be automatically selected for loading, but that nothing else is. The Project Loaded column shows the available data in the selected project. If data were missing from this list, you need to return to the original HRS program that created the project and then load that data through that program. Then save that program. Then you would return to View3D to display the complete data set. The View3D Data tab shows what data has been selected and what has already been loaded. The wells are automatically assumed selected for loading but the other data is not yet selected. The History tab lists the operations to this time that had loaded or unloaded data. The Filter section lets you filter the list of wells. Click the X at the upper left of the Filter box to hide that section. The Plot button loads (or unloads) the selected items into View3D. What has been loaded can now be viewed using the Display window features. The Display Window shows the plotted data and controls its display. Because no data has been selected and plotted yet, the Display Window is black.
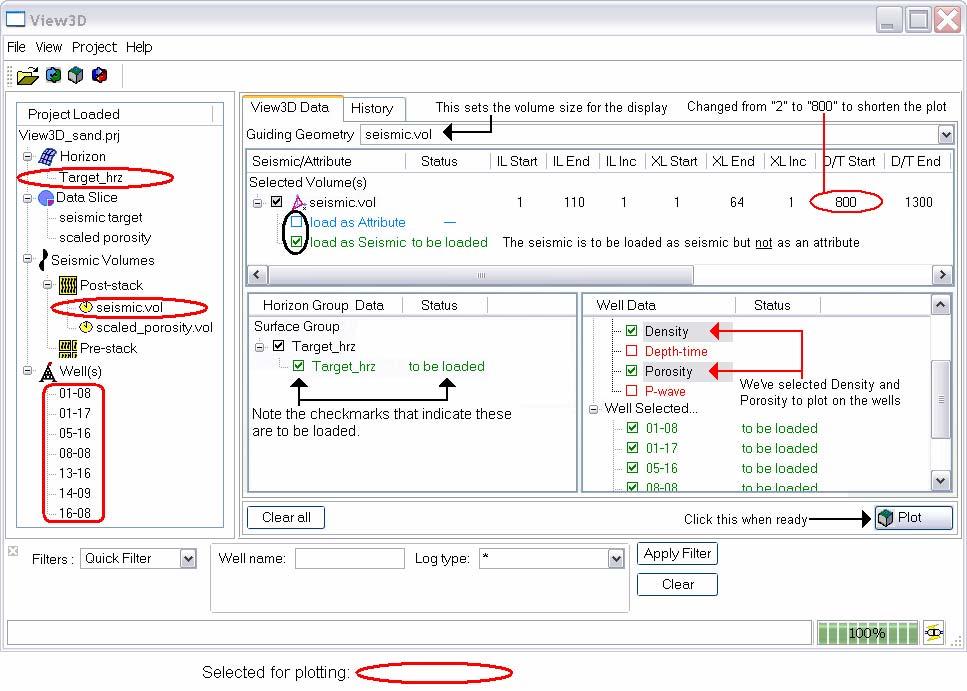
9 8 VIEW3D A Brief Summary of the View3D Process In the left side of the Data window, select the data to be plotted. In the right side of that window, set the details for loading. Start the Plot process, activating the Display window. Zoom the Display window to show the desired area. Select the Display mode for the Display window and select what planes to show. Set the horizon, well and seismic display parameters as needed. Adjust the view as needed, creating new slices as required. The geological play this tutorial handles is the same handled in the EMERGE tutorial and guide. It is a channel sand with porosity that can be predicted from seismic data. Loading the Seismic and Horizon Data On the Data window, double-click the horizon Target_hrz in the Horizon folder of the Project Loaded section and the volume seismic.vol in the Post-stack folder. They will now appear on the right side of the Data window, with the status "to be loaded" as shown below. Select the View3D Data tab in the top right of the window (it should be selected by default). In the Well Data section, scroll up if required and select the Density and Porosity checkboxes.

10 VIEW3D 9 Click once anywhere in the seismic.vol line. Move to the D/T Start column on that line (you may need to use the horizontal scroll bar to reach this column). Then click once in the D/T Start field for seismic.vol. When a cursor appears in that field, change the value from "2" to "800" and press <ENTER>. We do this so that the plot will not extend above 800 milliseconds TWT. Otherwise, the plot would have extended up to 2 milliseconds and be too tall and awkward to view. See below: Note: Whenever you edit something in this table, you must press <ENTER> before exiting that field to keep the edit. If the wells are not automatically selected for plotting, click each well in the Well folder of the Project Loaded section. Click Plot. The selected data now appears in the Display window, while "Loaded" appears in the Status columns of the Data window.
11 10 VIEW3D

12 VIEW3D 11 Viewing the Data In the following figure, note that the outline of the entire volume and wellbore lengths are shown: this is the default, or "Home" view for the data, and you can return to this view by pressing the Home key on the left vertical toolbar. If the window is too short to show the entire toolbar on the left, a scroll icon will let you display the rest of the toolbar. Note also that the zone of interest, the part with the horizon, is dwarfed by the spread of data. The actual color choices for the well data, Seismic and Horizon Color Keys will depend on what was last used in the program. We will show how to change them later.
 is too exaggerated, the horizon may look unreasonable. If your Z scaling is too small, the horizon may look featureless.")
13 12 VIEW3D Scaling the Plot Your horizon may not appear exactly as shown above, and this is because the scaling may be different. If the Time axis scale (Z) is too exaggerated, the horizon may look unreasonable. If your Z scaling is too small, the horizon may look featureless. From the Options menu, select Scaling to bring up the Scaling window. Ensure that these values are entered: X=1 Y=1 Z=0.5 If not, then correct the values and click OK. If your plot disappears, then click the Home button on the left toolbar. Your plot will reappear with the correct scale. You may need to click the double arrows at the bottom of the toolbar to expand it, as shown below. As a check, we will display a north arrow. From the Options menu, select Show North Arrow to see a yellow arrow at the top of the plot (see below).


14 VIEW3D 13 The entire volume is displayed with south facing upwards, contrary to what we would normally expect, and we should keep that in mind. Reselect Show North Arrow to hide that arrow. We will now zoom into the zone of interest, using the mouse, as shown below: From above the 1010 value on the left, press the middle mouse button down and drag it to about the 1125 value on the right (see below).


15 14 VIEW3D When you release the mouse button, the display will be zoomed in. Note the well bores, well tops and the horizon. You may need to resize the edges of the window to see the time scales at the left and right. You can use the middle mouse button to: Shift the display around the screen: Rotate the display around a point: Zoom and unzoom: SHIFT + Middle Mouse Button CTRL + Middle Mouse Button Middle Mouse Button, hold and drag as previously shown Notice that there is no seismic data displayed, even though the respective color key is shown. This is because we have not selected anything at the bottom of the window yet, as shown below. Saving the Viewing Parameters This will let you save your work and retrieve it again, which is very useful if you must interrupt this tutorial. From the Main menu, select File>Set Scene 1. Now, when you restart this tutorial, you will need to reselect everything on the Data Window and click Plot. When the Display window
. Both windows close and the Visual3D session ends when you close the Data window.")

16 VIEW3D 15 appears, all you need to do is select File>Load Scene 1, or click the Recall Scene 1 button from the left-hand toolbar. Stopping This Tutorial First, save your scene, as described above. Close the Data window (not the Display window). Both windows close and the Visual3D session ends when you close the Data window. Adding Slices Select Slice mode from the bottom left menu of the Display window, if it is not already selected. Click the X box to display the X-axis slice as shown below: This X slice above shows the porosity values that we have loaded as an attribute. It also partially obscures the horizon, the wells and well top information (hence the clipped well top labels, which are easier to see on the screen than on a gray-scale diagram). To move this slice, ensure that the Slide Slices Mode button of the Slice Creation Mode toolbar is selected. This toolbar is at the upper right of the Display window.


 until it is at the edge")
17 16 VIEW3D Then click the slice with the left mouse button to select it. The slice now has a red border with the edges of the volume and with any intersecting horizons or slices. We have also hidden the color keys, by selecting Seismic> Show Color Map and Horizon>Show Color Map to turn the Color Map toggles off. Now drag the X slice towards the rear (to the left) until it is at the edge of the volume, then release the left mouse button to place it as shown below:


18 VIEW3D 17 Repeat these steps for the Y slice, checking its box at the bottom left and then moving it to the right and back. Repeat these steps for the Z slice, checking its box at the bottom left and then moving it to about 1100 ms, to get the display below:


19 18 VIEW3D Displaying Attribute Values For View3D, attributes and seismic data are treated the same except that only seismic data can be represented by wiggle traces. View3D can only display one "attribute" volume and one "seismic" volume at the same time. However, you can select what you want as seismic and attribute. We recommend that "seismic" should be reserved for actual seismic data, while "attribute" should be reserved for values calculated from the seismic data, such as inversions generated through the STRATA program or petrophysical parameters generated through the EMERGE program. Double-click scaled_porosity.vol in the Post-stack folder of the Project Loaded section of the Data window to display that attribute volume in the View3D Data section to the right. Now check the load as Attribute box for the scaled_porosity.vol data, but uncheck the load as Seismic box. Note that this volume already has a D/T Start value of "800", but it does not matter for the display if this volume had a different value, since the display's dimensions are set by the first volume loaded (hence by the seismic.vol volume). One useful function is to place the mouse over volumes in the View3D Data table. Then a popup appears, giving the basic geometry for that data, as shown below (for the seismic.vol line): There are also right-click pop-up menus in the Data window that are useful. See the online help for more on these menus.
 as a color scale and the Attribute color key will be displayed (you can turn this off through the Attribute menu in the same way as done for")
20 VIEW3D 19 Click Plot. The Display window will now show the attribute (porosity) as a color scale and the Attribute color key will be displayed (you can turn this off through the Attribute menu in the same way as done for the other color keys). Changing Color Keys For Color Plots We will now change the attribute color key to emphasize the higher porosity values. The default Color Map is Rainbow, as used above. Select Color Map from the Attribute menu to bring up the ColorMap Settings window.


21 20 VIEW3D Scroll down to the Lightning Color Map and select it. Click OK to apply the change and close the Colormap Settings window.

. To further demonstrate the porosity value, while in Slide mode the horizon to see how the porosity value changes.")
22 VIEW3D 21 Now the high porosity values are red or yellow and are easier to notice (at least on the screen, which should not be monochromatic like this book) while the lower porosity values, in which we are not interested, are in similar shades of green and easily ignored. If the Upper and Lower values in the Color Mapping section do not approximately match the Minimum and Maximum values respectively in the Data Range section, then change them to be close (e.g., using "0" for the Lower and "0.16" for the Upper values). To further demonstrate the porosity value, while in Slide mode the horizon to see how the porosity value changes., slide the Z slice up through Then move the Z slice back to its original position at about 1100 ms.

23 22 VIEW3D Showing Traces and Color Plots Together We will now show the seismic data in a form that is not hidden by the scaled porosity colors, essentially co-rendering the two sets of data. Select Seismic>Wiggle from the Display menu. The seismic will now be displayed as wiggle traces on top of the attribute colors. To return the seismic to its color display, reselect this menu option to turn it off. Top, Side and Other Points of View In the Well menu, uncheck the options Annotation (well and top names) and Tops (disks showing where the tops are on the well bore) so only the well bores are shown. In the Attribute menu, uncheck the Show Color Map option to hide the color key. At the bottom of the window, uncheck the Y and Z checkboxes, so only the X plane is left. These steps will declutter the view.


24 VIEW3D 23 Now click the Front View button that below: on the left of the Display window to change the display to Use the Undo button or the BACKSPACE key on the keyboard to return to the previous view. Now click the Top View button.


25 24 VIEW3D Again, click the Undo button to return to the original view. Press PAGEUP or click the Zoom In button three times to get the following view. Again, click the Undo button three times to return to the original view. You can also move the view in the window by the arrow buttons or using SHIFT and the keyboard arrow keys. Note that the arrows act as if you are moving the display (as if it were a paper printout), and not as if you were moving your viewpoint (as in video games).
 on the keyboard to use this feature.")

26 VIEW3D 25 Special Zoom Views Birds' Eye View Press SHIFT-HOME on the keyboard to use this feature. A view of the entire volume will be displayed in the upper right corner. This view will match the orientation of the current view. Press SHIFT-HOME on the keyboard again to close the birds' eye view. Magnifying Glass Zoom Press M (or m) on the keyboard to use this feature. Note: The Display Window must be active for this to work. If you are doing this tutorial by using a pdf file on a screen, you may have that screen active when you click M and then nothing happens. In that case, click on the Display Window to activate it and reclick M. A square appears in the middle of the view, magnifying the zone behind it. This magnifying glass now moves with the mouse. You can still use the middle mouse button for zooming or the left button for moving slices while this feature is up. You can also make this square wider or smaller with CTRL-PAGEUP and CTRL-PAGEDOWN. Press M again to turn it off.
 and click Home once so the top of the volume is visible. Then click the Zoom In button twice.")
27 26 VIEW3D Oblique Slices, Fences and Probes Now we will show alternative ways to display parts of the volume. First, uncheck the X checkbox to remove that plane (clearing the display except for the horizon) and click Home once so the top of the volume is visible. Then click the Zoom In button twice. If the top of the volume is off the screen, use the Move Down button to move it into view. On the upper right side of the window, we have the Slice Mode buttons.
 slice and rotated it. Remember that you must be able to view the top of the volume to create these slices. Click the Create a Rotated Slice icon.")
28 VIEW3D 27 Oblique Slices (Rotated Slices) An oblique or rotated slice is a slice that does not parallel the X or Y axes, but is perpendicular to the Z plane. In other words, it is as if you took an X (or Y) slice and rotated it. Remember that you must be able to view the top of the volume to create these slices. Click the Create a Rotated Slice icon. Then click down on one upper edge of the volume (and do not release the button) and drag the mouse toward you and to the left. This is the direction perpendicular to the line you want. A line with an attached vector indicator now appears. The end of the vector is controlled by the mouse. With the left button still pressed, you can use the mouse to move the vector and therefore the slice.


29 28 VIEW3D Release the mouse button to create the slice. If you click on a rotated slice or an edge, another slice will be created at that point and you can position it as long as the mouse button is held down. To stop making such slices when you click on the Display window, click the Delete Slice icon (the box with the X, ) and select the new slice to remove it. Then select Slide Slice to leave the Delete mode.


30 VIEW3D 29 Making Fences A fence is a series of slices connected end-to-end, resembling a fence (of course). They can be very useful to follow channels, bars or reefs, or to outline a property of land. To create a fence, click the Fence icon. Then click the front left side to start the fence (you must click on the top plane, not on the side). Click the end of that fence panel on the front right side. Now click in a direction to the upper right. Click further right and then click to the lower right. See below. Then click the Slide icon to leave Fence mode and therefore finish that fence. In other words, you enter Fence mode, click the corners of each fence section and then exit Fence mode to create a fence. Once you have created a fence, you can move its segments around in Slide mode by dragging the edges or corners. In the following example, the fence created above was moved to match the target channel. Note how it also emphasizes the horizon structure.

31 30 VIEW3D Now click the Delete Slice icon (the box with the X, ) and select one part of the fence to remove the entire fence. Remember to then select Slide, so you do not stay in Delete mode. Probes A probe is an orthogonal shape that shows the attribute or seismic in a different way than slices. While slices must extend the entire height of the volume, probes can be limited just to an area of interest, making them ideal for screen captures. You can also create inside angles (which resembles "steps" in the probe). Since we do not need the entire volume for probes, click the Zoom In button twice. If necessary, click the Move Up button or Move Down button until the Target_hrz horizon is in the middle of the display. From the Probe menu, select Add. The initial orthogonal shape is added automatically. Now select Trim Volume from the Probe menu to bring up that window. Select the Xline tab. Type "20" (or slice the slider to that value) for the Start X value and press <ENTER>, and type "50" for the End X value and press <ENTER>. The Display window will show the change in the shape.


32 VIEW3D 31 Select the Inline tab and enter "40" for the Start, then press <ENTER> and "60" for the End, then press <ENTER>. Then select the Depth tab and, instead of typing values, we will use the slider. Slide the Start slider to "1000" for the Start Depth, and slide the End slider to "1100" for the End Depth. You will not need to press <ENTER>. Click Close.

33 32 VIEW3D The display will now show a block-like "probe". Now we will add a corner reentrant. Click precisely on the foremost upper corner. The probe now has a cut-in section.


34 VIEW3D 33 Click the rear right edge of this reentrant and slide it downwards towards the horizon. When you are finished, select Delete Current or Delete All from the Probe menu to remove the probe display.


35 34 VIEW3D Showing Well Log Data First zoom in three times with the Zoom In button and use the Move Down button as needed to move the horizon downward to get a display like that below. In the Well menu, turn the Annotation and Tops back on. Select Well>Symbol Size and ensure that the values are set as below: Top Disk = "3" Thickness = "0.5" Wellbore = "2"

36 VIEW3D 35 If they are not these values, then correct them and click OK. Otherwise, click OK or Close to close this window. The Top Disk is the marker that indicates a top on the wellbore. The Thickness value refers to the thickness of the top disks. The Well Bore refers to the thickness of the actual hole outline in the display. Select Curve Display from the Well menu to bring up the Well Log Curve Display Dialog. Note that the TWT curve is always included as a curve.


37 36 VIEW3D Select Porosity in the Curve Selection table and click >>Center. Now select the >>Center button in the Curve Style section. Enter the following parameters, so the center porosity plot is easier to see: Cylinder Radius = "0.5". Scale = "2". Variable Radius selected.


38 VIEW3D 37 Keep the other parameters the same. Click OK to close the Curve Display Dialog. Below is the result. Note how the radius changes to match the porosity values.


39 38 VIEW3D Selecting Which Wells to View From the Well menu, select Visual to bring up the Well Log Visual Dialog. In the Original column, uncheck all the Visible checkboxes except and click Apply. Now only the well is displayed. Click Close.
.")

40 VIEW3D 39 Emphasing Value Ranges and Setting Transparency: Visual Control Check the X and Y checkboxes at the bottom of the Display window to show those slices. Position them once again at the back of the volume (they should be there automatically if you have not moved them). Select Attribute>Visual to bring up the Visual Control window for the Scaled Porosity attribute. Uncheck the Freehand box and check the Linear box. Click on the middle red dot at the left side of the upper box. Then drag this toward the right, bringing a vertical line along, to about 3/4 over.


41 40 VIEW3D What this means is that all the values whose colors fit under the now dark section will not be displayed on the plot. Therefore, only the high porosity areas will be colored. The low porosity values will not appear. Also, the underlying seismic data will be easier to see. Click OK. In the Seismic menu, select Visual to bring up a similar window. This time, do not uncheck the Freehand checkbox. Now draw a curve from the lower left to the upper right, such as below. Click Apply.
. Click OK to remove the Color Map Settings window. Click Apply on the Visual Control window to get the view below.")
42 VIEW3D 41 To avoid confusing dark peaks with deleted values (where the black background shows through), click the Color button on the Visual Control window to bring up the Color Map Settings window. Select Rainbow (instead of Gray Scale). Click OK to remove the Color Map Settings window. Click Apply on the Visual Control window to get the view below. The Rainbow color map has no black in it, so black then means "no data shown". Close the Visual window. For the Display mode, now select Volume instead of Slice. The entire seismic and attribute volumes are now displayed.


43 42 VIEW3D Now, from the Seismic menu, select Hide to remove the seismic data from the display. Now only the attribute data (i.e., higher porosity) is shown.

44 VIEW3D 43 Removing Data From View3D At the bottom left of the Display window, reselect Slice instead of Volume for the Display mode. Hide the displayed well through the Well>Visual option by unchecking the Visible box in the Original column, as done before. Return to the Data window and uncheck the scaled_porosity.vol box in the Selected Volumes table and click Plot. This will unload the attribute plot, leaving only the seismic, well and horizon data. We could have instead hidden the attribute plot without removing it by selecting Attribute> Hide. Loading Data Slices as Horizons Now we will load a Data Slice based on the Target_hrz horizon. In the Data Slice section of the Project Loaded column in the Data window, there are two data slices. The slice seismic target is just a sparser-sampled version of the Target_hrz horizon, and we will not use it. It, however, was used in EMERGE to create another slice, the scaled_porosity slice. This slice will display porosity calculated by the EMERGE program. Double-click it to place it in the Horizon Group Data with the status "To Be Loaded". Then click Plot.


45 44 VIEW3D The Display window will show the same amplitude surface as Target_hrz, but as the sampling rate was lower, it is not as smoothed as the first horizon we used. The color plot will now represent scaled porosity, not two-way time. In this display, we have turned the Horizon Color Key display back on through Horizon>Show Color Map. Note that blue and violet represent moderate porosity and yellow and red represent insufficient porosity. Note also that you can select which horizon to show by using the Horizon Group dropdown menu at the top of the window. We will stay with scaled porosity.
.")
46 VIEW3D 45 Now select Horizon>Visual to open the Visual window for the scaled_porosity data slice. Click the Wire Frame check box in the Show section. Then click Apply. The wire frame matches the TWT data and shows the effect of the sampling rate. By the way, this is a good surface to try the Magnifying Glass view we talked about earlier (as brought up by the M key). Uncheck Wire Frame and check the Contour box.


47 46 VIEW3D Then click Apply. These contours reflect the TWT structure. When you have finished, close the window. Then close the Data window (not the Display window). Both windows close and the Visual3D session ends when you close the Data window. This concludes the Visual3D tutorial.
GUIDE TO VIEW3D. Introduction to View3D
 View3D Guide Introduction to View3D... 1 Starting Hampson-Russell Software... 2 Starting View3D... 4 A Brief Summary of the View3D Process... 8 Loading the Seismic and Horizon Data... 8 Selection Errors...
GUIDE TO EMERGE. Each example is independent and may be performed without doing the others.
 EMERGE Guide Introduction to EMERGE... 1 Part 1: Estimating P-wave Velocity from Seismic Attributes... 2 Starting EMERGE... 4 Performing Single-Attribute Analysis... 23 Performing Multi-Attribute Analysis...
Autodesk Inventor Design Exercise 2: F1 Team Challenge Car Developed by Tim Varner Synergis Technologies
 Autodesk Inventor Design Exercise 2: F1 Team Challenge Car Developed by Tim Varner Synergis Technologies Tim Varner - 2004 The Inventor User Interface Command Panel Lists the commands that are currently
SolidWorks Intro Part 1b
 SolidWorks Intro Part 1b Dave Touretzky and Susan Finger 1. Create a new part We ll create a CAD model of the 2 ½ D key fob below to make on the laser cutter. Select File New Templates IPSpart If the SolidWorks
SolidWorks 2½D Parts
 SolidWorks 2½D Parts IDeATe Laser Micro Part 1b Dave Touretzky and Susan Finger 1. Create a new part In this lab, you ll create a CAD model of the 2 ½ D key fob below to make on the laser cutter. Select
INTViewer Tutorial Cube Tutorial
 INTViewer Tutorial Cube Tutorial This tutorial shows how to use INTViewer to display a seismic cube stored in a Seismic file. Windows created will include INLINE, XLINE, Time Slice and an arbitrary traverse,
Module 4A: Creating the 3D Model of Right and Oblique Pyramids
 Inventor (5) Module 4A: 4A- 1 Module 4A: Creating the 3D Model of Right and Oblique Pyramids In Module 4A, we will learn how to create 3D solid models of right-axis and oblique-axis pyramid (regular or
Getting Started. What is SAS/SPECTRAVIEW Software? CHAPTER 1
 3 CHAPTER 1 Getting Started What is SAS/SPECTRAVIEW Software? 3 Using SAS/SPECTRAVIEW Software 5 Data Set Requirements 5 How the Software Displays Data 6 Spatial Data 6 Non-Spatial Data 7 Summary of Software
3D Design with 123D Design
 3D Design with 123D Design Introduction: 3D Design involves thinking and creating in 3 dimensions. x, y and z axis Working with 123D Design 123D Design is a 3D design software package from Autodesk. A
The Fundamentals. Document Basics
 3 The Fundamentals Opening a Program... 3 Similarities in All Programs... 3 It's On Now What?...4 Making things easier to see.. 4 Adjusting Text Size.....4 My Computer. 4 Control Panel... 5 Accessibility
Basic Modeling 1 Tekla Structures 12.0 Basic Training September 19, 2006
 Tekla Structures 12.0 Basic Training September 19, 2006 Copyright 2006 Tekla Corporation Contents Contents 3 1 5 1.1 Start Tekla Structures 6 1.2 Create a New Model BasicModel1 7 1.3 Create Grids 10 1.4
BoA Tools Page 1 / 31
 BoA Tools Page 1 / 31 Standard tools Overview 2 Work pane 3 3D-2D file Main palette 6 Layout Main Palette 9 Navigation tools 11 Workplane Palette 14 Cursor Palette 21 Numeric control 24 Selection by Criteria
On the Web sun.com/aboutsun/comm_invest STAROFFICE 8 DRAW
 STAROFFICE 8 DRAW Graphics They say a picture is worth a thousand words. Pictures are often used along with our words for good reason. They help communicate our thoughts. They give extra information that
How to...create a Video VBOX Gauge in Inkscape. So you want to create your own gauge? How about a transparent background for those text elements?
 BASIC GAUGE CREATION The Video VBox setup software is capable of using many different image formats for gauge backgrounds, static images, or logos, including Bitmaps, JPEGs, or PNG s. When the software
Learning to use the drawing tools
 Create a blank slide This module was developed for Office 2000 and 2001, but although there are cosmetic changes in the appearance of some of the tools, the basic functionality is the same in Powerpoint
Using Microsoft Word. Text Editing
 Using Microsoft Word A word processor is all about working with large amounts of text, so learning the basics of text editing is essential to being able to make the most of the program. The first thing
It is a good idea to practice View Control tools for 5 minutes at the start of every 3D session, before doing any other work.
 3D View Control Module Overview All the 2D view controls, such as Fit View, Zoom In and Out, Window Area, and Pan, can be used in 3D. As in 2D, elements to the left, right, above, or below can be excluded
Profile Modeler Profile Modeler ( A SuperControl Product )
") Profile Modeler ( A SuperControl Product ) - 1 - Index Overview... 3 Terminology... 3 Launching the Application... 4 File Menu... 4 Loading a File:... 4 To Load Multiple Files:... 4 Clearing Loaded Files:...
Profile Modeler ( A SuperControl Product ) - 1 - Index Overview... 3 Terminology... 3 Launching the Application... 4 File Menu... 4 Loading a File:... 4 To Load Multiple Files:... 4 Clearing Loaded Files:...
Rubis (NUM) Tutorial #1
 Tutorial #1") Rubis (NUM) Tutorial #1 1. Introduction This example is an introduction to the basic features of Rubis. The exercise is by no means intended to reproduce a realistic scenario. It is assumed that the user
Rubis (NUM) Tutorial #1 1. Introduction This example is an introduction to the basic features of Rubis. The exercise is by no means intended to reproduce a realistic scenario. It is assumed that the user
This is the opening view of blender.
 This is the opening view of blender. Note that interacting with Blender is a little different from other programs that you may be used to. For example, left clicking won t select objects on the scene,
2 SELECTING AND ALIGNING
 2 SELECTING AND ALIGNING Lesson overview In this lesson, you ll learn how to do the following: Differentiate between the various selection tools and employ different selection techniques. Recognize Smart
3ds Max Cottage Step 1. Always start out by setting up units: We re going with this setup as we will round everything off to one inch.
 3ds Max Cottage Step 1 Always start out by setting up units: We re going with this setup as we will round everything off to one inch. File/Import the CAD drawing Be sure Files of Type is set to all formats
DOING MORE WITH WORD: MICROSOFT OFFICE 2013
 DOING MORE WITH WORD: MICROSOFT OFFICE 2013 GETTING STARTED PAGE 02 Prerequisites What You Will Learn USING MICROSOFT WORD PAGE 03 Viewing Toolbars Adding and Removing Buttons MORE TASKS IN MICROSOFT WORD
v Overview SMS Tutorials Prerequisites Requirements Time Objectives
 v. 12.2 SMS 12.2 Tutorial Overview Objectives This tutorial describes the major components of the SMS interface and gives a brief introduction to the different SMS modules. Ideally, this tutorial should
DOING MORE WITH WORD: MICROSOFT OFFICE 2007
 DOING MORE WITH WORD: MICROSOFT OFFICE 2007 GETTING STARTED PAGE 02 Prerequisites What You Will Learn USING MICROSOFT WORD PAGE 03 Viewing Toolbars Adding and Removing Buttons MORE TASKS IN MICROSOFT WORD
Exercise Guide. Published: August MecSoft Corpotation
 VisualCAD Exercise Guide Published: August 2018 MecSoft Corpotation Copyright 1998-2018 VisualCAD 2018 Exercise Guide by Mecsoft Corporation User Notes: Contents 2 Table of Contents About this Guide 4
DOING MORE WITH WORD: MICROSOFT OFFICE 2010
 DOING MORE WITH WORD: MICROSOFT OFFICE 2010 GETTING STARTED PAGE 02 Prerequisites What You Will Learn USING MICROSOFT WORD PAGE 03 Viewing Toolbars Adding and Removing Buttons MORE TASKS IN MICROSOFT WORD
4) Finish the spline here. To complete the spline, double click the last point or select the spline tool again.
 Finish the spline here. To complete the spline, double click the last point or select the spline tool again.") 1) Select the line tool 3) Move the cursor along the X direction (be careful to stay on the X axis alignment so that the line is perpendicular) and click for the second point of the line. Type 0.5 for
1) Select the line tool 3) Move the cursor along the X direction (be careful to stay on the X axis alignment so that the line is perpendicular) and click for the second point of the line. Type 0.5 for
Introduction to SolidWorks Basics Materials Tech. Wood
 Introduction to SolidWorks Basics Materials Tech. Wood Table of Contents Table of Contents... 1 Book End... 2 Introduction... 2 Learning Intentions... 2 Modelling the Base... 3 Modelling the Front... 10
Mapping the Subsurface in 3-D Using Seisworks Part 1 - Structure Mapping
 Mapping the Subsurface in 3-D Using Seisworks Part 1 - Structure Mapping The purpose of this exercise is to introduce you to the art of mapping geologic surfaces from 3-D seismic data using Seisworks.
Guide to WB Annotations
 Guide to WB Annotations 04 May 2016 Annotations are a powerful new feature added to Workbench v1.2.0 (Released May 2016) for placing text and symbols within wb_view tabs and windows. They enable generation
GUIDE TO AVO. Introduction
 AVO Guide Introduction... 1 1.0 Using GEOVIEW... 2 Reading Well Logs into GEOVIEW... 3 2.0 AVO Modeling... 8 Performing Fluid Replacement Modeling... 14 Loading Seismic Data... 20 Creating a Synthetic
TRAINING SESSION Q2 2016
 There are 8 main topics in this training session which focus on the Sketch tools in IRONCAD. Content Sketch... 2 3D Scene Background Settings... 3 Creating a new empty Sketch... 4 Foam with cut out for
HYPERSTUDIO TOOLS. THE GRAPHIC TOOL Use this tool to select graphics to edit. SPRAY PAINT CAN Scatter lots of tiny dots with this tool.
 THE BROWSE TOOL Us it to go through the stack and click on buttons THE BUTTON TOOL Use this tool to select buttons to edit.. RECTANGLE TOOL This tool lets you capture a rectangular area to copy, cut, move,
Microsoft PowerPoint 2013 Beginning
 Microsoft PowerPoint 2013 Beginning PowerPoint Presentations on the Web... 2 Starting PowerPoint... 2 Opening a Presentation... 2 File Tab... 3 Quick Access Toolbar... 3 The Ribbon... 4 Keyboard Shortcuts...
ChemSense Studio Client Version 3.0.7
 Quick Start Guide: ChemSense Studio Client Version 3.0.7 January 5, 2005 Comments/Questions/Bug Report? E-mail: chemsense-contact@ctl.sri.com Background The ChemSense Studio Client software supports the
Advances in MicroStation 3D
 MW1HC515 Advances in MicroStation 3D Hands-on class sponsored by the Bentley Institute Presenter: Sam Hendrick, Senior MicroStation Product Consultant Bentley Systems, Incorporated 685 Stockton Drive Exton,
HAPPY HOLIDAYS PHOTO BORDER
 HAPPY HOLIDAYS PHOTO BORDER In this Photoshop tutorial, we ll learn how to create a simple and fun Happy Holidays winter photo border! Photoshop ships with some great snowflake shapes that we can use in
Tutorial 3: Using the Waveform Viewer Introduces the basics of using the waveform viewer. Read Tutorial SIMPLIS Tutorials SIMPLIS provide a range of t
 Tutorials Introductory Tutorials These tutorials are designed to give new users a basic understanding of how to use SIMetrix and SIMetrix/SIMPLIS. Tutorial 1: Getting Started Guides you through getting
SOLIDWORKS: Lesson 1 - Basics and Modeling. Introduction to Robotics
 SOLIDWORKS: Lesson 1 - Basics and Modeling Fundamentals Introduction to Robotics SolidWorks SolidWorks is a 3D solid modeling package which allows users to develop full solid models in a simulated environment
FACULTY AND STAFF COMPUTER FOOTHILL-DE ANZA. Office Graphics
 FACULTY AND STAFF COMPUTER TRAINING @ FOOTHILL-DE ANZA Office 2001 Graphics Microsoft Clip Art Introduction Office 2001 wants to be the application that does everything, including Windows! When it comes
Anatomy of a Window (Windows 7, Office 2010)
") Anatomy of a Window (Windows 7, Office 2010) Each window is made up of bars, ribbons, and buttons. They can be confusing because many of them are not marked clearly and rely only on a small symbol to indicate
Anatomy of a Window (Windows 7, Office 2010) Each window is made up of bars, ribbons, and buttons. They can be confusing because many of them are not marked clearly and rely only on a small symbol to indicate
Designer Reference 1
 Designer Reference 1 Table of Contents USE OF THE DESIGNER...4 KEYBOARD SHORTCUTS...5 Shortcuts...5 Keyboard Hints...5 MENUS...7 File Menu...7 Edit Menu...8 Favorites Menu...9 Document Menu...10 Item Menu...12
Microsoft PowerPoint 2007 Beginning
 Microsoft PowerPoint 2007 Beginning Educational Technology Center PowerPoint Presentations on the Web... 2 Starting PowerPoint... 2 Opening a Presentation... 2 Microsoft Office Button... 3 Quick Access
Microsoft PowerPoint 2010 Beginning
 Microsoft PowerPoint 2010 Beginning PowerPoint Presentations on the Web... 2 Starting PowerPoint... 2 Opening a Presentation... 2 File Tab... 3 Quick Access Toolbar... 3 The Ribbon... 4 Keyboard Shortcuts...
TUTORIAL 2. OBJECTIVE: Use SolidWorks/COSMOS to model and analyze a cattle gate bracket that is subjected to a force of 100,000 lbs.
 TUTORIAL 2 OBJECTIVE: Use SolidWorks/COSMOS to model and analyze a cattle gate bracket that is subjected to a force of 100,000 lbs. GETTING STARTED: 1. Open the SolidWorks program. 2. Open a new part file.
Digital City: Introduction to 3D modeling
 Digital City: Introduction to 3D modeling Weixuan Li, 2017 PART I: Install SketchUp and Introduction 1. Download SketchUp Download SketchUp from their official website: https://www.sketchup.com Go to the
Geology Interpretation Project Big Injun Sand & Trenton-Black River plays, Central Appalachian Basin, WV
 Geology 554 - Interpretation Project Big Injun Sand & Trenton-Black River plays, Central Appalachian Basin, WV Part 1 - Access and Basic Interpretation of the Seismic Data Using Kingdom T. H. Wilson (2005)
Spiky Sphere. Finding the Sphere tool. Your first sphere
 Spiky Sphere Finding the Sphere tool The Sphere tool is part of ShapeWizards suite called MagicBox (the other tools in the suite are Pursuit, Shell, Spiral). You can install all these tools at once by
CS Multimedia and Communications REMEMBER TO BRING YOUR MEMORY STICK TO EVERY LAB! Lab 02: Introduction to Photoshop Part 1
 CS 1033 Multimedia and Communications REMEMBER TO BRING YOUR MEMORY STICK TO EVERY LAB! Lab 02: Introduction to Photoshop Part 1 Upon completion of this lab, you should be able to: Open, create new, save
for ArcSketch Version 1.1 ArcSketch is a sample extension to ArcGIS. It works with ArcGIS 9.1
 ArcSketch User Guide for ArcSketch Version 1.1 ArcSketch is a sample extension to ArcGIS. It works with ArcGIS 9.1 ArcSketch allows the user to quickly create, or sketch, features in ArcMap using easy-to-use
Multiframe Windows Version 16. User Manual
 Multiframe Windows Version 16 User Manual Bentley Systems, Incorporated 2013 License & Copyright Multiframe Program & User Manual 2013 Bentley Systems, Incorporated iii Table of Contents License & Copyright...
Numbers Basics Website:
 Website: http://etc.usf.edu/te/ Numbers is Apple's new spreadsheet application. It is installed as part of the iwork suite, which also includes the word processing program Pages and the presentation program
L E S S O N 2 Background
 Flight, Naperville Central High School, Naperville, Ill. No hard hat needed in the InDesign work area Once you learn the concepts of good page design, and you learn how to use InDesign, you are limited
EMERGE Workflow CE8R2 SAMPLE IMAGE. Simon Voisey Hampson-Russell London Office
 EMERGE Workflow SAMPLE IMAGE CE8R2 Simon Voisey Hampson-Russell London Office August 2008 Introduction The document provides a step-by-step guide for producing Emerge-predicted petrophysical p volumes
In this lesson, you ll learn how to:
 LESSON 5: ADVANCED DRAWING TECHNIQUES OBJECTIVES In this lesson, you ll learn how to: apply gradient fills modify graphics by smoothing, straightening, and optimizing understand the difference between
3D Horizon/Fault Interpretation Exercise Using Seismic Micro-Technology s PC based 2d/3dPAK Seismic Interpretation Software
 3D Horizon/Fault Interpretation Exercise Using Seismic Micro-Technology s PC based 2d/3dPAK Seismic Interpretation Software Prepared by Tom Wilson, Appalachian Region Resource Center, Petroleum Technology
v Introduction to WMS WMS 11.0 Tutorial Become familiar with the WMS interface Prerequisite Tutorials None Required Components Data Map
 s v. 11.0 WMS 11.0 Tutorial Become familiar with the WMS interface Objectives Import files into WMS and change modules and display options to become familiar with the WMS interface. Prerequisite Tutorials
First Animated Model Yellow Submarine
 Course: 3D Design Title: First Animated Model Yellow Submarine Blender: Version 2.6X Level: Beginning Author; Neal Hirsig (May 2012) First Animated Model Yellow Submarine Most of you are perhaps too young
Add Photo Mounts To A Photo With Photoshop Part 1
 Add Photo Mounts To A Photo With Photoshop Part 1 Written by Steve Patterson. In this Photoshop Effects tutorial, we ll learn how to create and add simplephoto mounts to an image, a nice finishing touch
Beginning Paint 3D A Step by Step Tutorial. By Len Nasman
 A Step by Step Tutorial By Len Nasman Table of Contents Introduction... 3 The Paint 3D User Interface...4 Creating 2D Shapes...5 Drawing Lines with Paint 3D...6 Straight Lines...6 Multi-Point Curves...6
The Mathcad Workspace 7
 For information on system requirements and how to install Mathcad on your computer, refer to Chapter 1, Welcome to Mathcad. When you start Mathcad, you ll see a window like that shown in Figure 2-1. By
CHAPTER 1 COPYRIGHTED MATERIAL. Getting to Know AutoCAD. Opening a new drawing. Getting familiar with the AutoCAD and AutoCAD LT Graphics windows
 CHAPTER 1 Getting to Know AutoCAD Opening a new drawing Getting familiar with the AutoCAD and AutoCAD LT Graphics windows Modifying the display Displaying and arranging toolbars COPYRIGHTED MATERIAL 2
Press the Plus + key to zoom in. Press the Minus - key to zoom out. Scroll the mouse wheel away from you to zoom in; towards you to zoom out.
 Navigate Around the Map Interactive maps provide many choices for displaying information, searching for more details, and moving around the map. Most navigation uses the mouse, but at times you may also
Creating a Text Frame. Create a Table and Type Text. Pointer Tool Text Tool Table Tool Word Art Tool
 Pointer Tool Text Tool Table Tool Word Art Tool Picture Tool Clipart Tool Creating a Text Frame Select the Text Tool with the Pointer Tool. Position the mouse pointer where you want one corner of the text
SciGraphica. Tutorial Manual - Tutorials 1and 2 Version 0.8.0
 SciGraphica Tutorial Manual - Tutorials 1and 2 Version 0.8.0 Copyright (c) 2001 the SciGraphica documentation group Permission is granted to copy, distribute and/or modify this document under the terms
Tutorial 2: Particles convected with the flow along a curved pipe.
 Tutorial 2: Particles convected with the flow along a curved pipe. Part 1: Creating an elbow In part 1 of this tutorial, you will create a model of a 90 elbow featuring a long horizontal inlet and a short
Introduction to MS Word XP 2002: An Overview
 Introduction to MS Word XP 2002: An Overview Sources Used: http://www.fgcu.edu/support/office2000/word/files.html Florida Gulf Coast University Technology Skills Orientation Word 2000 Tutorial The Computer
Pagoda/Hypar 3. Manual
 Pagoda/Hypar 3 Manual Armstrong-White Automation (NZ) Ltd Armstrong-White Automation (NZ) Ltd 22 Kereru Grove, Greenhithe, North Shore City 0632 (Auckland), New Zealand. ph +64 9 413-7642 fax +64 9 413-7643
Anima-LP. Version 2.1alpha. User's Manual. August 10, 1992
 Anima-LP Version 2.1alpha User's Manual August 10, 1992 Christopher V. Jones Faculty of Business Administration Simon Fraser University Burnaby, BC V5A 1S6 CANADA chris_jones@sfu.ca 1992 Christopher V.
solidthinking Environment...1 Modeling Views...5 Console...13 Selecting Objects...15 Working Modes...19 World Browser...25 Construction Tree...
 Copyright 1993-2009 solidthinking, Inc. All rights reserved. solidthinking and renderthinking are trademarks of solidthinking, Inc. All other trademarks or service marks are the property of their respective
Excel 2003 Tutorial II
 This tutorial was adapted from a tutorial by see its complete version at http://www.fgcu.edu/support/office2000/excel/index.html Excel 2003 Tutorial II Charts Chart Wizard Chart toolbar Resizing a chart
Chapter 2 Surfer Tutorial
 Chapter 2 Surfer Tutorial Overview This tutorial introduces you to some of Surfer s features and shows you the steps to take to produce maps. In addition, the tutorial will help previous Surfer users learn
VIEWZ 1.3 USER MANUAL
 VIEWZ 1.3 USER MANUAL 2007-08 Zeus Numerix ViewZ 1.3.0 User Manual Revision: 200806061429 The latest copy of this PDF may be downloaded from the website. An online (HTML) version is also available. Zeus
Step 1: Create A New Photoshop Document
 Snowflakes Photo Border In this Photoshop tutorial, we ll learn how to create a simple snowflakes photo border, which can be a fun finishing touch for photos of family and friends during the holidays,
How To Capture Screen Shots
 What Is FastStone Capture? FastStone Capture is a program that can be used to capture screen images that you want to place in a document, a brochure, an e-mail message, a slide show and for lots of other
SketchUp Starting Up The first thing you must do is select a template.
 SketchUp Starting Up The first thing you must do is select a template. While there are many different ones to choose from the only real difference in them is that some have a coloured floor and a horizon
SNOWFLAKES PHOTO BORDER - PHOTOSHOP CS6 / CC
 Photo Effects: Snowflakes Photo Border (Photoshop CS6 / CC) SNOWFLAKES PHOTO BORDER - PHOTOSHOP CS6 / CC In this Photoshop tutorial, we ll learn how to create a simple and fun snowflakes photo border,
Inventor 201. Work Planes, Features & Constraints: Advanced part features and constraints
 Work Planes, Features & Constraints: 1. Select the Work Plane feature tool, move the cursor to the rim of the base so that inside and outside edges are highlighted and click once on the bottom rim of the
Feature-based CAM software for mills, multi-tasking lathes and wire EDM. Getting Started
 Feature-based CAM software for mills, multi-tasking lathes and wire EDM www.featurecam.com Getting Started FeatureCAM 2015 R3 Getting Started FeatureCAM Copyright 1995-2015 Delcam Ltd. All rights reserved.
Insight: Measurement Tool. User Guide
 OMERO Beta v2.2: Measurement Tool User Guide - 1 - October 2007 Insight: Measurement Tool User Guide Open Microscopy Environment: http://www.openmicroscopy.org OMERO Beta v2.2: Measurement Tool User Guide
GDL Toolbox 2 Reference Manual
 Reference Manual Archi-data Ltd. Copyright 2002. New Features Reference Manual New Save GDL command Selected GDL Toolbox elements can be exported into simple GDL scripts. During the export process, the
Contents. Launching Word
 Using Microsoft Office 2007 Introduction to Word Handout INFORMATION TECHNOLOGY SERVICES California State University, Los Angeles Version 1.0 Winter 2009 Contents Launching Word 2007... 3 Working with
User Interface Guide
 User Interface Guide 1 Contents Overview... 3 Tabmenu... 4 Design modes... 4 Tool groups... 5 Design function groups... 5 Main menu... 6 Toolbars... 7 Drawing area... 9 Status bar... 11 Coordinate box...
2 Solutions Chapter 3. Chapter 3: Practice Example 1
 1 Solutions This section includes the step by step solutions for the practice exercise for the following chapters and sections: Chapter 3 Chapter 4 Chapter 5 Chapter 11: Rainbow Springs sample test Final
Virtual MODELA USER'S MANUAL
 Virtual MODELA USER'S MANUAL Virtual MODELA is a program that simulates the movement of the tool on the screen. Contents Contents Part 1 Introduction 1-1 System Requirements... 4 1-2 Overview of Virtual
Optimizing ImmuNet. In this chapter: Optimizing Browser Performance Running Reports with Adobe Acrobat Reader Efficient Screen Navigation
 Optimizing ImmuNet In this chapter: Optimizing Browser Performance Running Reports with Adobe Acrobat Reader Efficient Screen Navigation Optimizing Browser Performance Unless instructed to do otherwise,
Logger Pro Resource Sheet
 Logger Pro Resource Sheet Entering and Editing Data Data Collection How to Begin How to Store Multiple Runs Data Analysis How to Scale a Graph How to Determine the X- and Y- Data Points on a Graph How
EE261 Computer Project 1: Using Mentor Graphics for Digital Simulation
 EE261 Computer Project 1: Using Mentor Graphics for Digital Simulation Introduction In this project, you will begin to explore the digital simulation tools of the Mentor Graphics package available on the
Getting Started with DADiSP
 Section 1: Welcome to DADiSP Getting Started with DADiSP This guide is designed to introduce you to the DADiSP environment. It gives you the opportunity to build and manipulate your own sample Worksheets
Autodesk Fusion 360 Training: The Future of Making Things Attendee Guide
 Autodesk Fusion 360 Training: The Future of Making Things Attendee Guide Abstract After completing this workshop, you will have a basic understanding of editing 3D models using Autodesk Fusion 360 TM to
Texas School for the Blind and Visually Impaired. Using The Drawing Tools in Microsoft Word 2007 for Tactile Graphic Production
 Texas School for the Blind and Visually Impaired Outreach Programs 1100 West 45 th Street Austin, Texas, 78756 Using The Drawing Tools in Microsoft Word 2007 for Tactile Graphic Production Developed by:
Quick Start. Getting Started
 CHAPTER 1 Quick Start This chapter gives the steps for reconstructing serial sections. You will learn the basics of using Reconstruct to import a series of images, view and align the sections, trace profiles,
Learning Microsoft Word By Greg Bowden. Chapter 10. Drawing Tools. Guided Computer Tutorials
 Learning Microsoft Word 2007 By Greg Bowden Chapter 10 Drawing Tools Guided Computer Tutorials www.gct.com.au PUBLISHED BY GUIDED COMPUTER TUTORIALS PO Box 311 Belmont, Victoria, 3216, Australia www.gct.com.au
CO2 Rail Car. Wheel Rear Px. on the Command Manager toolbar.
 Chapter 6 CO2 Rail Car Wheel Rear Px A. Sketch Construction Lines. Step 1. Click File Menu > New, click Part Metric and OK. Step 2. Click Front (plane) in the Feature Manager (left panel), Fig. 1. Step
Quick Crash Scene Tutorial
 Quick Crash Scene Tutorial With Crash Zone or Crime Zone, even new users can create a quick crash scene diagram in less than 10 minutes! In this tutorial we ll show how to use Crash Zone s unique features
OnCOR Silverlight Viewer Guide
 Getting Around There are many ways to move around the map! The simplest option is to use your mouse in the map area. If you hold the left button down, then click and drag, you can pan the map to a new
Emerge Workflow CE8 SAMPLE IMAGE. Simon Voisey July 2008
 Emerge Workflow SAMPLE IMAGE CE8 Simon Voisey July 2008 Introduction The document provides a step-by-step guide for producing Emerge predicted petrophysical volumes based on log data of the same type.
Blender Lesson Ceramic Bowl
 Blender Lesson Ceramic Bowl This lesson is going to show you how to create a ceramic looking bowl using the free program Blender. You will learn how to change the view, add, delete, scale and edit objects
Fig. A. Fig. B. Fig. 1. Fig. 2. Fig. 3 Fig. 4
 Create A Spinning Logo Tutorial. Bob Taylor 2009 To do this you will need two programs from Xara: Xara Xtreme (or Xtreme Pro) and Xara 3D They are available from: http://www.xara.com. Xtreme is available