BOSS. Quick Start Guide For research use only. Blackrock Microsystems, LLC. Blackrock Offline Spike Sorter. User s Manual. 630 Komas Drive Suite 200
|
|
|
- Liliana Lee
- 6 years ago
- Views:
Transcription
1 BOSS Quick Start Guide For research use only Blackrock Microsystems, LLC 630 Komas Drive Suite 200 Salt Lake City UT T:
2 2
3 1.0 Table of Contents 1.0 Table of Contents... 3 Welcome!... 4 Installation... 4 System Requirements... 4 Installing the Software... 4 Software Scope... 5 Use Cases... 5 Supported Data Formats... 5 Available Sorting Methods... 5 How-To... 6 Navigate the User Interface... 6 Detect Spikes Analyze Feature Spaces Cluster Spikes into Units Save Results
4 Welcome! Thank you for choosing Blackrock Microsystems! Inside this manual, you will find information on our Offline Spike Sorting software (BOSS), a tool that enables the sorting and editing of previously recorded data before complete data analysis. This manual will cover the system requirements, associated hardware, and instructions for use from basic loading of data to publishing the results to file. For questions on this product or any other Blackrock products, contact our 24/7 support service: support@blackrockmicro.com Installation SYSTEM REQUIREMENTS The specifications listed below are the minimum required by the software to run as intended. Microsoft Windows 7 Professional (64-bit) or higher A processor with 4 physical cores at 2.0 GHz 4 GB of RAM Video Card with full OpenGL compatibility INSTALLING THE SOFTWARE BOSS is either delivered electronically or through a USB Drive that contains the installer. In order to install the software, simply execute the installer and follow the on-screen prompts. 4
5 Software Scope USE CASES Blackrock s Offline Sorting Software has the following typical use cases: Detect action potential waveforms from recorded continuous data files. Sort or re-sort spikes from previously recorded neural event files or from those detected from a continuous sample into units. Edit the data by removing or sorting waveforms through manual or automated methods. Save processed data back into its original data type or export to a variety of common data formats. Publish summary of data by allowing the creation of a customizable PDF post-processing. SUPPORTED DATA FORMATS BOSS can accept a number of data formats as inputs for detecting or sorting data. These allowable inputs are shown below:.nsx (Blackrock Continuous Data Files).NEV (Blackrock Neural Event Files) In addition to file inputs, BOSS can also export to multiple data formats for expediting the analysis process. All export options are shown below:.nev (Blackrock Neural Event Files) AVAILABLE SORTING METHODS After either detecting waveforms from a continuous data file or loading them from a file type that contains already extracted waveforms, BOSS offers tools to classify waveforms into clusters that correspond to different neurons. BOSS offers following methods for classification: T-Distribution EM K-Means Manual assignment (selection-based) Lines 5
6 How-To NAVIGATE THE USER INTERFACE The UI has been designed to guide the user through the spike-sorting process and depends on the type of file opened for analysis. The displayed widgets will depend on the step for the currently selected channel whether it is Preprocessing and Detection, Feature Extraction and Sorting or Publishing - and so will the available options in the Options widget. In order to advance steps, the previous steps need to be completed. For that reason if spikes have not been detected, the Feature Extraction and Sorting steps will be unavailable. The UI is composed of the following widgets, which can all be undocked and arranged in any custom layout: Options The Options widget presents all available options for the current step within the sorting process. The push button on the left toolbar allows hiding and showing the widget. 6
7 7

8 Channel Table Use the Channel Table to peek onto channel settings and a summary of the analysis results. Timeline The Timeline displays a segment of the channel data. The zoom setting for the horizontal axis can be controlled using the mouse wheel; holding down the SHIFT key and using the mouse wheel will control the vertical scale. The Zoom Toolbar on the right side of the Timeline is also available for zoom control. When opening a large file that cannot be displayed all at once, a scroll bar on top of the Timeline will appear indicating the portion of the file that is currently available in the viewport. The scroll bar on the bottom of the Timeline relates to the zoom controls. Continuous Power Spectrum The Continuous Power Spectrum view displays the power spectrum between 0Hz and one half the sampling frequency. The vertical slider can be used to change the cut-off frequency of the HPF applied to the data. 8


9 This view is only available when a continuous data file is loaded. Peak Heights and Energy Histograms These two widgets display histograms of continuous data. The Peak Heights Histogram is displayed using a linear scale while the Energy Histogram uses a logarithmic scale. These views are only available when a continuous data file is loaded. 9

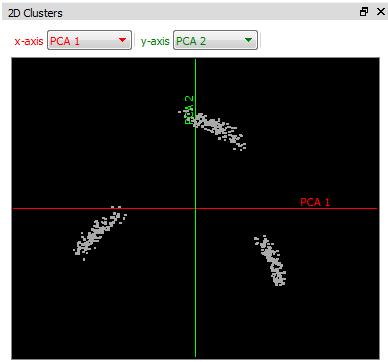
10 Feature vs. Feature Blackrock Offline Spike Sorter The Feature vs. Feature widget is a combination of individual Feature vs. Feature plots. The displayed plots correspond to the selected boxes in the Clustering Tendency half matrix, available in the Feature Options. You can select and unselect boxes in the matrix to display and hide those plots, respectively. 2D and 3D Features These two widgets display the feature space defined by the combo boxes in their top toolbars. 10
11 11
12 Depending on the mode of the 3D feature view (Rotate, Edit, Edit Once or Centroids), mouse movements and clicks have different effects: Rotate: Click and hold the mouse button and any movement of the mouse will cause a rotation of the display. Edit: Click the display and hold the mouse down to draw a free-hand enclosure to select waveforms. Right click to open the edit menu and chose an action to apply to the selection. Edit Once: After one editing action, the mode immediately turns back to Rotate. Clusters: Click the mouse near a cluster centroid and while pressing the CTRL key, keep defining cluster centroids in the data. These centroids can be used to initialize K-Means algorithm. Waveforms All waveforms corresponding to the displayed portion of the file (the data portion in the Timeline viewport) are superimposed. If units have been defined in the data, the average units are displayed with dash lines. 12

13 Blackrock Offline Spike Sorter After detection with threshold-based methods, the waveforms are aligned to their threshold crossings. However, you can re-align the waveforms using the top toolbar within this display. The alignment controls are as follows: Align To: Select whether you want to align to the First Local Min, First Local Max, First Local Extremum, First Local Extremum After Threshold, Global Min or Global Max. Max Shift: The maximum shift for any waveform in samples. If a waveform needs to be shifted by more than this value, it will not be aligned. Unit Selection Bar: When a unit checkbox is selected (filled with color) the alignment options will apply to that unit. You can select several units for alignment and the waveforms of that unit will be aligned independently of other units. If no unit is selected, all waveforms will be aligned regardless of the unit assignments. Align Button: Click this button to apply your alignment options to the data. Modes of Operation for Manual Editing: The Waveforms view has two modes of operation: Selection and Lines. When in Selection mode, right clicking on the view and selecting an action from the Edit Menu will only affect the selected waveforms. In Lines mode, you can define several segments in order to select waveforms that go through them. When an action is selected in the Edit Menu, this action will apply to all the waveforms in the file that fall within the defined segments, not only to those visible in the view. Units The Unit view allows examining the average waveform for each unit and its standard deviation. By right-clicking on a unit, you can get a context menu with editing options for it. 13
 or delete a whole unit.")
14 Edit Menu Blackrock Offline Spike Sorter The Edit Menu can be accessed from any view with waveforms by right-clicking on the background. When there is an active selection, you will have the option of re-labeling the waveforms, add a new unit, invalidate the selection (mark it as noise) or delete a whole unit. When there are no waveforms selected, the only option available will be to delete a unit. In the Unit view and the Visible Units buttons, the edit menu offers other unit-based options: invalidate, delete or combine with another unit. 14

15 DETECT SPIKES After loading your continuous data file, select the channel that you want to analyze in the Channel Table. In the Filters section of the Options widget, apply the HPF of your choice by enabling the filter and selecting Chebyshev I, Butterworth or Bessel. Select a cut-off frequency and order for the filter and the data will be updated to reflect your selection. You can choose to use the energy of the signal for the detection. If that is the case, the Timeline will split to show the signal energy on top of the regular timeseries. 15
16 Blackrock Offline Spike Sorter In the Threshold section, select the threshold that you want to use. Single or Dual thresholds are supported. You can change the threshold by typing the value on the Options widget or moving the threshold line in the Timeline or Histogram. Also, you can let BOSS select the appropriate threshold by setting it proportionally to noise RMS. Select the length of the snippets of data that will define a waveform in the Waveforms section and click the Detect button to detect waveforms. While BOSS processes the channel data, the Detect button and the channel name in the Channel Table will blink to indicate that the channel is being processed. Once finished, the blinking will stop. In the meantime, you can proceed to another channel and start processing it while the previous channel executes. BOSS will handle the processing of all channels in parallel. ANALYZE FEATURE SPACES Once the spikes have been detected in the continuous data or a neural event file has been loaded it is time to look at the different feature spaces and select the one that offers the best separation of clusters, eliminating all the dimensions dominated by noise. This step saves computational time as it reduces the dimensionality of the data fed to automatic clustering algorithms. Furthermore, eliminating inputs dominated by noise can certainly improve clustering outcomes. The major challenge is how to select which are the best features. The Options widget corresponding to the Feature Extraction and Sorting steps displays a half-matrix for the different feature pairs. Each box of the matrix is colored according to its Clustering Tendency value. 16

17 Blackrock Offline Spike Sorter This is an estimation of the pattern of the data in this feature space, representative of the quality of the separation of the clusters. You can click on these boxes to show and hide a specific feature space in the Feature vs. Feature view. Once a good subset of features have been identified for sorting, check the appropriate checkboxes to the left of the half matrix to indicate which features are going to be used for sorting. CLUSTER SPIKES INTO UNITS BOSS allows using manual methods as well as automatic algorithms for clustering the data. Manual methods include the definition of Lines and Manual selection of data points. Semi-automatic methods include T-Distribution EM and K-Means (with and without centroid initialization). T-Distribution EM This algorithm automatically determines the number of units, and identifies the neural responses from each source out of the composite signal. It implements an agglomerative mixture decompositions algorithm based on the Expectation-Maximization (EM) algorithm, where the distribution of waveforms from each unit is modeled as a multivariate t-distribution. In order to tune this algorithm, the user can select different Penalty Factor values. The higher the Penalty Factor value, the greater the number of clusters being discovered. The default setting is
18 For more details on the algorithm, please refer to: Shoham S. et. al. Robust, automatic spike sorting using mixtures of multivariate t-distributions, Journal of Neuroscience Methods, 127(2), K-Means The standard K-Means algorithm is implemented in BOSS to allow for (semi-) automatic clustering of the data. In order to run it, an initial number of clusters can be defined. If no initialization of centroids is provided, the algorithm will be initialized with a random partition of the data. Providing initial centroids will ensure a faster convergence and more accurate results. This implementation of K-Means allows empty clusters, which means that if the user requests three clusters but only two are discovered when the algorithm converges, only those two will be presented in the results. In this case, the algorithm will not try to force data points into a third cluster to meet the user request. Lines This algorithm uses a list of lines defined by the user in the Waveform view (i.e. time-voltage space) to classify individual waveforms into different units. A waveform will be classified into a unit when its voltage trace intersects with all the lines defined for that unit. By this criterion, if a waveform could be classified as two units, the resulting label will be the one of the first unit for which its lines intersect with it. New lines can be defined by switching to Lines mode in the Waveform view and hand selecting the lines ends by clicking on the view. Once defined, they can be adjusted by clicking on the ends and moving them to the desired position. To delete lines, click on a line and press Delete on the keyboard. After all lines are defined for a unit, right-click on the view and select the unit for them. Manual Selection BOSS allows using manual methods for cluster assignment. All views containing waveforms (Timeline, Waveforms, Feature vs. Feature, 2D Features and 3D Features) allow selecting data points or waveforms by left clicking on them. You can either click to select single waveforms or click and hold the mouse button down for free-hand drawing a line and select a subset. Also, the CTRL key can be used to add more data points to an existing selection. Once a selection is in place, you can right-click on any view to access the Edit Menu. SAVE RESULTS When a file is opened in BOSS, partially processed and then closed, BOSS will automatically save the editing session so the user can later resume his analysis where it was left off. The next time the same file is opened, BOSS will offer to continue the same editing session or start a new one. In addition, results can be saved into a.nev file for further processing in other software packages. To do so, simply select File Menu Save As and save your file. 18
OpenSorter User s Guide
 OpenSorter User s Guide OpenSorter User's Guide Copyright 2006-2012 Tucker-Davis Technologies, Inc. (TDT). All rights reserved. No part of this manual may be reproduced or transmitted in any form or by
MagicInfo VideoWall Author
 MagicInfo VideoWall Author MagicInfo VideoWall Author User Guide MagicInfo VideoWall Author is a program designed to construct a VideoWall layout and create VideoWall content by adding various elements
Using SymPrint to Make Overlays, Templates & More...
 Welcome to SymPrint SymPrint is an easy-to-use tool for creating communication overlays, worksheets, classroom activities and more using a modern toolbar and common-sense interface modeled after the programs
XPEL DAP SUPPORT. DAP Tool List & Overview DESCRIPTION ICON/TOOL (SHORTCUT)
") Pointer (S) Left-click on individual entities to add them to the current selection (selected entities will turn red). If the entity selected is a member of a group, the entire group will be added to the
Pointer (S) Left-click on individual entities to add them to the current selection (selected entities will turn red). If the entity selected is a member of a group, the entire group will be added to the
User Guide. Offline Sorter. Plexon Inc 6500 Greenville Avenue, Suite 700 Dallas, Texas USA. Offline Neural Spike Sorting Software
 User Guide Version 4.4, February 2018 Offline Sorter Offline Neural Spike Sorting Software Plexon Inc 6500 Greenville Avenue, Suite 700 Dallas, Texas 75206 USA Caution Electrostatic Discharge Some devices
SystemVue 2011 Fundamentals (version ) LAB EXERCISE 1. SystemVue Basics
 LAB EXERCISE 1. SystemVue Basics") SystemVue 2011 Fundamentals (version 1-2012) LAB EXERCISE 1 SystemVue Basics This lab exercise introduces the basic use model of SystemVue, including using the built-in templates, running analyses and
SystemVue 2011 Fundamentals (version 1-2012) LAB EXERCISE 1 SystemVue Basics This lab exercise introduces the basic use model of SystemVue, including using the built-in templates, running analyses and
StickFont Editor v1.01 User Manual. Copyright 2012 NCPlot Software LLC
 StickFont Editor v1.01 User Manual Copyright 2012 NCPlot Software LLC StickFont Editor Manual Table of Contents Welcome... 1 Registering StickFont Editor... 3 Getting Started... 5 Getting Started...
With ClaroIdeas you can quickly and easily create idea maps using a combination of words, symbols and pictures.
 Welcome to ClaroIdeas ClaroIdeas is a fresh tool to support the creation and editing of concept maps or idea maps using visual and audio components. It has been specifically developed to support people
User s Manual. CW500Viewer IM CW500-61EN. 2nd Edition
 User s Manual CW500Viewer 2nd Edition Thank you for purchasing the CW500 Power Quality Analyzer. This manual explains the operating procedures of CW500Viewer, a software application included with the CW500.
Tobii Pro Lab Release Notes
 Tobii Pro Lab Release Notes Release notes 1.89 2018-05-23 IMPORTANT NOTICE! Projects created or opened in this version will not be possible to open in older versions than 1.89 of Tobii Pro Lab Panels for
Quick Start Guide. January EAZ0081L02A Rev. A
 Quick Start Guide January 2014 EAZ0081L02A Rev. A Trademarks Snap-on and Vantage Ultra are trademarks of Snap-on Incorporated. All other marks are trademarks or registered trademarks of their respective
Word 2013 Quick Start Guide
 Getting Started File Tab: Click to access actions like Print, Save As, and Word Options. Ribbon: Logically organize actions onto Tabs, Groups, and Buttons to facilitate finding commands. Active Document
Creating Fill-able Forms using Acrobat 7.0: Part 1
 Creating Fill-able Forms using Acrobat 7.0: Part 1 The first step in creating a fill-able form in Adobe Acrobat is to generate the form with all its formatting in a program such as Microsoft Word. Then
SAS Visual Analytics 8.2: Working with Report Content
 SAS Visual Analytics 8.2: Working with Report Content About Objects After selecting your data source and data items, add one or more objects to display the results. SAS Visual Analytics provides objects
Mn/DOT MnCMAT Crash Analysis Application Help
 Mn/DOT MnCMAT Crash Analysis Application Contents Login... 5 User Login Dialog... 5 Login... 5 Request Access Dialog... 5 Forgotten Password Dialog... 6 Create/Open Project... 7 Create/Open Project Dialog...
GraphWorX64 Productivity Tips
 Description: Overview of the most important productivity tools in GraphWorX64 General Requirement: Basic knowledge of GraphWorX64. Introduction GraphWorX64 has a very powerful development environment in
Quick Reference Guide
 PREMIUM THE HQ PRO-STITCHER WORKSPACE Quick Reference Guide This guide will help you through the learning curve of the user interface, finding commonly used features, and becoming familiar with new features
USER MANUAL. User Manual-3.0
 USER MANUAL User Manual-3.0 Greeting Card Xpress User Manual CONTENTS 1. Hello 1.1 Introduction 1.2 System Requirements MAC System Windows System 2. Opening the Tool Box Getting Started 2.1 Registration
motcom loganalyser User Manual
 User Manual Part No. 2 900 04 10000 Release 07.03.2016 English revision 160825 Kurt-Schumacher-Str. 28-30 66130 Saarbrücken, Germany e-mail: info@motcomgmbh.com web: www.motcomgmbh.com Contents Introduction...
Overview of Adobe Fireworks
 Adobe Fireworks Overview of Adobe Fireworks In this guide, you ll learn how to do the following: Work with the Adobe Fireworks workspace: tools, Document windows, menus, and panels. Customize the workspace.
OpenForms360 Validation User Guide Notable Solutions Inc.
 OpenForms360 Validation User Guide 2011 Notable Solutions Inc. 1 T A B L E O F C O N T EN T S Introduction...5 What is OpenForms360 Validation?... 5 Using OpenForms360 Validation... 5 Features at a glance...
AxIS Data in NeuroExplorer
 AxIS Data in NeuroExplorer 1. Objective NeuroExplorer is a data analysis program for neurophysiology that can be used to analyze neural data collected with AxIS. This document describes the steps necessary
Microsoft Excel 2010 Part 2: Intermediate Excel
 CALIFORNIA STATE UNIVERSITY, LOS ANGELES INFORMATION TECHNOLOGY SERVICES Microsoft Excel 2010 Part 2: Intermediate Excel Spring 2014, Version 1.0 Table of Contents Introduction...3 Working with Rows and
Seminar Series. Bringing Data Support and Training to You. Race Studio Menu Items for Automotive Racers & Enthusiasts
 Seminar Series Bringing Data Support and Training to You Race Studio Menu Items for Automotive Racers & Enthusiasts February 2016 1.800.718.9090 The Race Studio 2 software is designed and developed to
The Metro Map Maker TM0 Software Requirements Specification
 The Metro Map Maker TM0 Software Requirements Specification Author: Richard McKenna Debugging Enterprises TM Based on IEEE Std 830 TM -1998 (R2009) document format Copyright 2017 Debugging Enterprises
Layout and display. STILOG IST, all rights reserved
 2 Table of Contents I. Main Window... 1 1. DEFINITION... 1 2. LIST OF WINDOW ELEMENTS... 1 Quick Access Bar... 1 Menu Bar... 1 Windows... 2 Status bar... 2 Pop-up menu... 4 II. Menu Bar... 5 1. DEFINITION...
Microsoft How to Series
 Microsoft How to Series Getting Started with EXCEL 2007 A B C D E F Tabs Introduction to the Excel 2007 Interface The Excel 2007 Interface is comprised of several elements, with four main parts: Office
Eurostat Regions and Cities Illustrated: Usage guide
 Eurostat Regions and Cities Illustrated: Usage guide With Regions and Cities Illustrated, you can easily visualise regional indicators and view data for regions you are most interested in. This interactive
DataStudio Starter Manual
 Instruction Manual Manual No. 012-08107 DataStudio Starter Manual Manual No. 012-08107 Manual No. 012-08107 DataStudio Starter Manual Introduction What is DataStudio? DataStudio is a data acquisition,
ME scope Application Note 19
 ME scope Application Note 19 Using the Stability Diagram to Estimate Modal Frequency & Damping The steps in this Application Note can be duplicated using any Package that includes the VES-4500 Advanced
Student Quick Reference Guide
 Student Quick Reference Guide How to use this guide The Chart Student Quick Reference Guide is a resource for PowerLab systems in the classroom laboratory. The topics in this guide are arranged to help
Geneious Microsatellite Plugin. Biomatters Ltd
 Geneious Microsatellite Plugin Biomatters Ltd November 24, 2018 2 Introduction This plugin imports ABI fragment analysis files and allows you to visualize traces, fit ladders, call peaks, predict bins,
Numbers Basics Website:
 Website: http://etc.usf.edu/te/ Numbers is Apple's new spreadsheet application. It is installed as part of the iwork suite, which also includes the word processing program Pages and the presentation program
Google LayOut 2 Help. Contents
 Contents Contents... 1 Welcome to LayOut... 9 What's New in this Release?... 10 Learning LayOut... 12 Technical Support... 14 Welcome to the LayOut Getting Started Guide... 15 Introduction to the LayOut
The 3D environment: Getting started To open the 3D window, click the button in the Trace or the Workspace ribbon.
 Getting started To open the 3D window, click the button in the Trace or the Workspace ribbon. Neurolucida 360 1 Navigation Define a new pivot point to rotate around the point of your choice. Drag to rotate.
Modify Panel. Flatten Tab
 AFM Image Processing Most images will need some post acquisition processing. A typical procedure is to: i) modify the image by flattening, using a planefit, and possibly also a mask, ii) analyzing the
AutoCAD 2009 User InterfaceChapter1:
 AutoCAD 2009 User InterfaceChapter1: Chapter 1 The AutoCAD 2009 interface has been enhanced to make AutoCAD even easier to use, while making as much screen space available as possible. In this chapter,
FRYE ELECTRONICS, INC.
 TEMPUS-3D The Time-Frequency-Amplitude Microscope Version 1.01 FRYE FRYE ELECTRONICS, INC. P.O. Box 23391 Tigard, OR 97281-3391 USA (503) 620-2722 (800) 547-8209 Fax: (503) 639-0128 http://www.frye.com
BEAWebLogic Server. Using the WebLogic Diagnostic Framework Console Extension
 BEAWebLogic Server Using the WebLogic Diagnostic Framework Console Extension Version 10.0 Revised: March 30, 2007 Contents 1. Introduction and Roadmap What Is the WebLogic Diagnostic Framework Console
GCC vinyl cutter, cutting plotter for sign making
 Plotter Setup In "Plotter Setup," you can choose "Plotter List," "Environment," "Pen," and so on. [Plotter list] In this area, you can choose the machine type and set some basic information for your plotter
Spreadsheet View and Basic Statistics Concepts
 Spreadsheet View and Basic Statistics Concepts GeoGebra 3.2 Workshop Handout 9 Judith and Markus Hohenwarter www.geogebra.org Table of Contents 1. Introduction to GeoGebra s Spreadsheet View 2 2. Record
Jabber Messenger Online Help
 Jabber Messenger 3.2.1 Online Help Table Of Contents Welcome... 1 Welcome... 1 What's New in this Release?... 2 Getting Started... 3 Logging In... 3 Creating a New Account... 6 Using Jabber Messenger...
EtatRequete.book Page 1 Mardi, 6. avril :01 15 Reports and Queries
 Reports and Queries WinDev 15 - WebDev 15 - WinDev Mobile 15 Documentation version 15(1) - 0410 Remember to visit our Web site (www.windev.com) on a regular basis to find out whether upgraded versions
SensorConnect Changelog. Updated:
 SensorConnect Changelog Updated: 2018-09-24 v9.12.11 (2018-09-24) Sensor Output Mode: The latest firmware for the G-Link-200 allows configuring the device to output Tilt channels. Last Known State: The
13. Albums & Multi-Image Printing
 13. Albums & Multi-Image Printing The Album function is a flexible layout and printing tool that can be used in a number of ways: Two kinds of albums: At left we used automatic mode to print a collection
Center for Faculty Development and Support Creating Powerful and Accessible Presentation
 Creating Powerful and Accessible Presentation PowerPoint 2007 Windows Tutorial Contents Create a New Document... 3 Navigate in the Normal View (default view)... 3 Input and Manipulate Text in a Slide...
Tables Part I. Session 45: Creating Tables Session 46: Modifying the Layout of Tables Session 47: Formatting the Design of Tables. Unit.
 Unit 9 Tables Part I Session 45: Creating Tables Session 46: Modifying the Layout of Tables Session 47: Formatting the Design of Tables 2 45 Creating Tables Session Objectives Create a table Enter data
Working with PDF s. To open a recent file on the Start screen, double click on the file name.
 Working with PDF s Acrobat DC Start Screen (Home Tab) When Acrobat opens, the Acrobat Start screen (Home Tab) populates displaying a list of recently opened files. The search feature on the top of the
Smart Tool Suite. Documentation. Users Manual. Version 1.0
 Smart Tool Suite Documentation Users Manual Version 1.0 1 Smart Tool Suite Users Manual Smart Tool Suite Description Installation Supported Operation Systems and Additional Licenses Installation Instructions
COPYRIGHTED MATERIAL. Making Excel More Efficient
 Making Excel More Efficient If you find yourself spending a major part of your day working with Excel, you can make those chores go faster and so make your overall work life more productive by making Excel
Creating Dashboard. Version: 7.3
 Creating Dashboard Version: 7.3 Copyright 2015 Intellicus Technologies This document and its content is copyrighted material of Intellicus Technologies. The content may not be copied or derived from, through
Agilent Technologies EZJIT and EZJIT Plus Jitter Analysis Software for Infiniium Series Oscilloscopes
 Agilent Technologies EZJIT and EZJIT Plus Jitter Analysis Software for Infiniium Series Oscilloscopes Data Sheet Features of the EZJIT Plus software that optimize jitter analysis include: Easy-to-use jitter
Network Traffic Measurements and Analysis
 DEIB - Politecnico di Milano Fall, 2017 Introduction Often, we have only a set of features x = x 1, x 2,, x n, but no associated response y. Therefore we are not interested in prediction nor classification,
LEGENDplex Data Analysis Software Version 8 User Guide
 LEGENDplex Data Analysis Software Version 8 User Guide Introduction Welcome to the user s guide for Version 8 of the LEGENDplex data analysis software for Windows based computers 1. This tutorial will
ADOBE AFTER EFFECTS USER-GUIDE
 ADOBE AFTER EFFECTS USER-GUIDE LOUPEDECK+ AND ADOBE AFTER EFFECTS Thank you for purchasing Loupedeck+ TM, a creative tool to increase your efficiency, ergonomics and creativity. Loupedeck+ console supports
Getting Started. In This Chapter
 Getting Started In This Chapter 2 This chapter introduces concepts and procedures that help you get started with AutoCAD. You learn how to open, close, and manage your drawings. You also learn about the
EXCEL 2003 DISCLAIMER:
 EXCEL 2003 DISCLAIMER: This reference guide is meant for experienced Microsoft Excel users. It provides a list of quick tips and shortcuts for familiar features. This guide does NOT replace training or
Forms/Distribution Acrobat X Professional. Using the Forms Wizard
 Forms/Distribution Acrobat X Professional Acrobat is becoming a standard tool for people and businesses to use in order to replicate forms and have them available electronically. If a form is converted
SmartView. User Guide - Analysis. Version 2.0
 SmartView User Guide - Analysis Version 2.0 Table of Contents Page i Table of Contents Table Of Contents I Introduction 1 Dashboard Layouts 2 Dashboard Mode 2 Story Mode 3 Dashboard Controls 4 Dashboards
0Acknowledgement. This application has been developed with the cooperation of the Inter-agency Group for Child Mortality Estimation.
 r4 0Acknowledgement This application has been developed with the cooperation of the Inter-agency Group for Child Mortality Estimation. 1Contents Introduction... 6 User Levels... 6 Learning CME Info...
Movavi PDF Editor User Guide. Quick start guide Opening files Editing documents Saving files
 Movavi PDF Editor User Guide Quick start guide Opening files Editing documents Saving files Table of Contents Quick start guide...2 Removing trial restrictions...3 Getting an activation key...4 Activating
VIEWZ 1.3 USER MANUAL
 VIEWZ 1.3 USER MANUAL 2007-08 Zeus Numerix ViewZ 1.3.0 User Manual Revision: 200806061429 The latest copy of this PDF may be downloaded from the website. An online (HTML) version is also available. Zeus
Panasonic VRF Software. New features of VRF software
 Panasonic VRF Software New features of VRF software April 2013 1 Contents: Mounting scheme... 5 1. Import building scheme into software... 5 1.1. Export building scheme as DXF from AutoCAD... 5 1.2. Export
Open Graphic Navigator
 Open Graphic Navigator Annunciation Monitoring Control Software Demo Quick Start Guide LT-6072 Rev 0 May 2014 Table of Contents Installation... 3 Hardware Prerequisites... 3 Operation... 8 Starting OpenGN...
CellaVision Proficiency Software
 CellaVision Proficiency USER S MANUAL 2.3 CellaVision Proficiency Preface CellaVision is a trademark of CellaVision AB. All other trademarks used in this document are property of their respective owners.
TROVIS-VIEW 4 Software TROVIS Operating Instructions EB 6661 EN. Electronics from SAMSON
 TROVIS-VIEW 4 Software TROVIS 6661 Operating Instructions Electronics from SAMSON EB 6661 EN Edition January 2015 Definition of signal words DANGER! Hazardous situations which, if not avoided, will result
1. Selection Tool allows selection of specific portions of the waveform on the timeline
 Audacity Interface Buttons & Keyboard Shortcuts 1. Selection Tool allows selection of specific portions of the waveform on the timeline 2. Time shift tool allows moving of audio sections to different places
Creating Interactive PDF Forms
 Creating Interactive PDF Forms Using Adobe Acrobat X Pro for the Mac University Information Technology Services Training, Outreach, Learning Technologies and Video Production Copyright 2012 KSU Department
SOLIBRI MODEL CHECKER
 SOLIBRI MODEL CHECKER Getting Started with Solibri Model Checker 2017 Copyright 2017 Solibri, Inc. WELCOME... 1 1. ABOUT SOLIBRI MODEL CHECKER... 1 Checking the Design... 1 Rule-based Analysis... 1 Communicating
intelligent Touch Manager
 Commissioning Manual Supplementary Volume intelligent Touch Manager Layout Screen Creation Tool Model DCM601A51 MONITOR SERVICE LAN LAN SW FRONT BACK ON SLAVE BACKUP D MASTER OFF MASTER CPU ALIVE LAN LINK
Fluke 1750 Power Analyze
 Fluke 1750 Power Analyze Release Notes Contents Current... 2 Version 2. 1... 2 History... 3 Version 2.01... 5 Version 2.00... 7 F1750_FPA_ReleaseNotes.doc 1 of 7 12/6/2010 Current Version 2. 1 1. Order
DEVELOPING DATABASE APPLICATIONS (INTERMEDIATE MICROSOFT ACCESS, X405.5)
") Technology & Information Management Instructor: Michael Kremer, Ph.D. Database Program: Microsoft Access Series DEVELOPING DATABASE APPLICATIONS (INTERMEDIATE MICROSOFT ACCESS, X405.5) Section 5 AGENDA
Technology & Information Management Instructor: Michael Kremer, Ph.D. Database Program: Microsoft Access Series DEVELOPING DATABASE APPLICATIONS (INTERMEDIATE MICROSOFT ACCESS, X405.5) Section 5 AGENDA
Autodesk Fusion 360 Training: The Future of Making Things Attendee Guide
 Autodesk Fusion 360 Training: The Future of Making Things Attendee Guide Abstract After completing this workshop, you will have a basic understanding of editing 3D models using Autodesk Fusion 360 TM to
Insight: Measurement Tool. User Guide
 OMERO Beta v2.2: Measurement Tool User Guide - 1 - October 2007 Insight: Measurement Tool User Guide Open Microscopy Environment: http://www.openmicroscopy.org OMERO Beta v2.2: Measurement Tool User Guide
Flair Geometry Editor Part I. Beginners FLUKA Course
 Flair Geometry Editor Part I Beginners FLUKA Course Starting the Geometry Editor Click on icon or from Menu View Geometry Editor or with [F4] shortcut Either start flair with option -g 2 Geometry editor
RS SigEdit A module of RS LabSite Advanced Graphical Display and Editing
 RS SigEdit A module of RS LabSite Advanced Graphical Display and Editing Expanding your Signal Editing Capabilities The RS LabSite suite of software offers two applications for data viewing and editing,
Table of Contents Lesson 1: Introduction to the New Interface... 2 Lesson 2: Prepare to Work with Office
 Table of Contents Lesson 1: Introduction to the New Interface... 2 Exercise 1: The New Elements... 3 Exercise 2: Use the Office Button and Quick Access Toolbar... 4 The Office Button... 4 The Quick Access
Process Eye Professional. Recall
 Process Eye Professional Recall Process Eye Professional Recall User Manual SP104010.101 August 2005 As part of our continuous product improvement policy, we are always pleased to receive your comments
Calculating a PCA and a MDS on a fingerprint data set
 BioNumerics Tutorial: Calculating a PCA and a MDS on a fingerprint data set 1 Aim Principal Components Analysis (PCA) and Multi Dimensional Scaling (MDS) are two alternative grouping techniques that can
Controlling the Drawing Display
 Controlling the Drawing Display In This Chapter 8 AutoCAD provides many ways to display views of your drawing. As you edit your drawing, you can control the drawing display and move quickly to different
Vol. 1 Introduction. OMS-100 User Manual. Publishing version: V2.2. Publishing version: V2.2 1
 Vol. 1 Introduction OMS-100 User Manual Publishing version: V2.2 Publishing version: V2.2 1 OMS-100 User Manual Table of Contents I Vol. 1 Introduction 5 2 1 Foreword... 5 1.1 Typographical Conventions...
Thermal Transient Test Installation and Operating Manual
 Thermal Transient Test Installation and Operating Manual 2705A De La Vina Street Santa Barbara, California 93105 Telephone (805) 682-0900 descon@silcom.com www. santabarbaraautomation.com Installation
A Guide to Processing Photos into 3D Models Using Agisoft PhotoScan
 A Guide to Processing Photos into 3D Models Using Agisoft PhotoScan Samantha T. Porter University of Minnesota, Twin Cities Fall 2015 Index 1) Automatically masking a black background / Importing Images.
A Guide to Autodesk Maya 2015
 A Guide to Autodesk Maya 2015 Written by Mitchell Youngerman Table of Contents Layout of Toolbars...pg 1 Creating Objects...pg 2 Selecting & Deselecting Objects...pg 3 Changing Perspective... pg 4 Transforming
Using the VSOM Operator Pages
 CHAPTER 8 The VSOM Operator Pages provide access to features that video surveillance operators can use to view, record, search, and control video. This chapter describes the Operator Pages in detail. It
Microsoft Excel Chapter 3. Working with Large Worksheets, Charting, and What-If Analysis
 Microsoft Excel 2013 Chapter 3 Working with Large Worksheets, Charting, and What-If Analysis Objectives Rotate text in a cell Create a series of month names Copy, paste, insert, and delete cells Format
USER MANUAL Page 0 of 107
 USER MANUAL 7.1 www.dgflick.com Page 0 of 107 Table of Contents 1.0. Introduction... 3 2.0. System Requirements... 4 3.0. Opening the Tool Box Getting Started... 5 3.1. Registration... 6 3.1.1. Online
Overview of Adobe Fireworks CS6
 Overview of Adobe Fireworks CS6 Lesson topics: Work with the Adobe Fireworks CS6 workspace: tools, Document windows, menus, and panels. Customize the workspace. Change the magnification of a document.
Adobe Acrobat Pro DC for Windows
 Adobe Acrobat Pro DC for Windows Creating Interactive PDF Forms University Information Technology Services Learning Technologies, Training & Audiovisual Outreach Copyright 2017 KSU Division of University
If the workshop is being performed on a laptop provided by Nordcad there is no need to install the workshop files.
 3D PCB workshop This workshop walks through some of the 3D features that are built into all OrCAD/Allegro PCB Design solutions. No extra software or options are required. Table of Contents 3D PCB workshop...
Creating a Spreadsheet by Using Excel
 The Excel window...40 Viewing worksheets...41 Entering data...41 Change the cell data format...42 Select cells...42 Move or copy cells...43 Delete or clear cells...43 Enter a series...44 Find or replace
User Guide. Web Intelligence Rich Client. Business Objects 4.1
 User Guide Web Intelligence Rich Client Business Objects 4.1 2 P a g e Web Intelligence 4.1 User Guide Web Intelligence 4.1 User Guide Contents Getting Started in Web Intelligence 4.1... 5 Log into EDDIE...
1 Place the iworx/214 unit on the bench, close to the computer. 3 When the dialog box appears, select ahk214.iws and then click Load.
 Experiment 1: LabScribe a Tutorial LabScribe allows data to be accumulated, displayed and analyzed on a computer screen in a format similar to a laboratory strip chart recorder. Equipment Setup 1 Place
Designing Adhoc Reports
 Designing Adhoc Reports Intellicus Enterprise Reporting and BI Platform Intellicus Technologies info@intellicus.com www.intellicus.com Copyright 2010 Intellicus Technologies This document and its content
Voice Again Documentation
 Screaming Bee LLC 6907 University Avenue Suite 252 Middleton, WI 53562 Voice Again Documentation Revision 4/13/2009 These documents represent the details on how to use Voice Again. These include a basic
V-BOX Cloud Configuration
 V-BOX Cloud Configuration Website: http://www.we-con.com.cn/en Technical Support: support@we-con.com.cn Skype: fcwkkj Phone: 86-591-87868869 QQ: 1043098682 Technical forum: http://wecon.freeforums.net/
IVAAP Getting Started Guide. IVAAP April 2018
 IVAAP Getting Started Guide IVAAP 2.0.2 April 2018 Welcome to IVAAP IVAAP is a digital framework designed to accelerate the development of web-based data visualization and analysis solutions for upstream
Topaz Workbench Data Visualizer User Guide
 Topaz Workbench Data Visualizer User Guide Table of Contents Displaying Properties... 1 Entering Java Regular Expressions in Filter Fields... 3 Related Topics... 3 Exporting the Extract Trace Events View...
Experiment 1: The LabScribe Tutorial
 Experiment 1: The LabScribe Tutorial LabScribe allows data to be accumulated, displayed and analyzed on a computer screen in a format similar to a laboratory strip chart recorder. Equipment Setup 1 Place
Preface 1. Storage System 2. Contact Information 3 SIPLUS CMS. SIPLUS CMS X-Tools - User Manual Storage System. English.
 X-Tools - User Manual - 07 - Storage System Preface 1 Storage System 2 Contact Information 3 X-Tools User Manual - 07 - Storage System Release 2012-09 Release 2012-09 1 / 44 X-Tools - User Manual - 07