Building Big Macs. Opening Explanation. Exploring. Student Hand-out
|
|
|
- Oscar Small
- 6 years ago
- Views:
Transcription


1 Student Hand-out Opening Explanation In this investigation we will explore the nature of a reaction from the POV (point of view) of the ingredients. When chemicals mix to form compounds they don t always match in such a way that all ingredients are used. In some cases you use all of one element and leave some of the other, or in some cases you have a little of each left because you don t have enough left to combine to make another molecule of the compound. This part of chemistry is called Stoikiometry and includes some of the mathematics that you have learned in the past. To set the stage for your experiences with chemicals we will simulate a reaction from the context of a Big Mac. The ingredients (elements) we will be interested in are Bread and Meat. Exploring 1. Get the Big Mac.tns file from the instructor or another student. To get the file from the computer plug in the USB Black link and launch the software. Once your device is recognized, just drag and drop the file.


2 If you don t have a folder created yet, you might want to create one. You may do this with the computer software as shown below.


3 To get the file from another student just plug in the mini-usb handheld to handheld cable and have the sending student press Home and choose 6:My Documents and highlight the file they want to send.


4 Then press /# and select 1:File to get the 5:Send option. When the file is sent, it may go into the Folder that it was stored in on the handheld that had it or you may copy or move it into another folder. 2. Open the file and follow the instructions starting on Page 1.1. Don t forget to periodically save your work as you add more to the document. To save it press /# and select 3:Save as shown above. Your team will submit one document. 3. On page 1.3 seed the random number generator using 4 digits. [RandSeed xxxx] Now determine how many slices of bread are in your loaf and how many slabs of meat are in your meat pack by using the randint command. Use randint(11,27). This will give you random integers between 11 and 27 inclusive. If you get the same number for bread and meat, press again until you get a different number. Store these values into Bread and Meat by keying in the number and then press /h to get and then the name as shown below and report the information on the Student Data Sheet below.


5 4. Now, on the same screen we wish to generate a random number of Big Macs to create. To get 7 of these and to store them into BigMac type randint(21,177,7) /hbigmac. Record these values in the Student Data Sheet below. 5. Move to the next page which is a spreadsheet. Place in the first column the list you just made for the number of Big Macs. Do this by moving your cursor to the second row in column labeled BigMacs and key in =BigMac and then press. This should fill your BigMacs column with the 7 sets of Big Macs you want to make. 6. Now move to the loaf column and report the number of loaves of bread you would have to buy to make the indicated number of Big Macs. Fill in the rest for all 7 Big Mac scenarios, both loaves of bread and meat packs using the number for slices per loaf and meat slabs per meat pack you generated before. Report the table in the Student Data Sheet below.

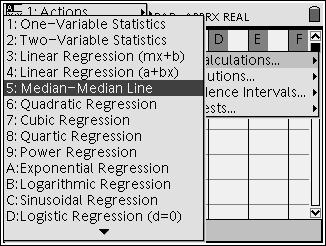
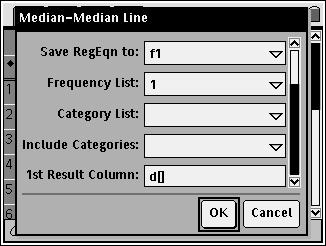
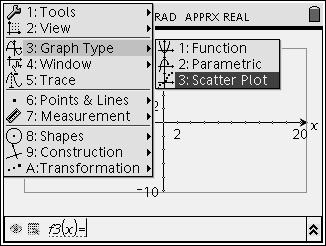
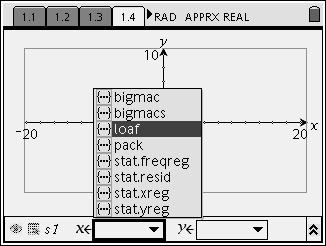
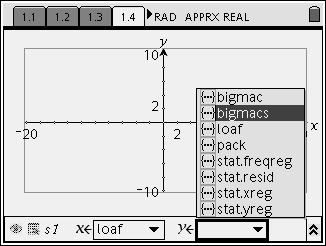
6 7. Do you see a pattern in the numbers? What was the algorithm you used in the process? Answer on the handheld on the next page. 8. Now let us plot some of the data. On the next page you will set up a scatter plot of Meat Packs vs. Loaves of Bread. This will mean that x = loaves and y = mpack. Adjust the window and see if you get a pattern. Make a sketch of what you see on the Student Data Sheet below. 9. Now return to the spreadsheet. Place your cursor in the third column, the Meat Pack list. Create a Median-Median regression placing the data in columns d and e and the function in f1(x). Report the function that was placed in f1(x) on the Student Data Sheet below.
7

8 10. Now return to the page with the scatter plot. Use the Menu button to get the Graph Type of Function on the edit line and then select f1(x) and press enter so it will show on the graph. Tab around to get off of the edit line and then with the hand grab the function and move it to a strategic place on the screen. Then edit the function by reducing the number of digits in the function. How was the fit? Explain in the Student Data Sheet below.

9 11. To test your understanding of the meaning of this graph, return to the spreadsheet and enter a point that represents an exact match of bread and meat.


10 That is, a number of Big Macs that will use up all the bread in the loaf and all the meat in the meat packs. Pick a number low enough to fit on the graph window, or you will have to adjust the settings to see the new point. Note: You will get an error, but once you have the ordered pair in your errors will go away. If you can t get an exact pair, use a number of Big Macs that will use up all of the bread or the meat and leave a very small amount of the other. Look for this point on the scatter plot. How close to the line did it come? How did your function change? Explain in the Student Data Sheet below. 12. You can repeat this process with the number of loaves of bread as a function of the number of meat packs, but it might be more revealing to see the relationship between the loaves and the number of Big Macs. Create a new page by pressing c and selecting 2 for Graph and Geometry. On this screen set up a plot with x = the number of loaves and y = the number of Big Macs. Adjust the Window so you can see all of the data. You can see a linear relationship and notice any mistakes in your calculations that you did not pick up before.
11


12 13. Given that you calculated the number of loaves needed given the number of Big Macs, you should be able to guess the function. Get the Function Graph Type and key in your guess. Tab around to get back to the graph and then you can either grab the line and rotate it, or just edit the values of the function. Once you get the best line, report it in the Student Data Sheet below. 14. Add another page for a new graph and set up the other plot. In this case we have x = Number of Meat Packs and y = Number of Big Macs. Report the results in the Student Data Sheet below. 15. Using these two equations work out the relationship between the loaves and the packs of meat. Report the results in the Student Data Sheet below. Hint: You have two equations and three variables. You must eliminate the number of Big Macs as a variable. 16. Test this equation on a known relationship that you have eough of - one that uses all of the meat and all of the bread. Report the results in the Student Data Sheet below.

13 17. Go to the page of Notes that reads Balance this. Answer the questions. 18. Now add a page that will hold a spreadsheet. Label the columns BM for Big Macs, B for loaves of bread, and M for packs of meat. Fill the BM column using a sequence with 77 Big Macs. In the second row of the first column key in = seq(x,x,1,77) and press enter. Now fill in the number of loaves of bread and the number of packs of meat needed for each of the number of Big Macs. Report in the Student Data Sheet below. 19. Add a new page for a graph and set up a scatter plot of B vs. BM (Big Macs = x and Loaves of Bread = y). Adjust the window and describe what you see in the Student Data Sheet below. 20. Now use the int function to get a line that matches the data. Report your equation in the Student Data Sheet below and answer the other questions. Note:
14 Recall that the int function just returns the integer value of the argument. For example int(17/2) = Given what you have learned now; answer the questions in the Student Data Sheet. 22. Answer the questions on the Notes pages in your handheld.
15 Student Data Sheet A. What seed value did your team use? B. How many slices of bread in a loaf? C. How many slabs of meat in a meat pack? D. How many Big Macs are you going to make? E. Complete the table below. Big Macs Loaves of Bread Meat Packs F. Sketch and label the scatter plot of Meat Packs vs. Loaves of Bread below. Do you see the number of Big Macs created on the graph?
16 G. What was the Median-Median result? H. Sketch the Median-Median line on F above and write the edited equation. Don t use y = mx +b, but MeatPacks = m * Loaves + b. How well did the line fit the data? Why is it not exact? What would it mean to land on this exact line? I. What point did you add to your list? How did it change the Median-Median line? Where did your point appear on the line? Make a sketch. Number of Big Macs: Number of Loaves of Bread: Number of Meat Packs: J. What is the relationship between the number of Big Macs and the number of loaves of bread? BigMacs = * Loaves K. What is the relationship between the number of Big Macs and the number of meat packs? BigMacs = * MeatPacks
17 L. Now combine these two equations to get the relationship between loaves and meat packs and then compare it to the answer you got in part G and H. M. Test the function on a known set of loaves and meat packs. Explain what happened below. N. What pattern did you see as you filled the columns for loaves of bread and packs of meat? O. Sketch and label your scatter plot of B vs. BM and explain what pattern you see.
18 P. What equation did you use for the step function? Q. Predict the equation relating BM and M, the number of Big Macs and the number of packs of meat. R. Use the equation from question P and try it on a know value from your earlier work. Show the results and explain below. S. Use your equation to predict the number of loaves of breaded needed for 7770 Big Macs. T. Give an example when you have an excess of meat as you build Big Macs using your loaves of bread and Meat Packs. Give an example when meat is the limiting agent. Which is the real limiting agent? Meat or Bread? Explain.
Number of Regions An Introduction to the TI-Nspire CAS Student Worksheet Created by Melissa Sutherland, State University of New York at Geneseo
 1 Name Number of Regions An Introduction to the TI-Nspire CAS Student Worksheet Created by Melissa Sutherland, State University of New York at Geneseo Below you will find copies of the notes provided on
Using Excel for Graphical Analysis of Data
 Using Excel for Graphical Analysis of Data Introduction In several upcoming labs, a primary goal will be to determine the mathematical relationship between two variable physical parameters. Graphs are
Spreadsheet View and Basic Statistics Concepts
 Spreadsheet View and Basic Statistics Concepts GeoGebra 3.2 Workshop Handout 9 Judith and Markus Hohenwarter www.geogebra.org Table of Contents 1. Introduction to GeoGebra s Spreadsheet View 2 2. Record
Chemistry 30 Tips for Creating Graphs using Microsoft Excel
 Chemistry 30 Tips for Creating Graphs using Microsoft Excel Graphing is an important skill to learn in the science classroom. Students should be encouraged to use spreadsheet programs to create graphs.
Using Excel for Graphical Analysis of Data
 EXERCISE Using Excel for Graphical Analysis of Data Introduction In several upcoming experiments, a primary goal will be to determine the mathematical relationship between two variable physical parameters.
Reference and Style Guide for Microsoft Excel
 Reference and Style Guide for Microsoft Excel TABLE OF CONTENTS Getting Acquainted 2 Basic Excel Features 2 Writing Cell Equations Relative and Absolute Addresses 3 Selecting Cells Highlighting, Moving
Standardized Tests: Best Practices for the TI-Nspire CX
 The role of TI technology in the classroom is intended to enhance student learning and deepen understanding. However, efficient and effective use of graphing calculator technology on high stakes tests
Inequalities. Kim Mullins Grade level: 5-8 Subject: mathematics Time required: 90 minutes
 Kim Mullins minutes Activity overview This activity is designed to introduce students to the concept of inequalities. Students will discover how to graph inequalities on a number line. Concepts Inequalities
Measuring the Stack Height of Nested Styrofoam Cups
 Measuring the Stack Height of Nested Styrofoam Cups Is there a relationship between the height of nested Styrofoam cups and the number of cups nested? If yes, elaborate on it. Measure the stack heights
Activity overview. Background. Concepts. Teacher preparation. Technical prerequisites
 The impact of b in By Øystein Nordvik Grade level: secondary (Years 9-1) Subject: mathematics Time required: 90 minutes Activity overview In this activity you will examine the influence parameter b has
= 3 + (5*4) + (1/2)*(4/2)^2.
 + (1/2)*(4/2)^2.") Physics 100 Lab 1: Use of a Spreadsheet to Analyze Data by Kenneth Hahn and Michael Goggin In this lab you will learn how to enter data into a spreadsheet and to manipulate the data in meaningful ways.
Physics 100 Lab 1: Use of a Spreadsheet to Analyze Data by Kenneth Hahn and Michael Goggin In this lab you will learn how to enter data into a spreadsheet and to manipulate the data in meaningful ways.
Select the Points You ll Use. Tech Assignment: Find a Quadratic Function for College Costs
 In this technology assignment, you will find a quadratic function that passes through three of the points on each of the scatter plots you created in an earlier technology assignment. You will need the
Using Excel This is only a brief overview that highlights some of the useful points in a spreadsheet program.
 Using Excel 2007 This is only a brief overview that highlights some of the useful points in a spreadsheet program. 1. Input of data - Generally you should attempt to put the independent variable on the
Microsoft Excel Using Excel in the Science Classroom
 Microsoft Excel Using Excel in the Science Classroom OBJECTIVE Students will take data and use an Excel spreadsheet to manipulate the information. This will include creating graphs, manipulating data,
2. INTRODUCTORY EXCEL
 CS130 - Introductory Excel 1 2. INTRODUCTORY EXCEL Fall 2017 CS130 - Introductory Excel 2 Introduction to Excel What is Microsoft Excel? What can we do with Excel? CS130 - Introductory Excel 3 Launch Excel
STAT 311 (3 CREDITS) VARIANCE AND REGRESSION ANALYSIS ELECTIVE: ALL STUDENTS. CONTENT Introduction to Computer application of variance and regression
 VARIANCE AND REGRESSION ANALYSIS ELECTIVE: ALL STUDENTS. CONTENT Introduction to Computer application of variance and regression") STAT 311 (3 CREDITS) VARIANCE AND REGRESSION ANALYSIS ELECTIVE: ALL STUDENTS. CONTENT Introduction to Computer application of variance and regression analysis. Analysis of Variance: one way classification,
STAT 311 (3 CREDITS) VARIANCE AND REGRESSION ANALYSIS ELECTIVE: ALL STUDENTS. CONTENT Introduction to Computer application of variance and regression analysis. Analysis of Variance: one way classification,
W7 DATA ANALYSIS 2. Your graph should look something like that in Figure W7-2. It shows the expected bell shape of the Gaussian distribution.
 Drawing Simple Graphs W7 DATA ANALYSIS 2 In some experiments, large amounts of data may be recorded and manipulation is performed using computer software. Although sophisticated, specialist software exists
KINETICS CALCS AND GRAPHS INSTRUCTIONS
 KINETICS CALCS AND GRAPHS INSTRUCTIONS 1. Open a new Excel or Google Sheets document. I will be using Google Sheets for this tutorial, but Excel is nearly the same. 2. Enter headings across the top as
Excel tutorial Introduction
 Office button Excel tutorial Introduction Microsoft Excel is an electronic spreadsheet. You can use it to organize your data into rows and columns. You can also use it to perform mathematical calculations
Non-linear regression tutorial
 Non-linear regression tutorial The following table shows the raw data for performing nonlinear regression using Polymath (refer Table E7-4.1, Elements of chemical reaction engineering, 5 th edition) Pco
Lab 1 Introduction to R
 Lab 1 Introduction to R Date: August 23, 2011 Assignment and Report Due Date: August 30, 2011 Goal: The purpose of this lab is to get R running on your machines and to get you familiar with the basics
Linear Regression in two variables (2-3 students per group)
") Linear Regression in two variables (2-3 students per group) 1. Choose a 2 or 3 person group. Turn in a list of group members to your instructor, in written form or through email, no later than February,
Linear Regression in two variables (2-3 students per group) 1. Choose a 2 or 3 person group. Turn in a list of group members to your instructor, in written form or through email, no later than February,
Maximizing the Area of a Garden
 Math Objectives Students will determine the relationship between the width and length of a garden with a rectangular shape and a fixed amount of fencing. The garden is attached to a barn, and exactly three
Learning Packet THIS BOX FOR INSTRUCTOR GRADING USE ONLY. Mini-Lesson is complete and information presented is as found on media links (0 5 pts)
") Learning Packet Student Name Due Date Class Time/Day Submission Date THIS BOX FOR INSTRUCTOR GRADING USE ONLY Mini-Lesson is complete and information presented is as found on media links (0 5 pts) Comments:
Learning Packet Student Name Due Date Class Time/Day Submission Date THIS BOX FOR INSTRUCTOR GRADING USE ONLY Mini-Lesson is complete and information presented is as found on media links (0 5 pts) Comments:
Appendix B: Using Graphical Analysis
 Appendix B: Using Graphical Analysis Graphical Analysis (GA) is a program by Vernier Software. This program is loaded on all of the Physics 170A computers as well as all of the regular Physics 170 computers.
addition + =5+C2 adds 5 to the value in cell C2 multiplication * =F6*0.12 multiplies the value in cell F6 by 0.12
 BIOL 001 Excel Quick Reference Guide (Office 2010) For your lab report and some of your assignments, you will need to use Excel to analyze your data and/or generate graphs. This guide highlights specific
2. Key the titles in cells A1 to D1, adjust to size 12, click on the bold button, and format with an underline.
 Excel Assignment 3 1. Create a new worksheet on Sheet 3. 2. Key the titles in cells A1 to D1, adjust to size 12, click on the bold button, and format with an underline. 3. Under Class in column D key Algebra
Microsoft Word for Report-Writing (2016 Version)
") Microsoft Word for Report-Writing (2016 Version) Microsoft Word is a versatile, widely-used tool for producing presentation-quality documents. Most students are well-acquainted with the program for generating
Microsoft Word for Report-Writing (2016 Version) Microsoft Word is a versatile, widely-used tool for producing presentation-quality documents. Most students are well-acquainted with the program for generating
1 Introduction to Using Excel Spreadsheets
 Survey of Math: Excel Spreadsheet Guide (for Excel 2007) Page 1 of 6 1 Introduction to Using Excel Spreadsheets This section of the guide is based on the file (a faux grade sheet created for messing with)
Appendix A OPENING AN EXCEL SPREADSHEET: To start working with a blank Excel spreadsheet, you should: 1. Log on to your station s computer.
 Appendix A INTRODUCTION: Microsoft Excel is a popular software package that combines spreadsheet accounting, graphing, and database functions into one program. One can enter data, modify it, and then the
Excel 2016: Part 2 Functions/Formulas/Charts
 Excel 2016: Part 2 Functions/Formulas/Charts Updated: March 2018 Copy cost: $1.30 Getting Started This class requires a basic understanding of Microsoft Excel skills. Please take our introductory class,
Improving Productivity with Parameters
 Improving Productivity with Parameters Michael Trull Rocky Brown Thursday, January 25, 2007 Improving Productivity with Parameters Part I The Fundamentals Parameters are variables which define the size
Activity: page 1/10 Introduction to Excel. Getting Started
 Activity: page 1/10 Introduction to Excel Excel is a computer spreadsheet program. Spreadsheets are convenient to use for entering and analyzing data. Although Excel has many capabilities for analyzing
NAME: BEST FIT LINES USING THE NSPIRE
 NAME: BEST FIT LINES USING THE NSPIRE For this portion of the activity, you will be using the same data sets you just completed where you visually estimated the line of best fit..) Load the data sets into
Functions in Excel. Structure of a function: Basic Mathematical Functions. Arithmetic operators: Comparison Operators:
 Page1 Functions in Excel Formulas (functions) are equations that perform calculations on values in your spreadsheet. A formula always starts with an equal sign (=). Example: =5+2*7 This formula multiples
Graphical Analysis of Data using Microsoft Excel [2016 Version]
![Graphical Analysis of Data using Microsoft Excel [2016 Version]](/thumbs/72/67574169.jpg "Graphical Analysis of Data using Microsoft Excel [2016 Version]") Graphical Analysis of Data using Microsoft Excel [2016 Version] Introduction In several upcoming labs, a primary goal will be to determine the mathematical relationship between two variable physical parameters.
Graphical Analysis of Data using Microsoft Excel [2016 Version] Introduction In several upcoming labs, a primary goal will be to determine the mathematical relationship between two variable physical parameters.
Physics. Bending Light ID: 8878
 Bending Light ID: 8878 By Peter Fox Time required 45 minutes Activity Overview In this activity, students explore the refraction of a single light ray. They begin by exploring light traveling from a less
Getting Started with the TI- Nspire CX
 Getting Started with the TI- Nspire CX Mr. Dana F. Morse dmorse@ti.com New York State Educational Technology Consultant Texas Instruments TI- Nspire CX for Beginners 1 Undo Like a Computer Touchpad Swipe
General Guidelines: SAS Analyst
 General Guidelines: SAS Analyst The Analyst application is a data analysis tool in SAS for Windows (version 7 and later) that provides easy access to basic statistical analyses using a point-and-click
San Francisco State University
 San Francisco State University Michael Bar Instructions for Excel 1. Plotting analytical function. 2 Suppose that you need to plot the graph of a function f ( x) = x on the interval [ 5,5]. Step 1: make
Rockefeller College MPA Excel Workshop: Clinton Impeachment Data Example
 Rockefeller College MPA Excel Workshop: Clinton Impeachment Data Example This exercise is a follow-up to the MPA admissions example used in the Excel Workshop. This document contains detailed solutions
Excel Primer CH141 Fall, 2017
 Excel Primer CH141 Fall, 2017 To Start Excel : Click on the Excel icon found in the lower menu dock. Once Excel Workbook Gallery opens double click on Excel Workbook. A blank workbook page should appear
Introduction to the workbook and spreadsheet
 Excel Tutorial To make the most of this tutorial I suggest you follow through it while sitting in front of a computer with Microsoft Excel running. This will allow you to try things out as you follow along.
Quickstart for Desktop Version
 Quickstart for Desktop Version What is GeoGebra? Dynamic Mathematics Software in one easy-to-use package For learning and teaching at all levels of education Joins interactive 2D and 3D geometry, algebra,
Experiment 1 CH Fall 2004 INTRODUCTION TO SPREADSHEETS
 Experiment 1 CH 222 - Fall 2004 INTRODUCTION TO SPREADSHEETS Introduction Spreadsheets are valuable tools utilized in a variety of fields. They can be used for tasks as simple as adding or subtracting
Introducing the new Casio fx-9860g AU
 Introducing the new Casio fx-9860g AU by Peter Karamoshos and Alastair Lupton. Introduction For students, teachers and schools who currently use the CFX-9850 GB PLUS, these new machines are very exciting.
Lab1: Introductory and Setup Activities
 Objectives: Lab1: Introductory and Setup Activities - to map network drives - to use email to submit documents - to work on Robotics exercises - to gain exposure to robotics programming - to become more
Math-2. Lesson 3-1. Equations of Lines
 Math-2 Lesson 3-1 Equations of Lines How can an equation make a line? y = x + 1 x -4-3 -2-1 0 1 2 3 Fill in the rest of the table rule x + 1 f(x) -4 + 1-3 -3 + 1-2 -2 + 1-1 -1 + 1 0 0 + 1 1 1 + 1 2 2 +
EDIT202 Spreadsheet Lab Prep Sheet
 EDIT202 Spreadsheet Lab Prep Sheet While it is clear to see how a spreadsheet may be used in a classroom to aid a teacher in marking (as your lab will clearly indicate), it should be noted that spreadsheets
Exploring Fractals through Geometry and Algebra. Kelly Deckelman Ben Eggleston Laura Mckenzie Patricia Parker-Davis Deanna Voss
 Exploring Fractals through Geometry and Algebra Kelly Deckelman Ben Eggleston Laura Mckenzie Patricia Parker-Davis Deanna Voss Learning Objective and skills practiced Students will: Learn the three criteria
TI Technology Guide for Is leisure time really shrinking?
 Creating Lists of Data, Displaying the Graph, Using the Regression Capabilities of the Calculator, Finding the Intersection Between Graphs, and Finding the Maximum of a Graph Creating Lists of Data To
Excel Assignment 4: Correlation and Linear Regression (Office 2016 Version)
") Economics 225, Spring 2018, Yang Zhou Excel Assignment 4: Correlation and Linear Regression (Office 2016 Version) 30 Points Total, Submit via ecampus by 8:00 AM on Tuesday, May 1, 2018 Please read all
Economics 225, Spring 2018, Yang Zhou Excel Assignment 4: Correlation and Linear Regression (Office 2016 Version) 30 Points Total, Submit via ecampus by 8:00 AM on Tuesday, May 1, 2018 Please read all
Chapter 2 Assignment (due Thursday, April 19)
") (due Thursday, April 19) Introduction: The purpose of this assignment is to analyze data sets by creating histograms and scatterplots. You will use the STATDISK program for both. Therefore, you should
(due Thursday, April 19) Introduction: The purpose of this assignment is to analyze data sets by creating histograms and scatterplots. You will use the STATDISK program for both. Therefore, you should
Data Management Project Using Software to Carry Out Data Analysis Tasks
 Data Management Project Using Software to Carry Out Data Analysis Tasks This activity involves two parts: Part A deals with finding values for: Mean, Median, Mode, Range, Standard Deviation, Max and Min
Exploring Parametric Equations With the Human Cannonball
 Grade level: 9-12 Exploring Parametric Equations With the Human Cannonball by Lisa Blank, Math & Science Teacher, Lyme Central School, Chaumont, NY Activity overview Students will explore the use of parametric
Graphing with Microsoft Excel
 Graphing with Microsoft Excel As an AP Physics 1 student, you must be prepared to interpret and construct relationships found in physical laws and experimental data. This exercise is meant to familiarize
Quickstart for Web and Tablet App
 Quickstart for Web and Tablet App What is GeoGebra? Dynamic Mathematic Software in one easy-to-use package For learning and teaching at all levels of education Joins interactive 2D and 3D geometry, algebra,
Your Name: Section: INTRODUCTION TO STATISTICAL REASONING Computer Lab #4 Scatterplots and Regression
 Your Name: Section: 36-201 INTRODUCTION TO STATISTICAL REASONING Computer Lab #4 Scatterplots and Regression Objectives: 1. To learn how to interpret scatterplots. Specifically you will investigate, using
Technology Instruction Guide Table of Contents
 Technology Instruction Guide Table of Contents TI-Nspire CX Handheld Overview of the TI-Nspire CX Handheld... T-5 Basic Functionality of the TI-Nspire CX Handheld The Home Screen... T-7 The Scratchpad...
Models for Nurses: Quadratic Model ( ) Linear Model Dx ( ) x Models for Doctors:
 Linear Model Dx ( ) x Models for Doctors:") The goal of this technology assignment is to graph several formulas in Excel. This assignment assumes that you using Excel 2007. The formula you will graph is a rational function formed from two polynomials,
The goal of this technology assignment is to graph several formulas in Excel. This assignment assumes that you using Excel 2007. The formula you will graph is a rational function formed from two polynomials,
Chemistry Excel. Microsoft 2007
 Chemistry Excel Microsoft 2007 This workshop is designed to show you several functionalities of Microsoft Excel 2007 and particularly how it applies to your chemistry course. In this workshop, you will
EXCEL PRACTICE 5: SIMPLE FORMULAS
 EXCEL PRACTICE 5: SIMPLE FORMULAS SKILLS REVIEWED: Simple formulas Printing with and without formulas Footers Widening a column Putting labels and data in Bold. PART 1 - DIRECTIONS 1. Open a new spreadsheet
DOING MORE WITH EXCEL: MICROSOFT OFFICE 2010
 DOING MORE WITH EXCEL: MICROSOFT OFFICE 2010 GETTING STARTED PAGE 02 Prerequisites What You Will Learn MORE TASKS IN MICROSOFT EXCEL PAGE 03 Cutting, Copying, and Pasting Data Filling Data Across Columns
Describe the Squirt Studio
 Name: Recitation: Describe the Squirt Studio This sheet includes both instruction sections (labeled with letters) and problem sections (labeled with numbers). Please work through the instructions and answer
This lesson is designed to improve students
 NATIONAL MATH + SCIENCE INITIATIVE Mathematics g x 8 6 4 2 0 8 6 4 2 y h x k x f x r x 8 6 4 2 0 8 6 4 2 2 2 4 6 8 0 2 4 6 8 4 6 8 0 2 4 6 8 LEVEL Algebra or Math in a unit on function transformations
Chapter 2 Assignment (due Thursday, October 5)
") (due Thursday, October 5) Introduction: The purpose of this assignment is to analyze data sets by creating histograms and scatterplots. You will use the STATDISK program for both. Therefore, you should
(due Thursday, October 5) Introduction: The purpose of this assignment is to analyze data sets by creating histograms and scatterplots. You will use the STATDISK program for both. Therefore, you should
Math Lab- Geometry Pacing Guide Quarter 3. Unit 1: Rational and Irrational Numbers, Exponents and Roots
 1 Jan. 3-6 (4 days) 2 Jan. 9-13 Unit 1: Rational and Irrational Numbers, Exponents and Roots ISTEP+ ISTEP Framework Focus: Unit 1 Number Sense, Expressions, and Computation 8.NS.1: Give examples of rational
Ingredients of Change: Nonlinear Models
 Chapter 2 Ingredients of Change: Nonlinear Models 2.1 Exponential Functions and Models As we begin to consider functions that are not linear, it is very important that you be able to draw scatter plots,
Creating a Histogram Creating a Histogram
 Creating a Histogram Another great feature of Excel is its ability to visually display data. This Tip Sheet demonstrates how to create a histogram and provides a general overview of how to create graphs,
Making Tables and Graphs with Excel. The Basics
 Making Tables and Graphs with Excel The Basics Where do my IV and DV go? Just like you would create a data table on paper, your IV goes in the leftmost column and your DV goes to the right of the IV Enter
Algebra 2 Chapter Relations and Functions
 Algebra 2 Chapter 2 2.1 Relations and Functions 2.1 Relations and Functions / 2.2 Direct Variation A: Relations What is a relation? A of items from two sets: A set of values and a set of values. What does
Logger Pro Resource Sheet
 Logger Pro Resource Sheet Entering and Editing Data Data Collection How to Begin How to Store Multiple Runs Data Analysis How to Scale a Graph How to Determine the X- and Y- Data Points on a Graph How
DOING MORE WITH EXCEL: MICROSOFT OFFICE 2013
 DOING MORE WITH EXCEL: MICROSOFT OFFICE 2013 GETTING STARTED PAGE 02 Prerequisites What You Will Learn MORE TASKS IN MICROSOFT EXCEL PAGE 03 Cutting, Copying, and Pasting Data Basic Formulas Filling Data
Brenda Lynch TI Summit Algebra 1 October 20, 2012
 I. Solving Equations A. On the TI-84 i. Plugging in answer with ( ) ii. Using the STO key to check your answer iii. Boolean Check (0 means incorrect, 1 means correct) iv. Using y= to solve an equation
Microsoft Excel 2007 Creating a XY Scatter Chart
 Microsoft Excel 2007 Creating a XY Scatter Chart Introduction This document will walk you through the process of creating a XY Scatter Chart using Microsoft Excel 2007 and using the available Excel features
Survey of Math: Excel Spreadsheet Guide (for Excel 2016) Page 1 of 9
 Page 1 of 9") Survey of Math: Excel Spreadsheet Guide (for Excel 2016) Page 1 of 9 Contents 1 Introduction to Using Excel Spreadsheets 2 1.1 A Serious Note About Data Security.................................... 2 1.2
Survey of Math: Excel Spreadsheet Guide (for Excel 2016) Page 1 of 9 Contents 1 Introduction to Using Excel Spreadsheets 2 1.1 A Serious Note About Data Security.................................... 2 1.2
Excel Tips and FAQs - MS 2010
 BIOL 211D Excel Tips and FAQs - MS 2010 Remember to save frequently! Part I. Managing and Summarizing Data NOTE IN EXCEL 2010, THERE ARE A NUMBER OF WAYS TO DO THE CORRECT THING! FAQ1: How do I sort my
Iwrite this realizing it is my final Technology
 TECHNOLOGY tips Sliders and Parameters Extend Interactive Software This department offers a forum where teachers can share innovative classroom activities and ideas related to teaching and learning mathematics
Technology Assignment: Scatter Plots
 The goal of this assignment is to create a scatter plot of a set of data. You could do this with any two columns of data, but for demonstration purposes we ll work with the data in the table below. You
How to use Excel Spreadsheets for Graphing
 How to use Excel Spreadsheets for Graphing 1. Click on the Excel Program on the Desktop 2. You will notice that a screen similar to the above screen comes up. A spreadsheet is divided into Columns (A,
Getting Ready for Quadratics With TI-Nspire 1) Creating a Scatter plot
 Creating a Scatter plot") Getting Ready for Quadratics With TI-Nspire 1) Creating a Scatter plot The relationship shown in the table represents the height, h metres, of a fireworks rocket t seconds after it is launched. Follow
Getting Ready for Quadratics With TI-Nspire 1) Creating a Scatter plot The relationship shown in the table represents the height, h metres, of a fireworks rocket t seconds after it is launched. Follow
Transformations: Translating Functions
 Math Objectives Students will vertically translate a function by adding a constant and write the appropriate symbolic representation for the translated function. Students will horizontally translate a
Entering Data in the Spreadsheet
 Excel How To Parts of the Spreadsheet Tiffany Davis, Briggs Elementary School A, B, C, etc. are the heads of the columns. 1, 2, 3, etc. are the heads of the rows. A cell is created by the intersection
Activity overview. Background. Concepts. Teacher preparation and Classroom management tips. Off on a Tangent
 By: Russell Brown Grade level: secondary (Years 10-12) Activity overview Many special properties can be shown to be associated with cubic functions. This activity investigates tangents to the cubic function
Batch Alignment. This can help you save time when you are authoring items for an assessment.
 Batch Alignment The Batch Alignment feature in ActivProgress allows you to align groups of questions to standards rather than align one question to standards at a time. This can help you save time when
[CALCULATOR OPERATIONS]
![[CALCULATOR OPERATIONS]](/thumbs/89/100577945.jpg "[CALCULATOR OPERATIONS]") Example 1: Set up a table of values (with x-values between 3 and 3) and use it to draw the graph of 3. Press MENU 2: VIEW A: SHOW TABLE 1. Select the GRAPHS option: Or Press MENU 5: TRACE 1: GRAPH TRACE
Example 1: Set up a table of values (with x-values between 3 and 3) and use it to draw the graph of 3. Press MENU 2: VIEW A: SHOW TABLE 1. Select the GRAPHS option: Or Press MENU 5: TRACE 1: GRAPH TRACE
2. What are the advantages of simulating a molecule or a reaction over doing the experiment in a lab?
 Name: Introduction 1. What is computational chemistry? 2. What are the advantages of simulating a molecule or a reaction over doing the experiment in a lab? Programming Match the following terms to their
SCHEME OF WORK YR 8 THETA 2 UNIT / LESSON
 SCHEME OF WORK YR 8 THETA 2 UNIT / LESSON STEPS STEPS FROM TO 1 Number 4th 6th OBJECTIVES 1.1 Calculations 5th 5th Use written methods to add and subtract with decimals. Calculate mentally. Calculate with
Year 10 General Mathematics Unit 2
 Year 11 General Maths Year 10 General Mathematics Unit 2 Bivariate Data Chapter 4 Chapter Four 1 st Edition 2 nd Edition 2013 4A 1, 2, 3, 4, 6, 7, 8, 9, 10, 11 1, 2, 3, 4, 6, 7, 8, 9, 10, 11 2F (FM) 1,
Name Period Date. UNIT 3: EXPRESSIONS AND EQUATIONS WEEK 12: Student Packet
 Name Period Date UNIT : EXPRESSIONS AND EQUATIONS WEEK 2: Student Packet 2. Inputs and Outputs Use tables, graphs, equations, and words to solve problems. Informally introduce the slope-intercept form
Using Technology to Make Connections in Algebra
 Using Technology to Make Connections in Algebra Richard Parr rparr@rice.edu Rice University School Mathematics Project http://rusmp.rice.edu All On The Line Alg1Week17_Systems.tns Name Class Problem 1
8.NS.1 8.NS.2. 8.EE.7.a 8.EE.4 8.EE.5 8.EE.6
 Standard 8.NS.1 8.NS.2 8.EE.1 8.EE.2 8.EE.3 8.EE.4 8.EE.5 8.EE.6 8.EE.7 8.EE.7.a Jackson County Core Curriculum Collaborative (JC4) 8th Grade Math Learning Targets in Student Friendly Language I can identify
1. Fill in the right hand side of the following equation by taking the derivative: (x sin x) =
 =") 7.1 What is x cos x? 1. Fill in the right hand side of the following equation by taking the derivative: (x sin x = 2. Integrate both sides of the equation. Instructor: When instructing students to integrate
7.1 What is x cos x? 1. Fill in the right hand side of the following equation by taking the derivative: (x sin x = 2. Integrate both sides of the equation. Instructor: When instructing students to integrate
HP Prime Advanced Graphing Calculator
 HP Prime Advanced Graphing Calculator HP Prime is the latest advanced graphing calculator from Hewlett-Packard. It incorporates a fullcolor, multi-touch screen and comes pre-loaded with 18 HP Apps. HP
Excel Basics Rice Digital Media Commons Guide Written for Microsoft Excel 2010 Windows Edition by Eric Miller
 Excel Basics Rice Digital Media Commons Guide Written for Microsoft Excel 2010 Windows Edition by Eric Miller Table of Contents Introduction!... 1 Part 1: Entering Data!... 2 1.a: Typing!... 2 1.b: Editing
Setup Mount the //geobase/geo4315 server and add a new Lab2 folder in your user folder.
 L AB 2 L AB M2 ICROSOFT E XCEL O FFICE W ORD, E XCEL & POWERP OINT XCEL & P For this lab, you will practice importing datasets into an Excel worksheet using different types of formatting. First, you will
SAMLab Tip Sheet #4 Creating a Histogram
 Creating a Histogram Another great feature of Excel is its ability to visually display data. This Tip Sheet demonstrates how to create a histogram and provides a general overview of how to create graphs,
Chapter 6 Project: A New Model for Earthquakes
 Chapter 6 Project: A New Model for Earthquakes Name Name 1. Background: Faults are approximately planar breaks in the Earth's crust and mantle. Crustal blocks moving quickly along a fault produce vibrations
PR3 & PR4 CBR Activities Using EasyData for CBL/CBR Apps
 Summer 2006 I2T2 Process Page 23. PR3 & PR4 CBR Activities Using EasyData for CBL/CBR Apps The TI Exploration Series for CBR or CBL/CBR books, are all written for the old CBL/CBR Application. Now we can
Logger Pro 3. Quick Reference
 Logger Pro 3 Quick Reference Getting Started Logger Pro Requirements To use Logger Pro, you must have the following equipment: Windows 98, 2000, ME, NT, or XP on a Pentium processor or equivalent, 133