SUB-PANEL SPREADSHEET GUIDE (SUB-PANELUG)
|
|
|
- Joshua Harrell
- 6 years ago
- Views:
Transcription
 Developed under Contract OPM1912C0033 U.S. OFFICE OF PERSONNEL MANAGEMENT Training and Management Assistance Branch Project Code: B80BTBWZ and")
 Acquisition Workforce Demonstration Project (AcqDemo) Prepared by: SRA International, Inc.")
1 United States Department of Defense (DoD) Acquisition Workforce Demonstration Project (AcqDemo) Contribution-based Compensation and Appraisal System Software (CAS2Net) Developed under Contract OPM1912C0033 U.S. OFFICE OF PERSONNEL MANAGEMENT Training and Management Assistance Branch Project Code: B80BTBWZ and VPD SUB-PANEL SPREADSHEET GUIDE (SUB-PANELUG) Version 2014 October 24, 2014 Document Control Number: SUB_PANELUG2014-OPM1912C0033 Prepared for: United States Department of Defense (DoD) Acquisition Workforce Demonstration Project (AcqDemo) Prepared by: SRA International, Inc Washington Blvd Arlington, VA 22201
2 ACQDEMO Sub-Panel Spreadsheet (2014) Description October 2014 The spreadsheet is a Microsoft Excel workbook called Sub-Panel Meeting 2014 v1.xlsm consisting of seven tabbed worksheets. The workbook may be downloaded from the Pay Pool Notices section of CAS2Net located at The workbook initially comes empty and must be populated with data by importing a file. CAS2Net, a database application written in Oracle, creates the import files. Any time a file is imported into the workbook, all existing data are cleared and replaced with data from the imported file. The five tabbed worksheets are described in this document in the order in which they appear along the bottom of the workbook. Page Contents Data... 5 Assigning Scores on the Data Sheet. 9 Data Sheet Column Descriptions Matrix Rails Report.. 17 Delta Statistics.. 18 Current OCS Scatter Plot.. 20 Group into Categories Contents This worksheet, shown below, is the first sheet you will see after you open the workbook and activate the macros. It provides a brief description of the workbook, its purpose, and contents. The right side of the sheet helps you import and export files and navigate around the workbook. The cycle year is displayed in the upper left corner just below the red title bar. The date and time of the last import and export of files into and out of the workbook are shown in the upper right corner. 2

3 Clicking on the Import link, or on the Import button on the custom toolbar located in the Add-Ins menu, will allow you to import a data file into the workbook. You will be prompted to select the data file you want to import. Once you have selected the file, it might be necessary to click the yellow Enable Content button below the Excel ribbon. It will take the workbook several seconds (depending on the size of your file) to import the data and run the many macros required to format it properly. You can only import files that have been specifically formatted for import into the workbook by CAS2Net. These files will automatically have been named ppxxxx_to_sub-panel_first_last.csv, where XXXX is your pay pool number and First and Last is the first and last name of the sub-panel manager. Clicking on the View link will take you to the tabbed worksheet called Data that is described later in this document. This is where you will do all appraisal score entry and compensation adjustments. Clicking on the Export link (or the Export button on the custom toolbar) will allow you to export a data file from the workbook. You will be prompted to confirm the export and to select the location where you want the exported file saved. The workbook will automatically assign the file name ppxxxx_to_master_first_last.csv. This file is specifically formatted to upload Sub- Panel data to CAS2Net. 3
4 Summary Reports Clicking on the Rails Report link takes you to the tabbed worksheet called Rails that is described later in this document. Clicking on the Career Path Factor Matrices ranked by Final Score link takes you to the tabbed worksheet called Matrix that is described later in this document. Clicking on the Summary Statistics of Delta OCS link takes you to the tabbed worksheet called Delta Stats that is described later in this document. Clicking on the Distribution of Delta OCS link takes you to the tabbed worksheet called Delta Plot that is described later in this document. Scatter Plot of OCS Score by Salary Clicking on the Current Pay & 2014 SPL link takes you to the tabbed worksheet called Cur OCS that is described later in this document. 4

5 Data This is the main worksheet in the workbook. It contains all of the employee data and is where individual contribution factors are recorded. The worksheet contains forty-seven columns that are each described in the table at the end of this section. The upper left corner of the worksheet contains links to the Main Menu (Contents) and Scores section of this worksheet used to enter scores. You can quickly return to the upper left corner of this or any other worksheet by holding down the <Ctrl> key and pressing <Home>. From Add- Ins, there are fourteen buttons on the custom toolbar at the top of this worksheet that perform the following functions: Import Use import to load a data file into the workbook 5
6 Export Use export to create a data file for uploading the results to CAS2Net. Capture Chart Images Brings up a user form that allows output of any/all charts in the CMS spreadsheet either into Excel or PowerPoint format. This is the safest way to output charts from the CMS spreadsheet as employee data is not included with the chart. Charts are copied/pasted as images not as Excel objects. Validate (next row) Checks the internal consistency of data entered in the worksheet and circles inconsistent entries in red. For example, a numerical factor score that is outside the allowable range for the corresponding category score would be circled. A red flag appears at the top of each column that contains a red circle to help you quickly locate the circles. You cannot run validation while rows or columns are hidden or filters are set if you do, you will get a warning message reminding you to unhide all columns and rows and clear all filters before running the validation macro. Clear Circles After clicking on the Validate button and correcting any highlighted inconsistencies, this button removes all red circles. You can also click on Validate again to remove the circles and leave any that were not fixed. Highlight This button allows you to change the background color of any selected cell or range of cells. To remove the highlighting, select the cell or range of cells again, click the highlight button, and choose the white background. Hide Column The user may hide columns from view by selecting any cell in the columns to be hidden and then clicking on this button. Single columns are selected by clicking on any cell in the column. Multiple columns are selected by holding down the <Ctrl> key while clicking on any cells in the columns. A range of columns is selected by clicking and dragging across any row of cells in the range of columns. The first two columns (A and B) cannot be hidden. Unhide Column Clicking this button will unhide columns you have just hidden as long as you have not moved the cursor. You can also unhide a specific column or range of columns by highlighting cells in the columns on either side of the hidden column or range of columns, and then clicking this button. Unhide All Columns This button restores to view all hidden columns. Hide Row The user may hide rows from view by selecting any cell in the row or rows to be hidden and then clicking on this button. A single row is selected by clicking on any cell in the row. Multiple rows are selected by holding down the <Ctrl> key while clicking on any cells in the rows. A range of rows is selected by clicking and dragging up or down any column of cells. Unhide Row Clicking this button will unhide rows you have just hidden as long as you have not moved the cursor. You can also unhide a specific row or range of rows by highlighting cells in the rows on either side of the hidden rows or range of rows, and then clicking this button. Unhide All Rows This button restores to view all hidden rows. 6
7 Each column heading contains a filter arrow for the column. Clicking on the filter arrow brings up a list of all of the values in the column, plus the following other choices: All, Top 10, Custom, Blanks, Non-Blanks. The user can limit which rows are displayed by filtering on specific values in one or more columns. For example, the display could be limited to only NH-4 employees by filtering on NH in column K and 4 in column L. When a filter is active, the filter arrow turns blue. A filter may be de-activated by selecting All under the filter choices. Blanks and Blanks may also be used for filtering. For example, to identify employees who do not yet have numerical scores on a particular factor, select Blanks in the filter for the factor score column. The Top 10 choice displays the ten highest values in a column it can only be used with numerical data. The Custom choice allows the user to design more complex filter criteria. Clear All Filters This button clears all filters you have set, including filters on worksheets other than the one you are currently on. You cannot import data into the workbook with filters set, so any time you click the Import link on the Contents sheet all filters are automatically cleared. Sort Allows the user to sort the rows in the worksheet by any combination of up to three columns. Sorts may be in either ascending or descending order. The sorts are specified using the standard Excel sort function. You must know the letters of the columns you want to sort on because the column headings cannot be included in the sort range. There are five open rows colored light blue at the bottom of the worksheet (see below). These rows, which are below all of the data records, provide cells in which the user can enter formulas to compute column statistics (sums, means, counts, etc.). If you want the formulas to be reapplied each time you import data into the spreadsheet, you must include in the formula s range the row immediately above and below the data range. In other words, if you have 50 records in your spreadsheet, the first record is in row 11 and the last record is in row 60. If you want to compute the average CY 2014 base pay, you would enter the following formula in cell N64: AVERAGE(N10:N61). Now, each time you import a file into the workbook, this formula will be applied to the data in column N, no matter how many records are included in the import. If you only include the data rows in the formula range (N11:N60 in the example), the formula will return a reference error after each import. To preserve formulas in the open rows you must import data into the same workbook into which you entered the formulas the formulas in the open rows are not included in the import and export routines. The first light blue row can also be used to hide columns. Entering an X in any column, except for the first two, will cause that column to be hidden when the Hide Columns button is clicked. This can be handy, especially for selecting non-adjacent columns that are repeatedly hidden and unhidden. See image below. Note that cell(s) simply selected by your cursor will also cause the column(s) to be hidden. 7
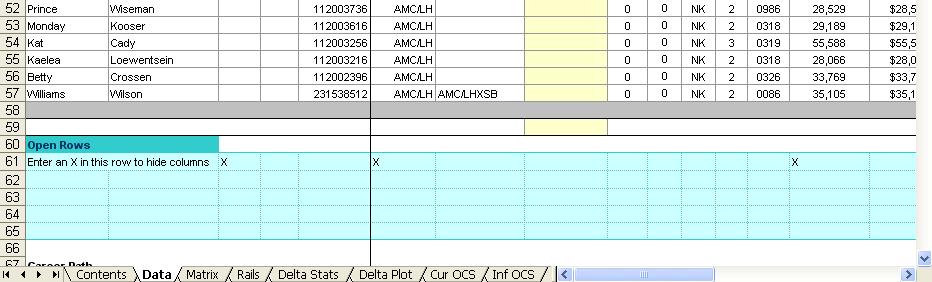
8 8

9 Assigning Scores on the Data Sheet Column W on the Data Sheet marks the beginning of the score matrix for the sub-panel. The first six columns show the categorical factor scores, the second six columns show the integer scores. Categorical scores are optional but can help determine final scores. Each Career Path and Broadband level combination has their own valid range of categorical scores. In the example below the sub-panel has decided to assign Barry Burns a Categorical score of 2H for Problem Solving by clicking the appropriate cell and then clicking the desired score. For each Categorical Score, there is a valid list of Final Scores. For 2H the valid Final Score range is 62 to 66. The sub-panel has decided to assign a final score of 65. This is accomplished by clicking the appropriate cell and choosing the desired score. See below. 9
10 There is an additional method for setting scores described later in this document named Group into Categories which uses a user form. This approach allows for ranking of employees in lists which can aid in assigning scores. 10
11 Data Sheet Column Descriptions Sources: Col Source 1 = Import file (locked in spreadsheet, can be changed in CAS2Net) 2 = Computed by spreadsheet (locked) 3 = User entry (shaded below) Description A 1 Employee's last name B 1 Employee's first name C 1 Employee's middle initial D 1 Employee's suffix (e.g., Jr, II) E 1 Employee's CAS2Net ID number F 1 Employee's Pay pool number G 1 Employee's office symbol H 3 First open (wildcard) column for pay pool use. Values entered or computed in this column will be saved in any export back to CAS2Net, and will be returned to this worksheet in subsequent imports. However, formulas entered in this column will not be preserved through subsequent export-import cycles unless the formula is also entered in the yellow cell immediately below the wide gray line after the last person's record. The formula is only saved if you import back into the same spreadsheet you used to do the export. You can change the column heading by clicking in the cell immediately above the heading, using the down arrow to enter the cell, and changing the heading in the formula bar. I 1 Employee's presumptive status (0 = none, 1 = due to time, compute OCS from SPL and current pay, 2 = due to circumstances, compute OCS from SPL and current pay, 3 = due to circumstances, recertify previous OCS) J 1 Retained pay (0 = no, 1 = yes, no CRI, eligible for CA, GPI = half the dollar increase in maximum pay for the employee's broadband and career path) K 1 Career path (NH = Business Management and Technical Management Professional, NJ = Technical Management Support, NK = Administrative Support) L 1 Broadband level (1, 2, 3, or 4) M 1 Occupational series N 1 CY 2014 annual basic pay rate O 2 Reflects max of band for employees on retained pay employees instead of base pay. Used for calculating columns such as expected OCS. P 1 Locality pay area code Q 1 OCS from the previous cycle R 1 Start date the date the employee first entered AcqDemo. This date does NOT change when employees move from one AcqDemo pay pool to another. S 1 Name of the employee's first level supervisor 11
12 Col Source Description T 1 Sub-Panel meeting identifier. This can be the name of the manager who will chair the sub-panel meeting at which the employee's contribution scores will be assigned, or it could be an organization code or other identifier for a group of employees. CAS2Net can export separate files for each unique identifier in this column. U 1 Name of the employee's pay pool manager. This name will appear on Part I of the CMS Salary Appraisal Form given to the employee. V Marks the start of the appraisal score section of the spreadsheet W 3 Category score for contribution factor "Problem Solving". Categories are selected from a drop down list by first clicking in the cell and then clicking on the down arrow. Only categories appropriate to the employee's career path are displayed. If the import file contains this score, it will appear in the spreadsheet. Once category scores are selected do not use the delete key to remove them because this disables the corresponding numerical score drop down list. If you want to remove a category score, select the first (blank) entry on the drop down list. X 3 Category score for contribution factor "Teamwork/Cooperation". Categories are selected from a drop down list by first clicking in the cell and then clicking on the down arrow. Only categories appropriate to the employee's career path are displayed. If the import file contains this score, it will appear in the spreadsheet. Once category scores are selected do not use the delete key to remove them because this disables the corresponding numerical score drop down list. If you want to remove a category score, select the first (blank) entry on the drop down list. Y 3 Category score for contribution factor "Customer Relations". Categories are selected from a drop down list by first clicking in the cell and then clicking on the down arrow. Only categories appropriate to the employee's career path are displayed. If the import file contains this score, it will appear in the spreadsheet. Once category scores are selected do not use the delete key to remove them because this disables the corresponding numerical score drop down list. If you want to remove a category score, select the first (blank) entry on the drop down list. Z 3 Category score for contribution factor "Leadership/Supervision". Categories are selected from a drop down list by first clicking in the cell and then clicking on the down arrow. Only categories appropriate to the employee's career path are displayed. If the import file contains this score, it will appear in the spreadsheet. Once category scores are selected do not use the delete key to remove them because this disables the corresponding numerical score drop down list. If you want to remove a category score, select the first (blank) entry on the drop down list. 12
13 Col Source Description AA 3 Category score for contribution factor "Communication". Categories are selected from a drop down list by first clicking in the cell and then clicking on the down arrow. Only categories appropriate to the employee's career path are displayed. If the import file contains this score, it will appear in the spreadsheet. Once category scores are selected do not use the delete key to remove them because this disables the corresponding numerical score drop down list. If you want to remove a category score, select the first (blank) entry on the drop down list. AB 3 Category score for contribution factor "Resource Management". Categories are selected from a drop down list by first clicking in the cell and then clicking on the down arrow. Only categories appropriate to the employee's career path are displayed. If the import file contains this score, it will appear in the spreadsheet. Once category scores are selected do not use the delete key to remove them because this disables the corresponding numerical score drop down list. If you want to remove a category score, select the first (blank) entry on the drop down list. AC 3 Final numerical score for contribution factor "Problem Solving". If a category score for this factor was entered, the numerical score is selected from a drop down list by first clicking in the cell and then clicking on the down arrow; only numbers appropriate to the category are displayed. If no category score was entered, the entire range of numerical scores for the employee s career path is displayed in the drop-down list. If the import file contains this score, it will appear in the spreadsheet. AD 3 Final numerical score for contribution factor "Teamwork/Cooperation". If a category score for this factor was entered, the numerical score is selected from a drop down list by first clicking in the cell and then clicking on the down arrow; only numbers appropriate to the category are displayed. If no category score was entered, the entire range of numerical scores for the employee s career path is displayed in the drop-down list. If the import file contains this score, it will appear in the spreadsheet. AE 3 Final numerical score for contribution factor "Customer Relations". If a category score for this factor was entered, the numerical score is selected from a drop down list by first clicking in the cell and then clicking on the down arrow; only numbers appropriate to the category are displayed. If no category score was entered, the entire range of numerical scores for the employee s career path is displayed in the drop-down list. If the import file contains this score, it will appear in the spreadsheet. AF 3 Final numerical score for contribution factor "Leadership/Supervision". If a category score for this factor was entered, the numerical score is selected from a drop down list by first clicking in the cell and then clicking on the down arrow; only numbers appropriate to the category are displayed. If no category score was entered, the entire range of numerical scores for the employee s career path is displayed in the drop-down list. If the import file contains this score, it will appear in the spreadsheet. 13
14 Col Source Description AG 3 Final numerical score for contribution factor "Communication". If a category score for this factor was entered, the numerical score is selected from a drop down list by first clicking in the cell and then clicking on the down arrow; only numbers appropriate to the category are displayed. If no category score was entered, the entire range of numerical scores for the employee s career path is displayed in the drop-down list. If the import file contains this score, it will appear in the spreadsheet. AH 3 Final numerical score for contribution factor "Resource Management". If a category score for this factor was entered, the numerical score is selected from a drop down list by first clicking in the cell and then clicking on the down arrow; only numbers appropriate to the category are displayed. If no category score was entered, the entire range of numerical scores for the employee s career path is displayed in the drop-down list. If the import file contains this score, it will appear in the spreadsheet. AI 1 Weight on contribution factor "Problem Solving" (must be "1" this year) AJ 1 Weight on contribution factor "Teamwork/Cooperation" (must be "1" this year) AK 1 Weight on contribution factor "Customer Relations" (must be "1" this year) AL 1 Weight on contribution factor "Leadership/Supervision" (must be "1" this year) AM 1 Weight on contribution factor "Communication" (must be "1" this year) AN 1 Weight on contribution factor "Resource Management" (must be "1" this year) AO 3 Second open (wildcard) column for pay pool use. Values entered or computed in this column will be saved in any export back to the Oracle application, and will be returned to this worksheet in subsequent imports. However, formulas entered in this column will not be preserved through subsequent export-import cycles unless the formula is also entered in the yellow cell immediately below the wide gray line after the last person's record. The formula is only saved if you import back into the same spreadsheet you used to do the export. You can change the column heading by clicking in the cell immediately above the heading, using the down arrow to enter the cell, and changing the heading in the formula bar. AP 3 Third open (wildcard) column for pay pool use. Values entered or computed in this column will be saved in any export back to the Oracle application, and will be returned to this worksheet in subsequent imports. However, formulas entered in this column will not be preserved through subsequent export-import cycles unless the formula is also entered in the yellow cell immediately below the wide gray line after the last person's record. The formula is only saved if you import back into the same spreadsheet you used to do the export. You can change the column heading by clicking in the cell immediately above the heading, using the down arrow to enter the cell, and changing the heading in the formula bar. AQ 2 Expected OCS, computed from CY2014 basic pay and the formula for the Standard Pay Line (SPL). AR 2 Expected OCS Range, computed from the 2014 lower rail and upper rail pay and the Standard Pay Line (SPL). 14
15 Col Source Description AS OCS, computed as the weighted average of the six numerical factor scores for non-presumptive employees. If any of the final numerical factor scores are blank, this field will be #N/A. For presumptive status = 1 or 2, 2014 OCS is LN(Base Pay / GS-1step1pay 2014) calculated as Expected OCS =. For LN( ) presumptive status = 3, last year's score is recertified. AT 2 Delta OCS, computed as the difference between Expected OCS (column BG and 2014 OCS (column BH) AU 2 Rail position based on final numerical OCS and current basic pay (A = above the upper rail, B = below the lower rail, C1 = above the SPL but below the upper rail, C2 = on or below the SPL but on or above the lower rail) 15
 may be done by broadband or across all broadbands. The order can be selected with the four buttons on the left.")
16 Matrix This worksheet, part of which is shown below, rank orders employees by individual factor score and by OCS. Employees are identified by career path, last name, first name, and broadband. The sort order on scores (low to high or high to low) may be done by broadband or across all broadbands. The order can be selected with the four buttons on the left. There are links in the upper left corner to return to the Main Menu (Contents) worksheet or the Data worksheet. The first matrix orders all employees in all career paths based on their OCS. The second matrix orders all employees in the NH career path according to each of the six final numerical factor scores, and by OCS. The second and third matrices (off the screen to the right in the figure above) order all of the NJ and NK employees. The career path links in the upper left corner of the worksheet are for quick navigation among the matrices you can also browse through the worksheet using the scroll bars at the bottom and right of the screen. The data can be printed by clicking on the printer icon on the Excel toolbar. The all career path matrix is printed on one page, and each career path matrix is printed on a separate page. 16
 worksheet in the upper left corner, and the report can by printed by clicking on the printer icon in the Excel toolbar.")
17 Rails Report This worksheet provides counts and percentages of employees by rail position. The table shows rail position by career path based on final, numerical OCS. There is a link to the Main Menu (Contents) worksheet in the upper left corner, and the report can by printed by clicking on the printer icon in the Excel toolbar. Below the rails report there are some parameters and computations relating to the current year and next year s SPL and rails. These values are used internally by the workbook and are not intended for pay pool use. 17

18 Delta Statistics This worksheet displays Delta OCS averages and standard deviations. Delta OCS is the difference between an employee s actual OCS and expected OCS, as computed from current salary and the formula for the SPL. Standard deviation is a statistical measure of the range, or dispersion of Delta OCS values. The top of the worksheet shows statistics by career path and overall. The bottom of the worksheet shows statistics for groups of employees within each career path. The groups can be defined by either first level supervisor (column S on the Data sheet) or any other grouping scheme entered into Wildcard columns (H, AO, AP) on the main data sheet. The Delta Plot Grouping box at the top of this worksheet contains radio buttons that allows you to switch groupings between first level supervisor and the Wildcard columns. Note that the example shown above uses broadband level to define the groups. To make this happen, the data from column L (Broadband Level) on the main data worksheet was first copied into Wildcard #1, and then the Wildcard #1 radio button was selected in the Delta Plot Grouping box at the top of 18
19 this worksheet. If you change the groupings in Wildcard #1, be sure to click the Refresh button in the Delta Plot Grouping box to re-compute the statistics. Since standard deviations cannot be computed for distributions with only one data point, groups with only one employee show N/A for standard deviation. If you wish to filter out these cases, click on the button labeled Hide with only 1 employee at the top of the worksheet. To restore the display of these groups, click on the Show all button. The upper left corner of the worksheet contains a link back to the Main Menu Contents worksheet. 19
20 Current OCS Scatter Plot Scatter plots of OCS vs. pay, displayed on top of the SPL and rails, have proven to be excellent tools for visualizing the overall outcome of the appraisal and pay setting process. The workbook contains one plot, which is OCS vs. current (unadjusted) pay on top of the CY2014 SPL and rails (example above. This plot shows, for each career path, how employee pay and contribution during 2014 compared to the SPL and rails for that year. You can filter employees as well as hide rows on the Data tab. This will preclude those employees from appearing on the scatterplot. If you have set a filter or hidden rows the following message box will appear. 20


21 After you click OK the scatterplot will be replotted with only those employees visible on the Data tab. A replot can also be accomplished by click the Replot button on the custom toolbar. On the worksheet you can identify the specific values associated with a dot on the graph by placing the mouse pointer on the dot. The values will appear in a yellow pop-up text box. These values differ depending on how many employees are charted. If there are 255 employees or more, the career path, along with the salary and OCS, of the employee appears in the text box. If there are less than 255, the name of the employee, along with salary and OCS, are visible. This is a result of a limitation in Excel. Employees can be filtered on the Data sheet to bring the employee counts below 255 and then return to one of the three scatterplot tabs and click the Replot button. A message appears like the one below. You can adjust the size of the symbols on the plot by clicking on the custom toolbar icon labeled Format. This will give you a pop-up like the one shown below in which you can increase or decrease the default font size of the markers. 21

22 The plot may be printed by clicking on the printer icon on the Excel tool bar. 22
23 Group into Categories One of the more useful features of the sub-panel spreadsheet is the ability to assign employee ratings via a user form. Click the Group into Categories link on the Contents sheet to see the form below. Because available scores vary by career path, each career path must be addressed separately. You begin by selecting a career path, a factor, and the contribution level to be scored. If there are individuals in the career path who have not yet been assigned a category score for the selected factor, that employee s name will appear in the Unrated box. Employees who have already been assigned a categorical score for the factor are listed in the appropriate category score box. Note that the broadband of each employee is listed in parentheses after the employee s name. If there are employees in the Unrated box, they will need to be moved to the appropriate score category box. This can be initiated by either double clicking on the name of the employee or by highlighting the employee s name with a single click and then clicking on the Move from Unrated button. 23

24 In either case, we will now be presented with a drop down list box for choosing the categorical score. The drop down list includes the allowable scores for that level as well as the scores one above and one below that range. You can either enter an allowable score directly into the Score: box or click on the down arrow to select a score from the list Once the sub-panel selects a score, click the Apply button. The selected employee s name will then be moved to the bottom of the list in the appropriate categorical score box. In this case, we have assigned Morgana Durstine a category 2ML score for problem solving. Note that she has been placed at the bottom of the 2ML category score box. See below. 24
25 Now that Morgan has been placed in the 2ML category for problem solving, you might want to move her to a position in the list to indicate her contribution relative to others in the same category. The sub-panel decides that her contribution is greater than that of Rafe Bairds but less than that of Matilda Tilson. To move her to this position, you highlight her name in the 2ML category box and click the Up button in the Employee Movement area at the top center of the screen. The first click moves her to just below Rolf. See below. 25

26 Continuing with Morgana Durstine, you double click on her name in the 2ML category box. The Assign Integer Score box now appears, with a drop down list of allowable scores. 26

27 Scores are assigned by either clicking the desired score or typing it in using the keyboard and then clicking the Apply button to save the score to the list box on the user form. Notice the score of 40 we assigned to her is to the right of her name now. Clicking the Apply button will save any scores assigned, categorical or integer, to the spreadsheet as well as sort the list box descending by integer score. Clicking the Close button closes the form and returns the user to the sub-panel spreadsheet. 27
AcqDemo Pay Pool Analysis Tool (PAT) User Guide
 User Guide") AcqDemo Pay Pool Analysis Tool (PAT) User Guide December 2014 The spreadsheet is a Microsoft Excel workbook called PAT 2014 v1.0 consisting of eighteen tabbed worksheets. The PAT was created for AcqDemo
AcqDemo Pay Pool Analysis Tool (PAT) User Guide December 2014 The spreadsheet is a Microsoft Excel workbook called PAT 2014 v1.0 consisting of eighteen tabbed worksheets. The PAT was created for AcqDemo
Troubleshooting in Microsoft Excel 2002
 Page 1 of 8 Troubleshooting in Microsoft Excel 2002 Result: To understand how to work with the Excel software to enter data, navigate the page, and print materials. Tabs Look at the tabs at the bottom
IP4 - Running reports
 To assist with tracking and monitoring HRIS recruitment and personnel, reports can be run from Discoverer Plus. This guide covers the following process steps: Logging in... 2 What s changed? Changed reference
Excel Advanced
 Excel 2016 - Advanced LINDA MUCHOW Alexandria Technical & Community College 320-762-4539 lindac@alextech.edu Table of Contents Macros... 2 Adding the Developer Tab in Excel 2016... 2 Excel Macro Recorder...
Chapter 4. Microsoft Excel
 Chapter 4 Microsoft Excel Topic Introduction Spreadsheet Basic Screen Layout Modifying a Worksheet Formatting Cells Formulas and Functions Sorting and Filling Borders and Shading Charts Introduction A
Microsoft Excel 2010 Tutorial
 1 Microsoft Excel 2010 Tutorial Excel is a spreadsheet program in the Microsoft Office system. You can use Excel to create and format workbooks (a collection of spreadsheets) in order to analyze data and
Basic Microsoft Excel 2007
 Basic Microsoft Excel 2007 Contents Starting Excel... 2 Excel Window Properties... 2 The Ribbon... 3 Tabs... 3 Contextual Tabs... 3 Dialog Box Launchers... 4 Galleries... 5 Minimizing the Ribbon... 5 The
Excel 2013 Intermediate
 Excel 2013 Intermediate Quick Access Toolbar... 1 Customizing Excel... 2 Keyboard Shortcuts... 2 Navigating the Spreadsheet... 2 Status Bar... 3 Worksheets... 3 Group Column/Row Adjusments... 4 Hiding
SPREADSHEET (Excel 2007)
") SPREADSHEET (Excel 2007) 1 U N I T 0 4 BY I F T I K H A R H U S S A I N B A B U R Spreadsheet Microsoft Office Excel 2007 (or Excel) is a computer program used to enter, analyze, and present quantitative
SPREADSHEET (Excel 2007) 1 U N I T 0 4 BY I F T I K H A R H U S S A I N B A B U R Spreadsheet Microsoft Office Excel 2007 (or Excel) is a computer program used to enter, analyze, and present quantitative
KINETICS CALCS AND GRAPHS INSTRUCTIONS
 KINETICS CALCS AND GRAPHS INSTRUCTIONS 1. Open a new Excel or Google Sheets document. I will be using Google Sheets for this tutorial, but Excel is nearly the same. 2. Enter headings across the top as
Candy is Dandy Project (Project #12)
") Candy is Dandy Project (Project #12) You have been hired to conduct some market research about M&M's. First, you had your team purchase 4 large bags and the results are given for the contents of those
Candy is Dandy Project (Project #12) You have been hired to conduct some market research about M&M's. First, you had your team purchase 4 large bags and the results are given for the contents of those
EXCEL 2003 DISCLAIMER:
 EXCEL 2003 DISCLAIMER: This reference guide is meant for experienced Microsoft Excel users. It provides a list of quick tips and shortcuts for familiar features. This guide does NOT replace training or
Introduction to Microsoft Excel
 Chapter A spreadsheet is a computer program that turns the computer into a very powerful calculator. Headings and comments can be entered along with detailed formulas. The spreadsheet screen is divided
Excel Tips for Compensation Practitioners Weeks Data Validation and Protection
 Excel Tips for Compensation Practitioners Weeks 29-38 Data Validation and Protection Week 29 Data Validation and Protection One of the essential roles we need to perform as compensation practitioners is
Excel Quick Reference Guide
 Excel Quick Reference Guide CONTENTS Screen elements 3 Mouse shapes and actions 3 Cursor movement keys 4 Select a range using the keyboard 4 Edit cell contents 5 Select a range using the mouse 5 Sorting
Excel Tables & PivotTables
 Excel Tables & PivotTables A PivotTable is a tool that is used to summarize and reorganize data from an Excel spreadsheet. PivotTables are very useful where there is a lot of data that to analyze. PivotTables
Division of School Facilities
 Division of School Facilities Module 3 EXCEL HIDE/ FILTER/ SORT & PRINT New York City Department of Education Office of Enterprise Development and Support Applications Support Group 2011 TABLE of CONTENTS
Introduction to Excel Workshop
 Introduction to Excel Workshop Empirical Reasoning Center September 9, 2016 1 Important Terminology 1. Rows are identified by numbers. 2. Columns are identified by letters. 3. Cells are identified by the
Using Excel to Troubleshoot EMIS Data
 Using Excel to Troubleshoot EMIS Data Overview Basic Excel techniques can be used to analyze EMIS data from Student Information Systems (SISs), from the Data Collector, and on ODE EMIS reports This session
Excel Template Instructions for the Glo-Brite Payroll Project (Using Excel 2010 or 2013)
") Excel Template Instructions for the Glo-Brite Payroll Project (Using Excel 2010 or 2013) T APPENDIX B he Excel template for the Payroll Project is an electronic version of the books of account and payroll
Excel Template Instructions for the Glo-Brite Payroll Project (Using Excel 2010 or 2013) T APPENDIX B he Excel template for the Payroll Project is an electronic version of the books of account and payroll
Quick Guide for Excel 2015 Data Management November 2015 Training:
 http://pfw.edu Quick Guide for Excel 2015 Data Management November 2015 Training: http://pfw.edu/training Excel 2016 Data Management AutoFill and Custom Lists AutoFill 1. Select the range that contains
CHAPTER 1 GETTING STARTED
 GETTING STARTED WITH EXCEL CHAPTER 1 GETTING STARTED Microsoft Excel is an all-purpose spreadsheet application with many functions. We will be using Excel 97. This guide is not a general Excel manual,
Microsoft Excel Microsoft Excel
 Excel 101 Microsoft Excel is a spreadsheet program that can be used to organize data, perform calculations, and create charts and graphs. Spreadsheets or graphs created with Microsoft Excel can be imported
Introduction to Microsoft Excel 2010
 Introduction to Microsoft Excel 2010 This class is designed to cover the following basics: What you can do with Excel Excel Ribbon Moving and selecting cells Formatting cells Adding Worksheets, Rows and
INTRODUCTION... 1 UNDERSTANDING CELLS... 2 CELL CONTENT... 4
 Introduction to Microsoft Excel 2016 INTRODUCTION... 1 The Excel 2016 Environment... 1 Worksheet Views... 2 UNDERSTANDING CELLS... 2 Select a Cell Range... 3 CELL CONTENT... 4 Enter and Edit Data... 4
Unit 12. Electronic Spreadsheets - Microsoft Excel. Desired Outcomes
 Unit 12 Electronic Spreadsheets - Microsoft Excel Desired Outcomes Student understands Excel workbooks and worksheets Student can navigate in an Excel workbook and worksheet Student can use toolbars and
Compensation Workbench
 Compensation Workbench Contents Logging into Compensation Workbench... 3 Compensation Allocations Page... 4 Viewing Job History... 5 Viewing Employee Details... 6 Viewing Compensation History... 7 Entering
Microsoft How to Series
 Microsoft How to Series Getting Started with EXCEL 2007 A B C D E F Tabs Introduction to the Excel 2007 Interface The Excel 2007 Interface is comprised of several elements, with four main parts: Office
EXCEL Using Excel for Data Query & Management. Information Technology. MS Office Excel 2007 Users Guide. IT Training & Development
 Information Technology MS Office Excel 2007 Users Guide EXCEL 2007 Using Excel for Data Query & Management IT Training & Development (818) 677-1700 Training@csun.edu TABLE OF CONTENTS Introduction... 1
4) Study the section of a worksheet in the image below. What is the cell address of the cell containing the word "Qtr3"?
 Study the section of a worksheet in the image below. What is the cell address of the cell containing the word Qtr3?") Choose The Correct Answer: 1) Study the highlighted cells in the image below and identify which of the following represents the correct cell address for these cells: a) The cell reference for the selected
Choose The Correct Answer: 1) Study the highlighted cells in the image below and identify which of the following represents the correct cell address for these cells: a) The cell reference for the selected
Gradebook Entering, Sorting, and Filtering Student Scores March 10, 2017
 Gradebook Entering, Sorting, and Filtering Student Scores March 10, 2017 1. Entering Student Scores 2. Exclude Student from Assignment 3. Missing Assignments 4. Scores by Class 5. Sorting 6. Show Filters
Links to Activities ACTIVITY 4.1. Links to Activities ACTIVITY 4.
 EXCEL Working with Multiple Worksheets, Tables, and Other File Formats Section 4 Skills Insert, delete, and rename a worksheet Format sheet tabs Move and copy a worksheet Group and ungroup worksheets Link
Introduction to Excel 2007
 Introduction to Excel 2007 These documents are based on and developed from information published in the LTS Online Help Collection (www.uwec.edu/help) developed by the University of Wisconsin Eau Claire
Excel Tables and Pivot Tables
 A) Why use a table in the first place a. Easy to filter and sort if you only sort or filter by one item b. Automatically fills formulas down c. Can easily add a totals row d. Easy formatting with preformatted
1. Math symbols Operation Symbol Example Order
 Excel 2 Microsoft Excel 2013 Mercer County Library System Brian M. Hughes, County Executive Excel s Order of Calculation 1. Math symbols Operation Symbol Example Order Parentheses ( ) =(4+2)*8 1st Exponents
Spreadsheet definition: Starting a New Excel Worksheet: Navigating Through an Excel Worksheet
 Copyright 1 99 Spreadsheet definition: A spreadsheet stores and manipulates data that lends itself to being stored in a table type format (e.g. Accounts, Science Experiments, Mathematical Trends, Statistics,
Excel Level 1
 Excel 2016 - Level 1 Tell Me Assistant The Tell Me Assistant, which is new to all Office 2016 applications, allows users to search words, or phrases, about what they want to do in Excel. The Tell Me Assistant
Introduction to Microsoft Excel 2010
 Introduction to Microsoft Excel 2010 This class is designed to cover the following basics: What you can do with Excel Excel Ribbon Moving and selecting cells Formatting cells Adding Worksheets, Rows and
Numbers Basics Website:
 Website: http://etc.usf.edu/te/ Numbers is Apple's new spreadsheet application. It is installed as part of the iwork suite, which also includes the word processing program Pages and the presentation program
Microsoft Excel 2010 Part 2: Intermediate Excel
 CALIFORNIA STATE UNIVERSITY, LOS ANGELES INFORMATION TECHNOLOGY SERVICES Microsoft Excel 2010 Part 2: Intermediate Excel Spring 2014, Version 1.0 Table of Contents Introduction...3 Working with Rows and
Starting Excel application
 MICROSOFT EXCEL 1 2 Microsoft Excel: is a special office program used to apply mathematical operations according to reading a cell automatically, just click on it. It is called electronic tables Starting
Advanced Excel for EMIS Coordinators
 Advanced Excel for EMIS Coordinators Helen Mills helenmills@metasolutions.net 2015 Metropolitan Educational Technology Association Outline Macros Conditional Formatting Text to Columns Pivot Tables V-Lookup
Pivot Tables, Lookup Tables and Scenarios
 Introduction Format and manipulate data using pivot tables. Using a grading sheet as and example you will be shown how to set up and use lookup tables and scenarios. Contents Introduction Contents Pivot
THE EXCEL ENVIRONMENT... 1 EDITING...
 Excel Essentials TABLE OF CONTENTS THE EXCEL ENVIRONMENT... 1 EDITING... 1 INSERTING A COLUMN... 1 DELETING A COLUMN... 1 INSERTING A ROW... DELETING A ROW... MOUSE POINTER SHAPES... USING AUTO-FILL...
Microsoft Excel 2010
 Microsoft Excel 2010 omar 2013-2014 First Semester 1. Exploring and Setting Up Your Excel Environment Microsoft Excel 2010 2013-2014 The Ribbon contains multiple tabs, each with several groups of commands.
Data. Selecting Data. Sorting Data
 1 of 1 Data Selecting Data To select a large range of cells: Click on the first cell in the area you want to select Scroll down to the last cell and hold down the Shift key while you click on it. This
Introduction to Microsoft Excel
 Platform: Windows PC Ref no: ins100 Date: May 2007 Version: 1 Author: C.P.Houghton Introduction to Microsoft Excel Microsoft Excel is a piece of software which allows you to create professional spreadsheets
Reference Services Division Presents. Excel Introductory Course
 Reference Services Division Presents Excel 2007 Introductory Course OBJECTIVES: Navigate Comfortably in the Excel Environment Create a basic spreadsheet Learn how to format the cells and text Apply a simple
Contents. Group 3 Excel Handouts 2010
 Contents Function Library... 2 Function Operators... 2 Order of Multiple Operators... 2 Function Library... 3 Formula Auditing... 4 Name Cells... 7 Comments... 8 Show Ink... 9 Show Ink is a colorful way
3/31/2016. Spreadsheets. Spreadsheets. Spreadsheets and Data Management. Unit 3. Can be used to automatically
 MICROSOFT EXCEL and Data Management Unit 3 Thursday March 31, 2016 Allow users to perform simple and complex sorting Allow users to perform calculations quickly Organizes and presents figures that can
San Francisco State University
 San Francisco State University Michael Bar Instructions for Excel 1. Plotting analytical function. 2 Suppose that you need to plot the graph of a function f ( x) = x on the interval [ 5,5]. Step 1: make
Basic tasks in Excel 2013
 Basic tasks in Excel 2013 Excel is an incredibly powerful tool for getting meaning out of vast amounts of data. But it also works really well for simple calculations and tracking almost any kind of information.
Introduction to Excel 2013
 Introduction to Excel 2013 Copyright 2014, Software Application Training, West Chester University. A member of the Pennsylvania State Systems of Higher Education. No portion of this document may be reproduced
Excel 2003 Tutorial II
 This tutorial was adapted from a tutorial by see its complete version at http://www.fgcu.edu/support/office2000/excel/index.html Excel 2003 Tutorial II Charts Chart Wizard Chart toolbar Resizing a chart
Microsoft Excel Chapter 1. Creating a Worksheet and a Chart
 Microsoft Excel 2013 Chapter 1 Creating a Worksheet and a Chart Objectives Describe the Excel worksheet Enter text and numbers Use the Sum button to sum a range of cells Enter a simple function Copy the
Intermediate Excel 2016
 Intermediate Excel 2016 Relative & Absolute Referencing Relative Referencing When you copy a formula to another cell, Excel automatically adjusts the cell reference to refer to different cells relative
Excel Select a template category in the Office.com Templates section. 5. Click the Download button.
 Microsoft QUICK Excel 2010 Source Getting Started The Excel Window u v w z Creating a New Blank Workbook 2. Select New in the left pane. 3. Select the Blank workbook template in the Available Templates
Introduction to Excel Workshop
 Introduction to Excel Workshop Empirical Reasoning Center June 6, 2016 1 Important Terminology 1. Rows are identified by numbers. 2. Columns are identified by letters. 3. Cells are identified by the row-column
Section 1 Microsoft Excel Overview
 Course Topics: I. MS Excel Overview II. Review of Pasting and Editing Formulas III. Formatting Worksheets and Cells IV. Creating Templates V. Moving and Navigating Worksheets VI. Protecting Sheets VII.
GAZIANTEP UNIVERSITY INFORMATICS SECTION SEMETER
 GAZIANTEP UNIVERSITY INFORMATICS SECTION 2010-2011-2 SEMETER Microsoft Excel is located in the Microsoft Office paket. in brief Excel is spreadsheet, accounting and graphics program. WHAT CAN WE DO WITH
Excel 2016: Part 2 Functions/Formulas/Charts
 Excel 2016: Part 2 Functions/Formulas/Charts Updated: March 2018 Copy cost: $1.30 Getting Started This class requires a basic understanding of Microsoft Excel skills. Please take our introductory class,
Excel 2007 New Features Table of Contents
 Table of Contents Excel 2007 New Interface... 1 Quick Access Toolbar... 1 Minimizing the Ribbon... 1 The Office Button... 2 Format as Table Filters and Sorting... 2 Table Tools... 4 Filtering Data... 4
Tips & Tricks: MS Excel
 Tips & Tricks: MS Excel 080501.2319 Table of Contents Navigation and References... 3 Layout... 3 Working with Numbers... 5 Power Features... 7 From ACS to Excel and Back... 8 Teacher Notes: Test examples
Microsoft Excel 2013: Excel Basics June 2014
 Microsoft Excel 2013: Excel Basics June 2014 Description Excel is a powerful spreadsheet program. Please note that in this class we will use Excel 2010 or 2013. Learn how to create spreadsheets, enter
Cell to Cell mouse arrow Type Tab Enter Scroll Bars Page Up Page Down Crtl + Home Crtl + End Value Label Formula Note:
 1 of 1 NOTE: IT IS RECOMMENDED THAT YOU READ THE ACCOMPANYING DOCUMENT CALLED INTRO TO EXCEL LAYOUT 2007 TO FULLY GRASP THE BASICS OF EXCEL Introduction A spreadsheet application allows you to enter data
I OFFICE TAB... 1 RIBBONS & GROUPS... 2 OTHER SCREEN PARTS... 4 APPLICATION SPECIFICATIONS... 5 THE BASICS...
 EXCEL 2010 BASICS Microsoft Excel I OFFICE TAB... 1 RIBBONS & GROUPS... 2 OTHER SCREEN PARTS... 4 APPLICATION SPECIFICATIONS... 5 THE BASICS... 6 The Mouse... 6 What Are Worksheets?... 6 What is a Workbook?...
EXCEL 2010 BASICS JOUR 772 & 472 / Ira Chinoy
 EXCEL 2010 BASICS JOUR 772 & 472 / Ira Chinoy Virus check and backups: Remember that if you are receiving a file from an external source a government agency or some other source, for example you will want
Introduction to Microsoft Excel 2010
 Introduction to Microsoft Excel 2010 THE BASICS PAGE 02! What is Microsoft Excel?! Important Microsoft Excel Terms! Opening Microsoft Excel 2010! The Title Bar! Page View, Zoom, and Sheets MENUS...PAGE
Business Process Procedures
 Business Process Procedures 14.40 MICROSOFT EXCEL TIPS Overview These procedures document some helpful hints and tricks while using Microsoft Excel. Key Points This document will explore the following:
Excel Tips for Compensation Practitioners Weeks Pivot Tables
 Excel Tips for Compensation Practitioners Weeks 23-28 Pivot Tables Week 23 Creating a Pivot Table Pivot tables are one of the most amazing and powerful tools in Excel, but many users do not know how to
ADD AND NAME WORKSHEETS
 1 INTERMEDIATE EXCEL While its primary function is to be a number cruncher, Excel is a versatile program that is used in a variety of ways. Because it easily organizes, manages, and displays information,
Introduction to Excel
 Office Button, Tabs and Ribbons Office Button The File menu selection located in the upper left corner in previous versions of Excel has been replaced with the Office Button in Excel 2007. Clicking on
Microsoft Excel Basics Ben Johnson
 Microsoft Excel Basics Ben Johnson Topic...page # Basics...1 Workbook and worksheets...1 Sizing columns and rows...2 Auto Fill...2 Sort...2 Formatting Cells...3 Formulas...3 Percentage Button...4 Sum function...4
Microsoft Excel Chapter 1. Creating a Worksheet and an Embedded Chart
 Microsoft Excel 2010 Chapter 1 Creating a Worksheet and an Embedded Chart Objectives Describe the Excel worksheet Enter text and numbers Use the Sum button to sum a range of cells Copy the contents of
Microsoft Excel > Shortcut Keys > Shortcuts
 Microsoft Excel > Shortcut Keys > Shortcuts Function Keys F1 Displays the Office Assistant or (Help > Microsoft Excel Help) F2 Edits the active cell, putting the cursor at the end* F3 Displays the (Insert
MICROSOFT EXCEL TUTORIAL HANDOUT
 MICROSOFT EXCEL TUTIAL HANDOUT Opening Microsoft Excel 1. Click on the START button. 2. Click on PROGRAMS. 3. Click on MICROSOFT EXCEL. The Excel Screen Formula Bar Minimize Buttons Restore Buttons Close
Making an entry into the CIS Payments workbook
 Making an entry into the CIS Payments workbook By now you should have carried out the CIS Payments workbook Setup. If you have not done so you will need to do this before you can proceed. When you have
Data Should Not be a Four Letter Word Microsoft Excel QUICK TOUR
 Toolbar Tour AutoSum + more functions Chart Wizard Currency, Percent, Comma Style Increase-Decrease Decimal Name Box Chart Wizard QUICK TOUR Name Box AutoSum Numeric Style Chart Wizard Formula Bar Active
Patricia Andrada Quick Guide Excel 2010 Data Management-July 2011 Page 1
 Patricia Andrada Quick Guide Excel 2010 Data Management-July 2011 Page 1 Excel 2010 Data Management AutoFill and Custom Lists AutoFill 1. Select the range that contains the initial value(s) of the series
Work expectations will be included in your appraisal during the Recognition Phase of the performance management process.
 Monitoring is the day-to-day activity of paying attention to how the employee s work is going. Both the supervisor and employee track progress toward meeting the work expectations that were established
Introduction to MS Excel Management Information Systems
 Introduction to MS Excel 2007 Management Information Systems 1 Overview What is MS Excel? Functions. Sorting Data. Filtering Data. Data Form. Data Validation. Create charts in Excel. Formatting Cells.
Working with Data in Microsoft Excel 2010
 Working with Data in Microsoft Excel 2010 This document provides instructions for using the sorting and filtering features in Microsoft Excel, as well as working with multiple worksheets in the same workbook
Rockefeller College MPA Excel Workshop: Clinton Impeachment Data Example
 Rockefeller College MPA Excel Workshop: Clinton Impeachment Data Example This exercise is a follow-up to the MPA admissions example used in the Excel Workshop. This document contains detailed solutions
MICROSOFT EXCEL KEYBOARD SHORCUTS
 MICROSOFT EXCEL KEYBOARD SHORCUTS F1 Displays the Office Assistant or (Help > Microsoft Excel Help) F2 Edits the active cell, putting the cursor at the end F3 Displays the (Insert > Name > Paste) dialog
Using Excel 2011 at Kennesaw State University
 Using Excel 2011 at Kennesaw State University Getting Started Information Technology Services Outreach and Distance Learning Technologies Copyright 2011 - Information Technology Services Kennesaw State
Microsoft Access 2007 Module 2
 Microsoft Access 007 Module http://pds.hccfl.edu/pds Microsoft Access 007: Module August 007 007 Hillsborough Community College - Professional Development and Web Services Hillsborough Community College
Using Microsoft Excel
 Using Microsoft Excel Formatting a spreadsheet means changing the way it looks to make it neater and more attractive. Formatting changes can include modifying number styles, text size and colours. Many
Excel Basics. TJ McKeon
 Excel Basics TJ McKeon What is Excel? Electronic Spreadsheet in a rows and columns layout Can contain alphabetical and numerical data (text, dates, times, numbers) Allows for easy calculations and mathematical
Using Microsoft Excel
 About Excel Using Microsoft Excel What is a Spreadsheet? Microsoft Excel is a program that s used for creating spreadsheets. So what is a spreadsheet? Before personal computers were common, spreadsheet
Links to Activities ACTIVITY 1.1. Links to Activities Links to Activities
 EXCEL Analyzing Data Using Excel Section 1 Skills Start Excel and identify features in the Excel window Enter labels and values Use the fill handle to enter a series Enter formulas Create a formula using
Reviewing Hidden Content during Native Review
 Reviewing Hidden Content during Native Review Introduction When conducting a native file review it is important to note that certain files can have hidden content. These are features of certain software
Excel Shortcuts Increasing YOUR Productivity
 Excel Shortcuts Increasing YOUR Productivity CompuHELP Division of Tommy Harrington Enterprises, Inc. tommy@tommyharrington.com https://www.facebook.com/tommyharringtonextremeexcel Excel Shortcuts Increasing
Microsoft Excel 2010 Handout
 Microsoft Excel 2010 Handout Excel is an electronic spreadsheet program you can use to enter and organize data, and perform a wide variety of number crunching tasks. Excel helps you organize and track
Excel Lesson 1 Microsoft Excel Basics
 Microsoft Excel Basics Microsoft Office 2010 Introductory 1 Objectives Define the terms spreadsheet and worksheet. Identify the parts of a worksheet. Start Excel, open an existing workbook, and save a
Microsoft Excel Using Excel in the Science Classroom
 Microsoft Excel Using Excel in the Science Classroom OBJECTIVE Students will take data and use an Excel spreadsheet to manipulate the information. This will include creating graphs, manipulating data,
Working with Charts Stratum.Viewer 6
 Working with Charts Stratum.Viewer 6 Getting Started Tasks Additional Information Access to Charts Introduction to Charts Overview of Chart Types Quick Start - Adding a Chart to a View Create a Chart with
6. Essential Spreadsheet Operations
 6. Essential Spreadsheet Operations 6.1 Working with Worksheets When you open a new workbook in Excel, the workbook has a designated number of worksheets in it. You can specify how many sheets each new
Lesson 1: Exploring Excel Return to the Excel 2007 web page
 Lesson 1: Exploring Excel 2007 Return to the Excel 2007 web page Presenting Excel 2007 Excel can be used for a wide variety of tasks: Creating and maintaining detailed budgets Tracking extensive customer
USING ODBC COMPLIANT SOFTWARE MINTRAC PLUS CONTENTS:
 CONTENTS: Summary... 2 Microsoft Excel... 2 Creating a New Spreadsheet With ODBC Data... 2 Editing a Query in Microsoft Excel... 9 Quattro Pro... 12 Creating a New Spreadsheet with ODBC Data... 13 Editing
download instant at
 CHAPTER 1 - LAB SESSION INTRODUCTION TO EXCEL INTRODUCTION: This lab session is designed to introduce you to the statistical aspects of Microsoft Excel. During this session you will learn how to enter